. 2025 Jan 7;28(2):111770.
doi: 10.1016/j.isci.2025.111770. eCollection 2025 Feb 21.

Super-enhancers and efficacy of triptolide in small cell carcinoma of the ovary hypercalcemic type

Affiliations

Super-enhancers and efficacy of triptolide in small cell carcinoma of the ovary hypercalcemic type

Jessica D Lang et al. iScience. .

Abstract

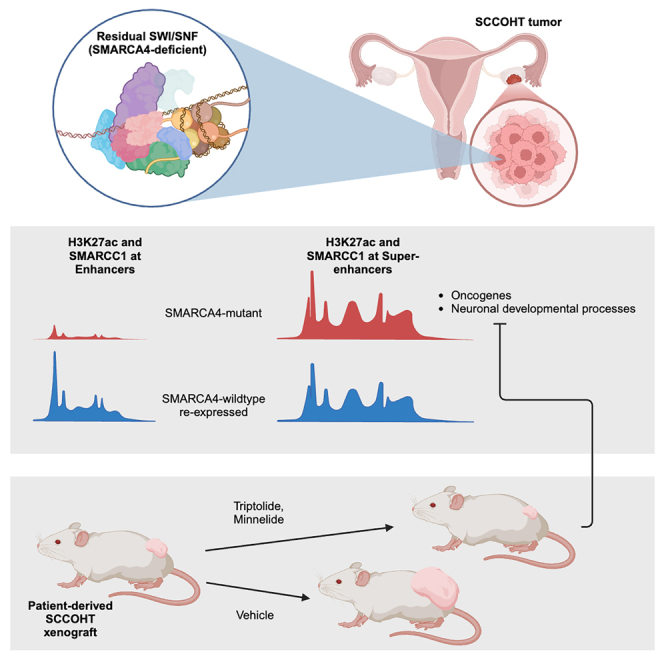
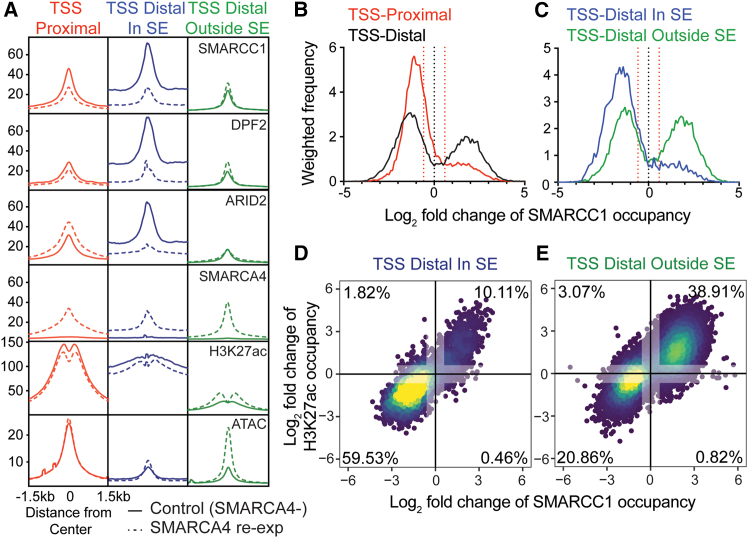
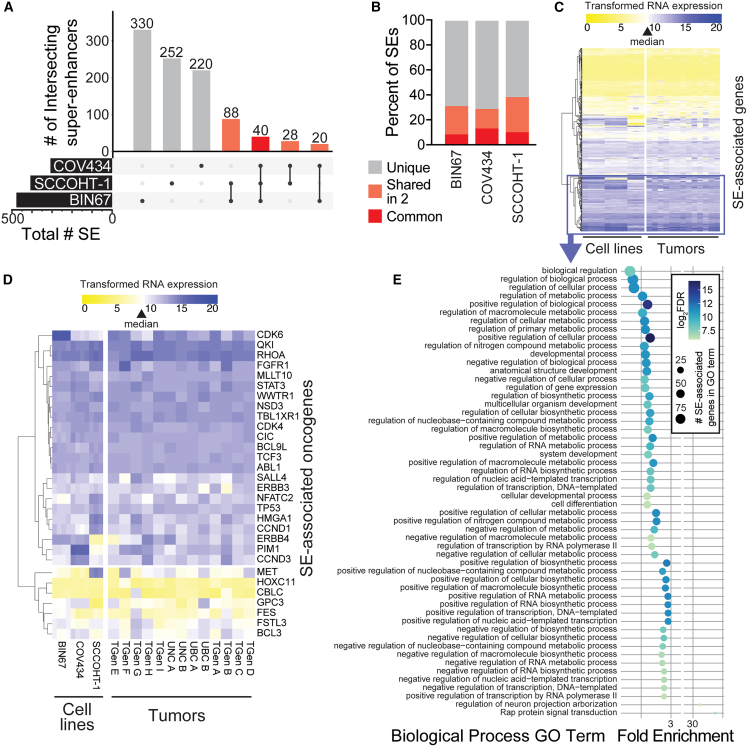
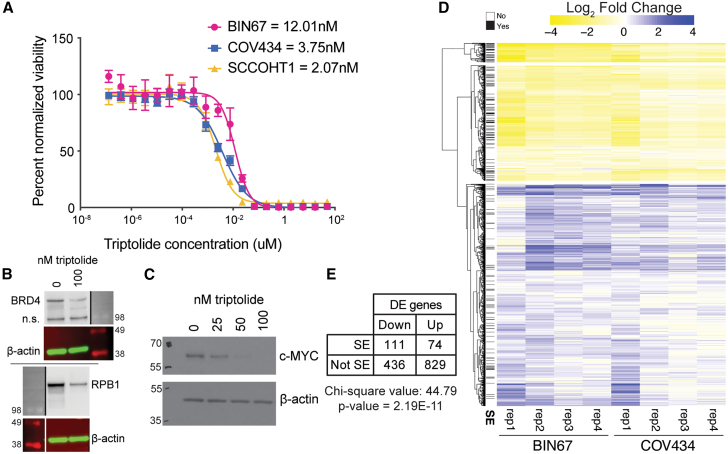
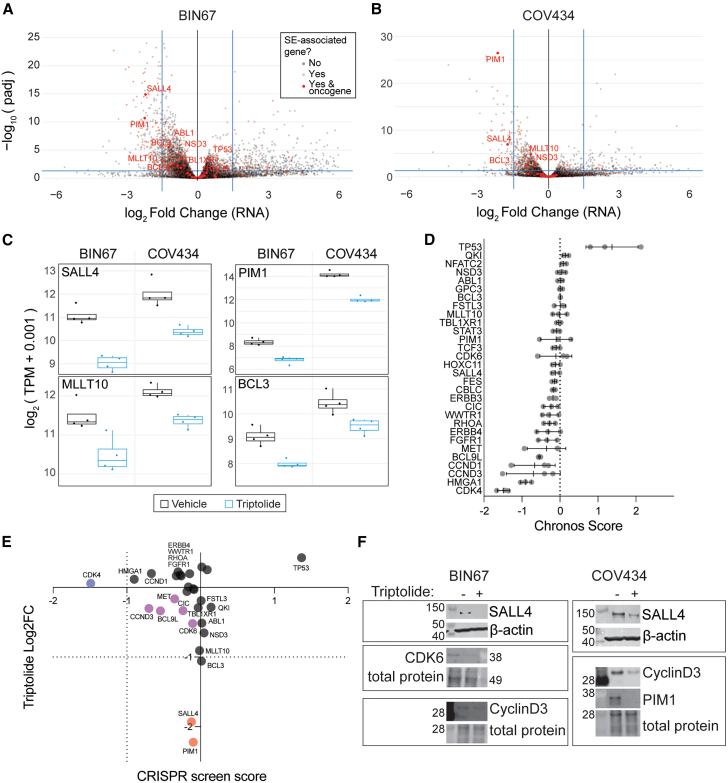
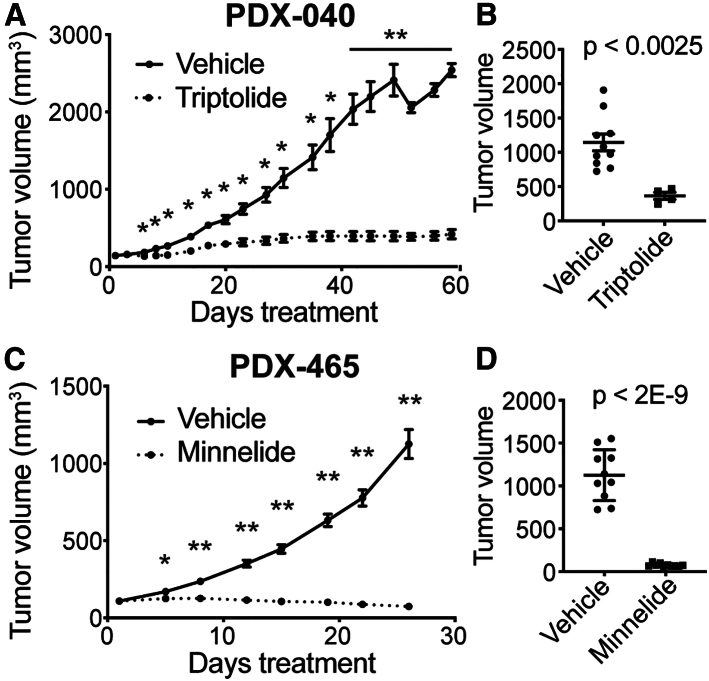
Small cell carcinoma of the ovary-hypercalcemic type (SCCOHT) is a rare ovarian cancer affecting young females and is driven by the loss of both SWI/SNF ATPases SMARCA4 and SMARCA2. As loss of SWI/SNF alters enhancers, we hypothesized that super-enhancers, which regulate oncogene expression in cancer, are disparately impacted by SWI/SNF loss. We discovered differences between SWI/SNF occupancy at enhancers vs. super-enhancers. SCCOHT super-enhancer target genes were enriched in developmental processes, most notably nervous system development. This may further support neuronal cell-of-origin previously proposed. We found high sensitivity of SCCOHT cell lines to triptolide. Triptolide inhibits expression of many super-enhancer-associated genes, including oncogenes. SALL4 expression is decreased by triptolide and is highly expressed in SCCOHT tumors. In patient-derived xenograft models, triptolide and prodrug minnelide effectively inhibit tumor growth. These results reveal unique features of super-enhancers in SCCOHT, which may be one mechanism through which triptolide has high activity in these tumors.

Keywords: Cancer; Complex system biology; Molecular biology.


Conflict of interest statement

Since their contributions to this manuscript, several authors have new institutional affiliations not listed in the author affiliations: William Selleck - current affiliation: CellProtein Sciences, LLC (consultant); Shawn Striker - current affiliation: The Ohio State University; Nicolle Hipschman - current affliation: University of Arizona; Salvatore J Facista - current affiliation: Anivive; William P. D. Hendricks - current affiliation: Actual Labs Advisory (advisor and consultant), Vetted Capital (Venture Partner & Scientific Advisor), MI:RNA Diagnostics (Product Development Advisor); Krystal A. Orlando - current affiliation: National Institute of Environmental Health Sciences, National Institutes of Health; Elizabeth A. Raupach - current affiliation: Mayo Clinic in Arizona.

Figures

None
Graphical abstract
Figure 1
Figure 1
SWI/SNF binding at super-enhancer vs. non-super-enhancer sites SWI/SNF occupancy sites from BIN67 cells (ChIP data re-analyzed from Pan et al. are annotated as proximal (overlapping TSS, 17,866 sites) or distal (>2 kb; 18,997 sites) to TSS. Distal sites are separated by those overlapping SE sites (In SE; 4,518 sites), as determined by ROSE on H3K27ac ChIP data, and those non-overlapping those sites (Outside SE; 14,479 sites). (A) Average chromatin occupancy profile of SWI/SNF subunits SMARCC1, DPF2, ARID2, and SMARCA4, as well as H3K27ac and ATAC signal at SWI/SNF-occupied sites, with and without SMARCA4 re-expression. Average ChIP/ATAC signal across region type spanning 1.5kb up- and downstream of the peak center is shown. (B and C) Histograms of log2 fold-change of SMARCC1 IP signal in SMARCA4 re-expression vs. control expression BIN67 cells at (B) proximal vs. distal SWI/SNF binding sites or (C) distal sites within or outside SE, as described in (A). Histogram frequencies are weighted based on the total number of sites in each group (e.g., number of proximal vs. distal SWI/SNF binding sites). Positive values indicate more SMARCC1 occupancy at sites defined as SWI/SNF occupied sites from either control or SMARCA4-re-expression conditions, and negative values indicate less SMARCC1 occupancy at those sites with SMARCA4 re-expression. +/−1.5-fold change is demarcated by the dotted red line. (D and E) Log2 fold-change of SMARCC1 occupancy vs. H3K27ac at each SWI/SNF site. Plot is colored based on the density of points, with yellow being the highest density and blue being the lowest. The percent of total SWI/SNF sites that had +/− 1.5-fold change in SMARCC1 and H3K27ac is annotated, and values between −1.5 and 1.5 for each are grayed out to indicate which values are considered in this calculation. See also Figure S1.
Figure 2
Figure 2
SE landscape and associated gene expression in SCCOHT cell lines and tumors (A) UpSet plot of overlapping SE regions in three SCCOHT cell lines. SEs were identified by ROSE or CREAM across three replicate H3K27ac CUT&RUN experiments in each cell line and merged for each cell line, then compared using Intervene. Overlapping SE regions are shown in shades of red, with bold red representing overlap in all three cell lines. (B) For each cell line, the percentage of SEs classifying as “unique,” “shared in 2”, or “common” are shown. Colors match those in (A). (C and D) Unsupervised hierarchical clustering of variance stabilizing transformed-TPM RNA levels from RNA-seq of (C) 558 genes within 50kb of the 176 SEs identified in more than one SCCOHT cell line or (D) 30 oncogenes within 50kb of any SE identified in SCCOHT cell lines. Three to four replicates of RNA-seq in SCCOHT cell lines (left) or single RNA-seq analyses from thirteen SCCOHT tumors (right) are shown. Sample order is the same in each panel. The color scale is centered on a white value indicating the median expression value of all protein-coding genes across samples (indicated by a triangle in legend), such that purple indicates higher expression and yellow indicates lower expression than any other gene annotated in the genome. The top two clusters in (C) with high expression across cell lines and tumors are highlighted with the purple box and were selected for further gene ontology analysis in (E). (E) Gene ontology (GO) analysis of highly expressed, SE-associated genes using Panther. Bubble plot shows the log2 enrichment score on the x axis, the log2 false discovery rate (FDR) as bubble color, and the size of the SE-associated genes within each term as the bubble size. See also Table S1.
Figure 3
Figure 3
Oncogenes SALL4 and MLLT10 are highly expressed in SCCOHT through a unique super-enhancer (A) RNA expression of SALL4 and MLLT10 from RNA-seq on SCCOHT tumors, age-matched TCGA high-grade serous ovarian carcinoma (HGSC) tumors, normal ovary tissue from ENCODE (ENCODE ovary), and ENCODE reference cell lines (ENCODE reference). FPKM + 0.01 is plotted on a logarithmic scale, with individual circles representing each sample and the box and whiskers plot summarizing the median value (heavy line), upper and lower 25% quartiles (box limits), and error bars showing the highest and lowest values. (B and C) H3K27ac tracks at SALL4 (B) and MLLT10 (C) SEs. The gray boxes indicate the common SE regions between the 3 SCCOHT cell lines. The H3K27ac ChIP-seq tracks from the ENCODE reference cell lines (GM12878, H1-hESC, HSMM, HUVEC, K562, NHEK, and NHLF) are shown on the bottom track for comparison, with each track overlaid according to UCSC Genome Browser’s default settings and colors. See also Figures S2–S4.
Figure 4
Figure 4
Triptolide inhibits super-enhancers in SCCOHT (A) Drug dose-response assay on SCCOHT cell lines treated with triptolide for 72 h. IC50s for each SCCOHT cell line are provided in the key. Data are represented as mean ± SEM. (B) BRD4 and RPB1 western blots on BIN67 cells treated with vehicle (0.01% DMSO) or 100 nM Triptolide for 24 h β-actin serves as a loading control. Molecular weight markers on the same blot are shown, and sizes in kDa are labeled (imaged in different channels). N.s. = non-specific band. Black/white lines indicate that molecular weight markers were imaged in a separate channel and/or cropped lanes. (C) c-Myc western blot on BIN67 cells treated with serial dilutions of triptolide for 24 h β-actin serves as a loading control. Molecular weight markers on the same blot are shown, and sizes in kDa are labeled (imaged in different channels). (D) Differential gene expression in SCCOHT cell lines BIN67 and SCCOHT1 after 6 h of treatment with triptolide. Yellow represents a decrease in expression with triptolide treatment, and purple represents an increase. Genes within 50 kb of an SE are denoted on the left with a black line (SE column). (E) Summary of differentially expressed genes from data in (D). DE genes were annotated by the direction of gene expression change and whether they were 50 kb from an SE. A chi-square test was run to determine whether there was a statistically significant association between direction of change and being near an SE. See also Table S2.
Figure 5
Figure 5
Triptolide inhibits the expression of SE-associated oncogenes (A and B) Volcano plots of differential gene expression of BIN67 (A) and COV434 (B) after treatment with triptolide for 6 h. Blue bars denote p value = 0.05 and log2 Fold Change = ±1.5. SE-associated genes are denoted by red dots, with non-transparent dots indicating SE-associated oncogenes. Those meeting either cutoff are labeled with gene names. (C) RNA expression of notable SE-associated oncogenes with repression of expression by triptolide. Box and whiskers plot summarizes the median value and upper and lower 25% quartiles (box limits), and error bars show the highest and lowest values. (D) Mean CRISPR screen cell viability score (Chronos score) for SE-associated oncogenes in BIN67, COV434, and SCCOHT1. Error bars represent +/− one standard deviation. (E) SCCOHT cell line average DepMap CRISPR screen score versus average triptolide treated log2 fold change in RNA expression of SE-associated oncogenes. Gene names are as indicated, except for clusters with no appreciable difference in either assay. Genes highlighted in blue indicate CRISPR screen-specific hits, red indicates differential expression hits, and purple indicates some intermediate hits on both screens. (F) Western blots for SE-associated oncogenes in BIN67 and COV434 cells treated with 50 nM triptolide for 24 h. For SALL4, beta-actin serves as a loading control, and for all other proteins, total protein stain was used as a loading control. Molecular weight markers on the same blot are shown, and sizes in kDa are labeled. See also Figure S5.
Figure 6
Figure 6
Efficacy of triptolide/minnelide in SCCOHT in vivo (A and B) SCCOHT PDX model 040 treated with vehicle (DMSO i.p.; N = 10) or triptolide (0.6 mg/kg i.p., QD days 1–5, QOD days 10–60, N = 4). (A) Tumor volume measurements from initiation of treatment (day 1) to study end (day 60). Multiple t-tests were used to determine the p value. ∗ <0.05, ∗∗ <0.0001. (B) Tumor volume measurements at day 30. Student’s t test was used to determine the p-value. (C and D) SCCOHT PDX model 465 treated with vehicle (PBS i.p., N = 10) or minnelide (0.42 mg/kg i.p., QD, N = 10). (C) Tumor volume measurements from initiation of treatment (day 1) to study end (day 26). A paired t test was used to determine the p value. (D) Tumor volume measurements at day 26. Student’s t test was used to determine the p value. Data are represented as mean ± SEM throughout. See also Figure S6.

References

    1. Witkowski L., Goudie C., Ramos P., Boshari T., Brunet J.-S., Karnezis A.N., Longy M., Knost J.A., Saloustros E., McCluggage W.G., et al. The influence of clinical and genetic factors on patient outcome in small cell carcinoma of the ovary, hypercalcemic type. Gynecol. Oncol. 2016;141:454–460. doi: 10.1016/j.ygyno.2016.03.013. - DOI - PMC - PubMed
    1. Tischkowitz M., Huang S., Banerjee S., Hague J., Hendricks W.P.D., Huntsman D.G., Lang J.D., Orlando K.A., Oza A.M., Pautier P., et al. Small-Cell Carcinoma of the Ovary, Hypercalcemic Type-Genetics, New Treatment Targets, and Current Management Guidelines. Clin. Cancer Res. 2020;26:3908–3917. doi: 10.1158/1078-0432.CCR-19-3797. - DOI - PMC - PubMed
    1. Witkowski L., Carrot-Zhang J., Albrecht S., Fahiminiya S., Hamel N., Tomiak E., Grynspan D., Saloustros E., Nadaf J., Rivera B., et al. Germline and somatic SMARCA4 mutations characterize small cell carcinoma of the ovary, hypercalcemic type. Nat. Genet. 2014;46:438–443. doi: 10.1038/ng.2931. - DOI - PubMed
    1. Karnezis A.N., Wang Y., Ramos P., Hendricks W.P., Oliva E., D’Angelo E., Prat J., Nucci M.R., Nielsen T.O., Chow C., et al. Dual loss of the SWI/SNF complex ATPases SMARCA4/BRG1 and SMARCA2/BRM is highly sensitive and specific for small cell carcinoma of the ovary, hypercalcaemic type. J. Pathol. 2016;238:389–400. doi: 10.1002/path.4633. - DOI - PMC - PubMed
    1. Ramos P., Karnezis A.N., Hendricks W.P.D., Wang Y., Tembe W., Zismann V.L., Legendre C., Liang W.S., Russell M.L., Craig D.W., et al. Loss of the tumor suppressor SMARCA4 in small cell carcinoma of the ovary, hypercalcemic type (SCCOHT) Rare Dis. 2014;2 doi: 10.4161/2167549X.2014.967148. - DOI - PMC - PubMed