. 2025 Jan 4;28(2):111758.
doi: 10.1016/j.isci.2025.111758. eCollection 2025 Feb 21.

Multilevel plasticity and altered glycosylation drive aggressiveness in hypoxic and glucose-deprived bladder cancer cells

Affiliations

Multilevel plasticity and altered glycosylation drive aggressiveness in hypoxic and glucose-deprived bladder cancer cells

Andreia Peixoto et al. iScience. .

Abstract

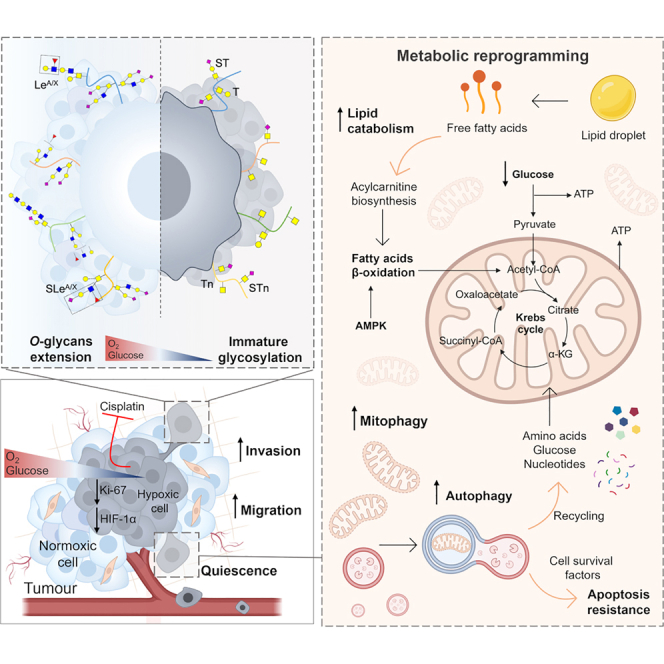
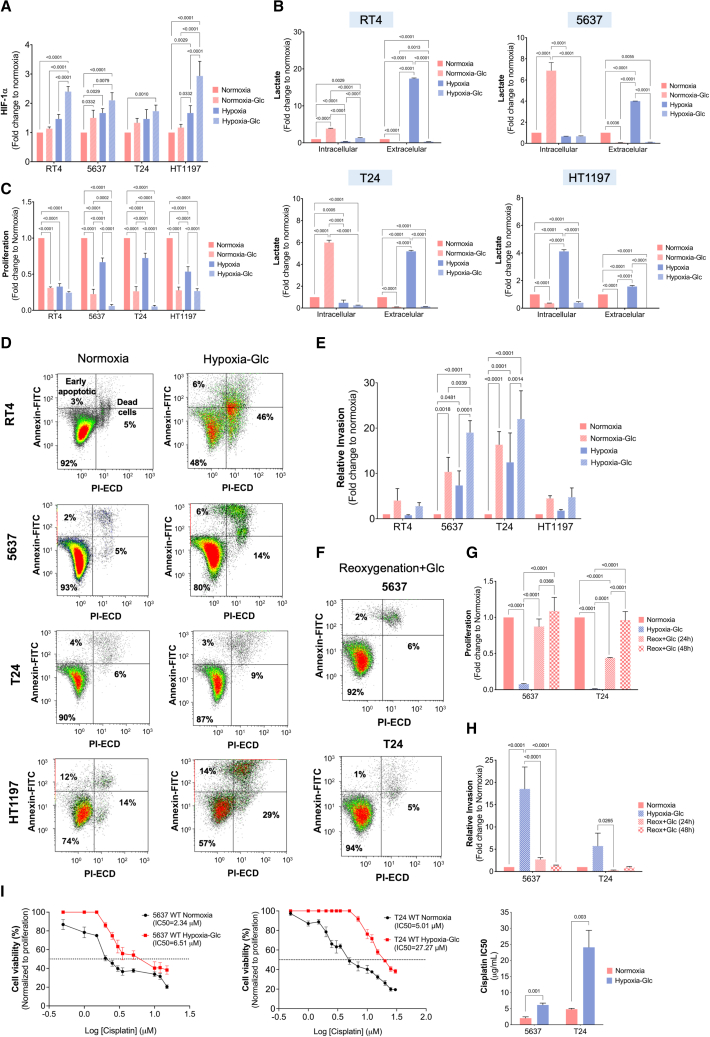
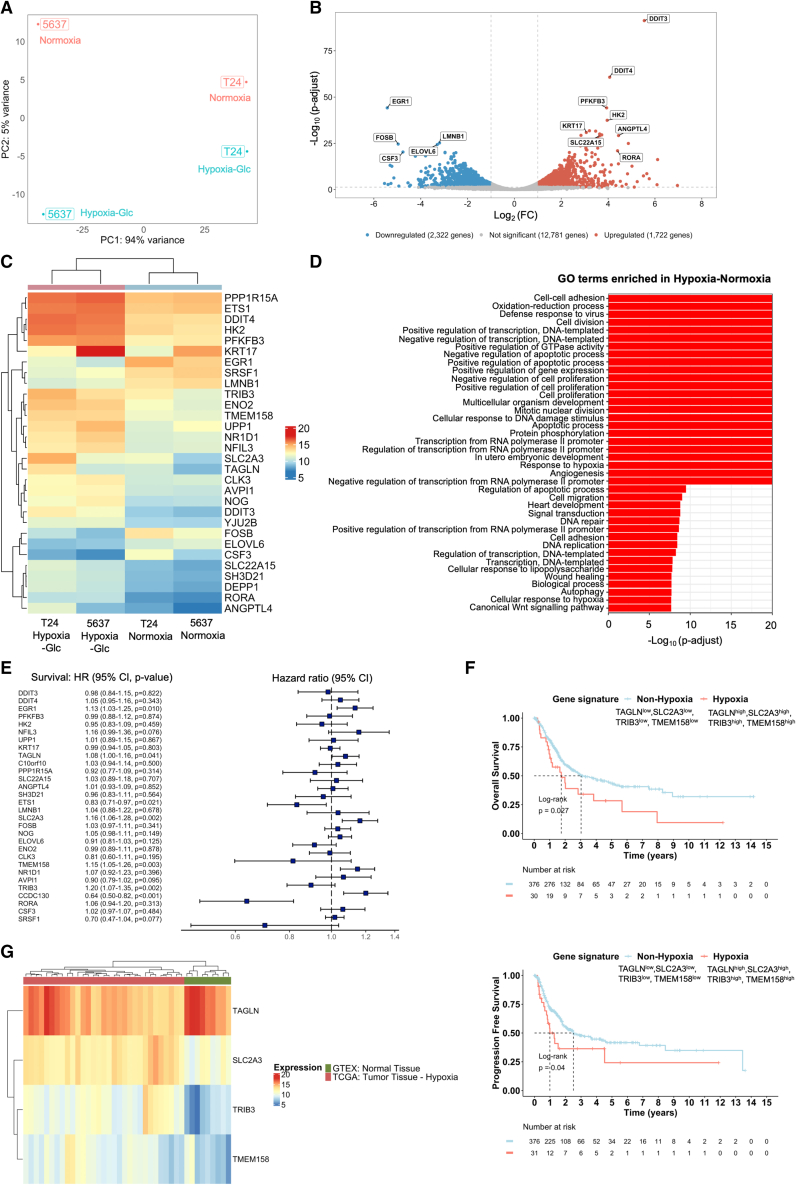
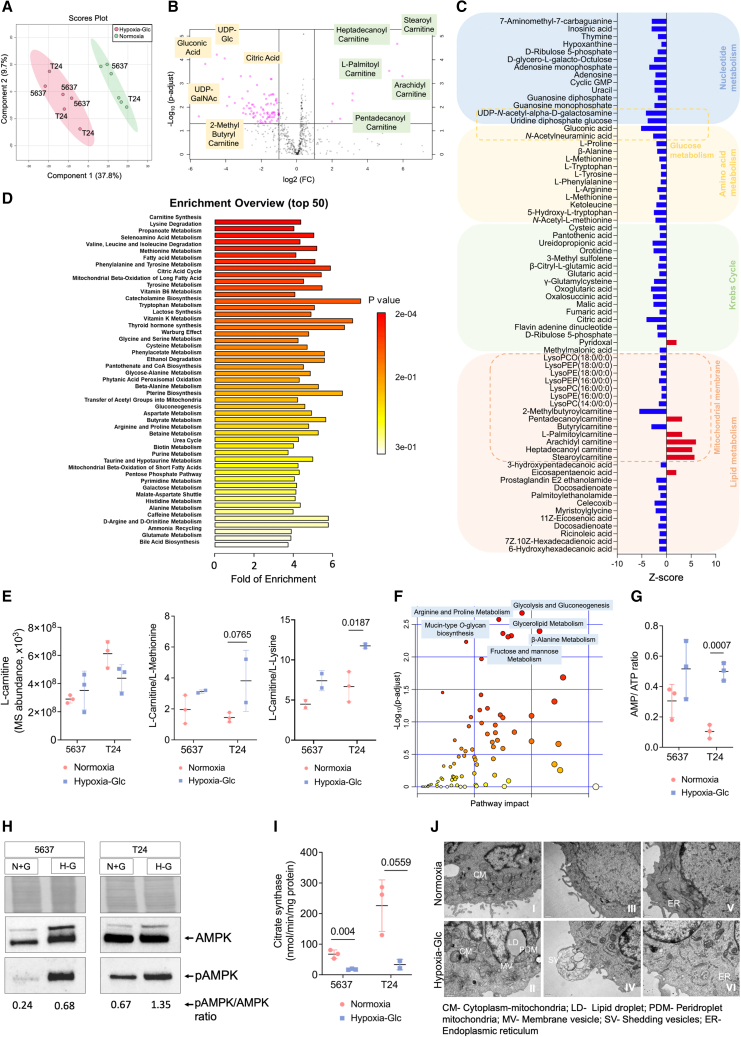
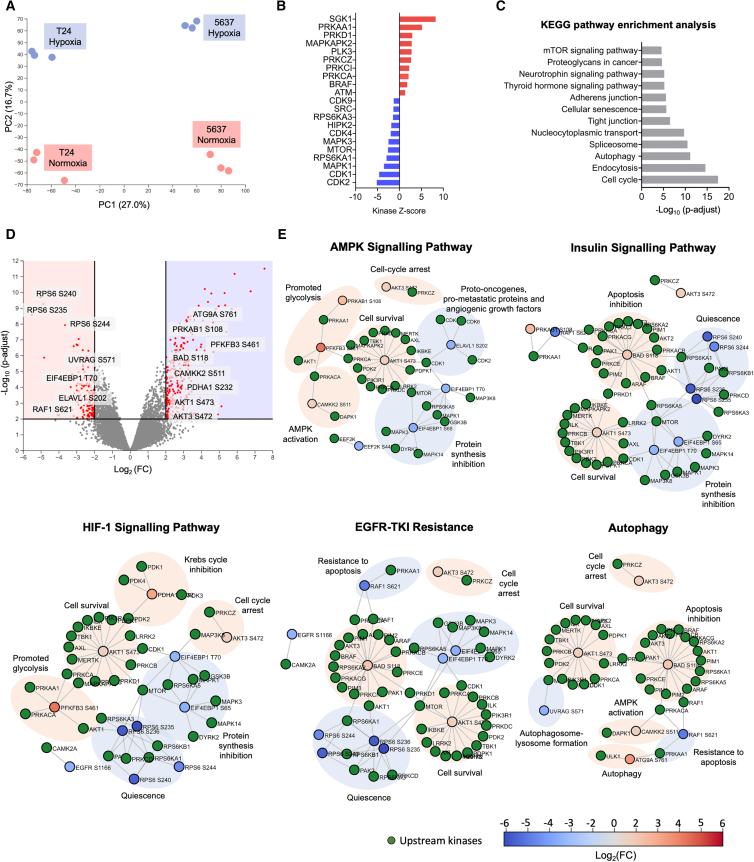
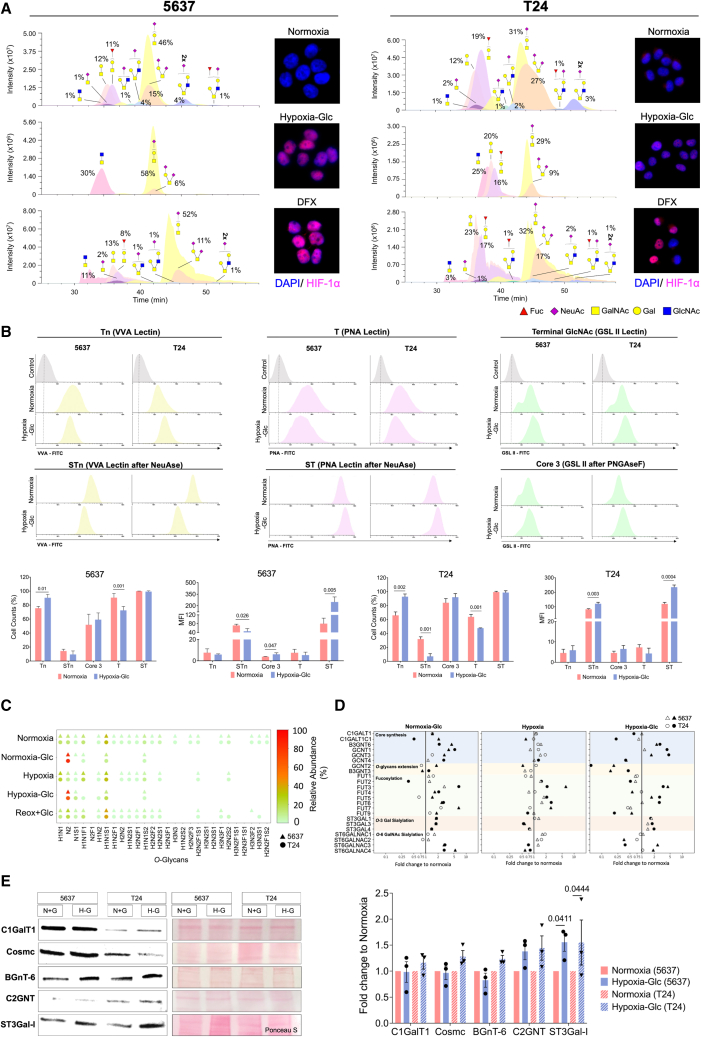
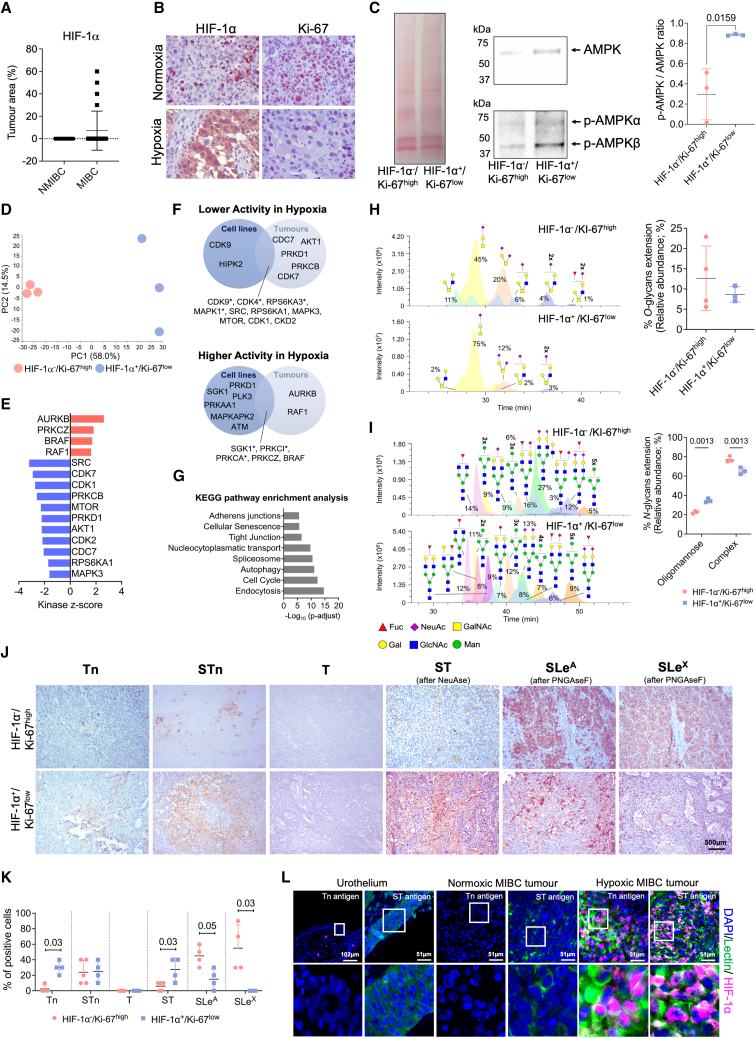
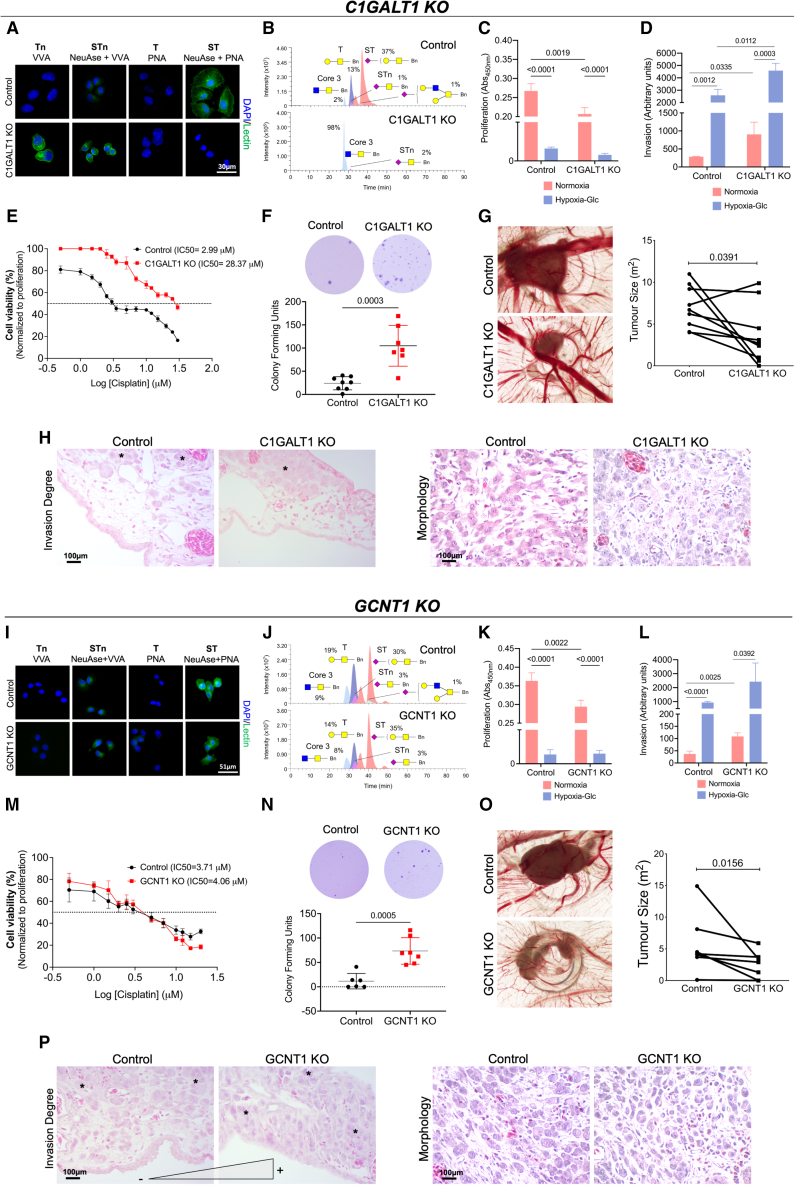
Bladder tumors with aggressive characteristics often present microenvironmental niches marked by low oxygen levels (hypoxia) and limited glucose supply due to inadequate vascularization. The molecular mechanisms facilitating cellular adaptation to these stimuli remain largely elusive. Employing a multi-omics approach, we discovered that hypoxic and glucose-deprived cancer cells enter a quiescent state supported by mitophagy, fatty acid β-oxidation, and amino acid catabolism, concurrently enhancing their invasive capabilities. Reoxygenation and glucose restoration efficiently reversed cell quiescence without affecting cellular viability, highlighting significant molecular plasticity in adapting to microenvironmental challenges. Furthermore, cancer cells exhibited substantial perturbation of protein O-glycosylation, leading to simplified glycophenotypes with shorter glycosidic chains. Exploiting glycoengineered cell models, we established that immature glycosylation contributes to reduced cell proliferation and increased invasion. Our findings collectively indicate that hypoxia and glucose deprivation trigger cancer aggressiveness, reflecting an adaptive escape mechanism underpinned by altered metabolism and protein glycosylation, providing grounds for clinical intervention.

Keywords: Biological sciences; Cancer; Cancer systems biology; Health sciences; Internal medicine; Medical specialty; Medicine; Natural sciences; Oncology; Systems biology.


Conflict of interest statement

The authors declare no competing interests.

Figures

None
Graphical abstract
Figure 1
Figure 1
BLCA cells exhibit remarkable tolerance to hypoxia and low glucose, adopting a quasi-quiescent and more aggressive invasive behavior (A) Hypoxia or low glucose (normoxia-Glc) significantly upregulates HIF-1α expression in BLCA cell lines, which is further enhanced when combined (hypoxia-Glc). (B) BLCA cells cultured in hypoxia and low glucose produce residual levels of lactate. Individually, these stressors induce the production of lactate. (C) Hypoxia and low glucose significantly suppress cell proliferation. Individually, low oxygen or low glucose inhibits cell proliferation. The combination of these stressors further exacerbates this effect in all cell lines. (D) BLCA cells maintain their viability under hypoxia and low glucose. The combined environmental stress from hypoxia and low glucose does not significantly impact the viability of 5637 and T24 cells. RT4 and HT1197 cells exhibit a 30%–45% reduction in viability under these conditions, suggesting a limited adaptive capacity. (E) BLCA cells display increased invasiveness under hypoxia or low glucose. This is significantly potentiated when both stimuli are combined. (F) BLCA cells demonstrate remarkable adaptability to microenvironmental changes with minimal impact on cell viability. Restoring oxygen and glucose levels does not affect cell viability, underscoring the high plasticity of these cells to endure drastic microenvironmental changes. (G) BLCA cells restore basal proliferation after 48 h of reoxygenation with glucose restoration. Both 5637 and T24 cells regain proliferative capacity, fully reinstating proliferation after 48 h, highlighting their plasticity in responding to microenvironmental challenges. (H) After 24 h of reoxygenation with glucose restoration, BLCA cells exhibit a significant reduction in invasion, which is fully restored under normoxia after 48 h. (I) Hypoxia and low glucose increase T24 cells' resistance to cisplatin across a wide range of concentrations, including its IC50, whereas 5637 cells remain unchanged. Error bars represent mean ± SD for three independent experiments. One-way ANOVA followed by Tukey’s multiple comparison test and the Mann-Whitney test were used for statistical analysis. Results were considered statistically significant when p < 0.05.
Figure 2
Figure 2
BLCA cell lines under hypoxia and low glucose experience profound transcriptome remodeling, linked to the acquisition of more aggressive phenotypes, which is supported by the poor prognosis observed in TCGA-BLCA patients (A) BLCA cell lines under hypoxia and low glucose display distinct transcriptomes but share common responses to these conditions. PCA for transcriptomics data reveals that PC1 (94% variance) primarily distinguishes differences between cell lines, whereas PC2 (5% variance) highlights marked changes between normoxic and stressed cells. (B) The volcano plot showcases global transcriptional changes between normoxia and hypoxia plus low glucose. Exposure to these stressors alters the expression of 4,044 genes (1,722 upregulated, 2,322 downregulated), indicating significant transcriptome remodeling. (C) Bi-clustering heatmap of the top 30 differentially expressed genes illustrates co-regulation under stress, supporting proliferation arrest, resistance to cell death, and invasion. Heatmap plots log2 transformed expression values of genes in samples. (D) Enrichment analysis of GO terms for differentially expressed genes reveals alterations in key pathways associated with cell-cell adhesion, cell proliferation, and resistance to cell death. (E) Prognostic evaluation identifies a hypoxia and glucose-deprivation-linked four-gene signature (TAGLNhigh; SLC2A3high; TRIB3high; TMEM158high). Univariate Cox regression analysis of the top 30 differentially expressed genes identifies seven genes associated with OS. Higher expression levels of four genes, upregulated under hypoxia and low glucose, significantly correlate with poor OS, constituting a stress signature. (F) Validation of the prognosis significance of the hypoxia-related four-gene signature in BLCA patients from TCGA. Kaplan-Meier curves of OS and PFS show significantly worse clinical outcomes for patients displaying the stress-related gene signature compared to the remaining patients in the cohort. (G) Bi-clustering heatmap showing the association between the stress-related signature and bladder tumors. Heatmap plots log2 transformed expression values of the four hypoxia-related differentially expressed genes, showing clear differentiation between cancer and healthy bladder samples.
Figure 3
Figure 3
Hypoxia and low glucose shift BLCA cell metabolism from glycolytic to lipolytic, increasing lipid droplet formation and reducing the number of active mitochondria (A–C) PLS-DA analysis reveals similar metabolic responses in 5637 and T24 cells under microenvironmental stress (A). Volcano plot highlights significant metabolome alterations in response to hypoxia and low glucose (B). Downregulated metabolites include UDP-Glc, UDP-GalNAc, gluconic acid, and citric acid, whereas increased metabolites indicate active fatty acid transport and β-oxidation (C). Significant reduction in key metabolites linked to nucleotide, amino acids, Krebs cycle, and lipid metabolism was observed, consistent with catabolic metabolism. An exception is the accumulation of long fatty acid acylcarnitine for transfer across the inner mitochondrial membrane for β-oxidation. (D) Pathway enrichment analysis supports fatty acid β-oxidation as the primary bioenergetic pathway in stressed cells. Key metabolic pathways, including carnitine biosynthesis and lysine/methionine degradation, contribute to fatty acid β-oxidation. (E) Hypoxia and low glucose induce lysine and methionine degradation to support acylcarnitine biosynthesis and lipid β-oxidation. (F) Joint pathway analysis incorporating transcriptomics and metabolomics studies supports changes from glycolytic to lipolytic metabolism, impacting nucleotides and sugars biosynthesis, including O-GalNAc glycans and protein O-glycosylation. (G and H) Hypoxia and low glucose increase AMP/ATP ratio (G) and activate AMPK by phosphorylation (H), indicating impaired oxidative phosphorylation and potential catabolic processes, including mitophagy. (I) Citrate synthase activity decreases under hypoxia and low glucose, suggesting a reduction in functional mitochondria. (J) TEM analysis reveals major morphological changes, including compromised mitochondria, lipid droplets, peridroplet mitochondria, membrane vesicles, and increased shedding of vesicles, indicating membrane activity changes under stress. Error bars represent mean ± SD for three independent experiments. Mann-Whitney test was used for statistical analysis. Results were considered statistically significant when p < 0.05.
Figure 4
Figure 4
Hypoxia and low glucose induce major cell signaling rewiring, promoting aggressiveness via cell-cycle arrest, quiescence, apoptosis resistance, glycolytic metabolism blockage, and autophagy (A) Despite cell-related differences, common features in oncogenic signaling are elicited by hypoxia and glucose deprivation, as shown by PCA analysis of phosphoproteome signatures. PC1 (27% variance) distinguishes cell-dependent differences, whereas PC2 (17% variance) relates to marked signaling changes linked to hypoxia and glucose deprivation. (B) Kinase-substrate enrichment analysis scores each kinase based on substrate phosphorylation, highlighting major alterations in stressed cells. Red indicates significantly activated kinases, whereas blue indicates significantly inhibited ones (Z score ≥2 or ≤2). (C) KEGG pathway enrichment analysis of phosphoproteomics data shows significant alterations in cell signaling pathways supporting cell motility, cellular senescence, and autophagy under stress. (D) Volcano plot showcases global cell signaling rewiring between normoxia and hypoxia plus low glucose, indicating the most significantly hyper- or hypo-phosphorylated proteins and precise annotation of main phosphorylation sites. (E) AMPK, insulin signaling, HIF-1α signaling, EGFR-TKI resistance, and autophagy are the most significantly altered pathways in stressed cells. Top-ranked signaling pathways with 2-fold change in stressed cells are presented, highlighting the most significant hyper- or hypo-phosphorylated proteins and precise phosphorylation sites, along with main associated cellular functions.
Figure 5
Figure 5
Hypoxia and low glucose impair O-glycans extension in BLCA, originating a simple cancer cell glycophenotype (A) BLCA cells exposed to hypoxia and low glucose exhibit less abundant, simpler, and shorter glycomes, lacking extensions beyond core 1 structures. nanoLC-MS/MS analysis shows that this glycophenotype is characterized by sialylated T antigens and core 3, likely due to decreased typical core 1 and 2 structures. DFX-treated cells, stabilizing HIF-1α, show no significant alterations in the glycome, suggesting that changes observed in stressed cells are not driven by HIF-1α. (B) Lectin affinity studies show significant upregulation of Tn and sialylated T antigens (recognized by PNA lectin after Neuraminidase [NeuAse] digestion) under stress, in accordance with MS-based glycomics. Notably, core 3 O-glycans (evaluated by GSL II lectin after PNGase F digestion) remain unchanged, highlighting that cellular stress primarily suppresses core 1/2 O-glycans, rather than increasing core 3 O-glycans. (C) Glucose suppression is the primary driver of glycome remodeling, which can be reversed by reoxygenation and restoration of glucose. (D) Glycogene remodeling is primarily driven by the combined effects of hypoxia and glucose deprivation and leads to a premature halt in glycans extension beyond core 1. C1GALT1C1, necessary for core 1 biosynthesis, is downregulated, whereas ST3GAL1, 3, and 4 are overexpressed, increasing sialylated T antigens and inhibiting core 2 formation. Downregulation of GCNT4 also contributes to core 2 inhibition. Interestingly, elevated GCNT1 and GCNT3 potentially counterbalance core 2 suppression. (E) Quantification of key enzymes involved in O-glycan elongation (C1GalT1; Cosmc; BGnT-6; C2GNT; ST3Gal-I) shows significant upregulation of ST3Gal-1 in stressed cells, consistent with transcriptomics. The others remain unchanged, indicating distinct regulation between glycogenes and glycosyltransferases under these conditions. Bold circles and triangles represent statistically significant changes in T24 and 5637 cell lines, respectively. Error bars represent mean ± SD for three independent experiments. Mann-Whitney Test was used for statistical analysis. Results were considered statistically significant when p < 0.05.
Figure 6
Figure 6
Hypoxic BLCA, characterized by high nuclear HIF-1α expression and low proliferation, shares malignant molecular features with hypoxic and glucose-deprived cells in vitro, including simple glycophenotypes (A and B) Roughly 10% of MIBC tumors display a hypoxic fingerprint (HIF-1αpositive/Ki-67low) that was not observed in NMIBC and most MIBC tumors (HIF-1αnegative/Ki-67high), indicating a potential link to aggressiveness. (C) Hypoxic tumors display significantly higher AMPK phosphorylation compared to proliferative cases, denoting a catabolic state. (D) Hypoxic tumors show distinct cellular signaling pathway activation compared to proliferative tumors. PCA for phosphoproteomics data indicates that PC1 (58% variance) primarily separates hypoxic from proliferative tumors, whereas PC2 (15% variance) highlights marked differences among hypoxic tumors. (E) Kinase-Substrate enrichment analysis supports major cell rewiring in hypoxic tumors. Kinases color-coded in red are significantly activated, whereas blue is significantly inactivated. (F) Hypoxic tumors share common kinase activation patterns with stressed BLCA cells in vitro. (G) KEGG pathway enrichment analysis indicates significant alterations in cell signaling pathways, promoting cell motility, cellular senescence, and autophagy in hypoxic tumors as found in stressed cells in vitro. (H) Hypoxic tumors present simple O-glycophenotypes compared to proliferative tumors. nanoLC-MS/MS reveals more homogeneous O-glycome in hypoxic tumors with scarce core 2 glycans. We represent the most abundant structures also found in cell lines, keeping reference to their original relative abundance in relation to all identified glycan species. (I) Hypoxic tumors N-glycome is enriched for oligomannose N-glycans, whereas proliferative tumors are enriched for complex N-glycans. (J and K) Hypoxic tumors show higher levels of Tn and sialylated T antigens and lower levels of sialylated Lewis antigens in O-glycans compared to proliferative tumors, reinforcing the primary suppression of O-glycan extension. NeuAse means sialidase neuraminidase. (L) In hypoxic tumors, Tn and sialylated T antigens co-localize with high HIF-1α. Normoxic, proliferative tumors lack HIF-1α and show low levels of sialylated T antigens and no Tn antigens. Healthy urothelium from non-cancerous individuals served as a negative control for HIF-1α, low Tn, and sialylated T antigens expression. Unpaired t test and Mann-Whitney test were used for statistical analysis. Results were considered statistically significant when p < 0.05.
Figure 7
Figure 7
Hypoxia and low-glucose-induced simple glycophenotypes drive relevant cancer-associated hallmarks (A and B) T24 C1GALT1 KOs show complete abrogation of O-glycans extension beyond the Tn antigen, mirroring a major alteration observed in hypoxic tumors. Glycoengineered cells homogeneously express the Tn antigen and show low levels of core 3. Mock controls' glycosylation closely resembles T24 wild-type cells. (C) C1GALT1 KOs display reduced proliferation compared to controls under normoxia. Collectively, altered glycosylation impacts proliferation more when compared to hypoxia and glucose deprivation. (D) Under normoxia and hypoxia with glucose deprivation, C1GALT1 KOs glycoengineered cells display significantly enhanced invasion, suggesting a critical role of C1GALT1 in modulating invasive behavior under stress. (E and F) C1GALT1 KOs demonstrate higher resistance to cisplatin (E) and anoikis compared to mock controls (F). (G and H) In CAMs, C1GALT1 KOs give rise to smaller tumors (G), in agreement with proliferation studies in vitro (C), showing less cohesive features and invasive patterns compared to control (H). (I and J) T24 GCNT1 KOs exhibit complete abrogation of O-glycans extension beyond core 1, mirroring another major alteration observed in hypoxic tumors. As a result, glycoengineered cells express high levels of sialylated T antigens, namely sialyl-T, but do not present core 2-derived glycans. Mock controls' glycosylation closely resembles T24 wild-type cells. (K and L) GCNT1 KOs display reduced proliferation compared to controls (K) and increased invasion (L) under normoxia, resembling C1GALT1 KOs. A higher invasion is also observed under hypoxia-Glc. (M and N) GCNT1 KOs demonstrate similar resistance to cisplatin (M) but higher resistance to anoikis compared to mock controls (N). (O and P) In CAMs, GCNT1 KOs give rise to smaller (O) and more invasive tumors compared to controls (P). Error bars represent mean ± SD for three independent experiments. Unpaired t test, two-way ANOVA followed by Tukey’s multiple comparison test, and Wilcoxon test were used for statistical analysis. Results were considered statistically significant when p < 0.05.

Similar articles

Cited by

References

    1. Tan T.Z., Rouanne M., Tan K.T., Huang R.Y.J., Thiery J.P. Molecular Subtypes of Urothelial Bladder Cancer: Results from a Meta-cohort Analysis of 2411 Tumors. Eur. Urol. 2019;75:423–432. doi: 10.1016/j.eururo.2018.08.027. - DOI - PubMed
    1. Petrova V., Annicchiarico-Petruzzelli M., Melino G., Amelio I. The hypoxic tumour microenvironment. Oncogenesis. 2018;7:10. doi: 10.1038/s41389-017-0011-9. - DOI - PMC - PubMed
    1. Jiang M., Ren L., Chen Y., Wang H., Wu H., Cheng S., Li G., Yu S. Identification of a Hypoxia-Related Signature for Predicting Prognosis and the Immune Microenvironment in Bladder Cancer. Front. Mol. Biosci. 2021;8 doi: 10.3389/fmolb.2021.613359. - DOI - PMC - PubMed
    1. Liberti M.V., Locasale J.W. The Warburg Effect: How Does it Benefit Cancer Cells? Trends Biochem. Sci. 2016;41:211–218. doi: 10.1016/j.tibs.2015.12.001. - DOI - PMC - PubMed
    1. Qiu Y., Li P., Ji C. Cell Death Conversion under Hypoxic Condition in Tumor Development and Therapy. Int. J. Mol. Sci. 2015;16:25536–25551. doi: 10.3390/ijms161025536. - DOI - PMC - PubMed

LinkOut - more resources