

Indirect genetic effects increase the heritable variation available to selection and are largest for behaviors: a meta-analysis
- PMID: 39906585
- PMCID: PMC11790215
- DOI: 10.1093/evlett/qrae051
Indirect genetic effects increase the heritable variation available to selection and are largest for behaviors: a meta-analysis
Abstract
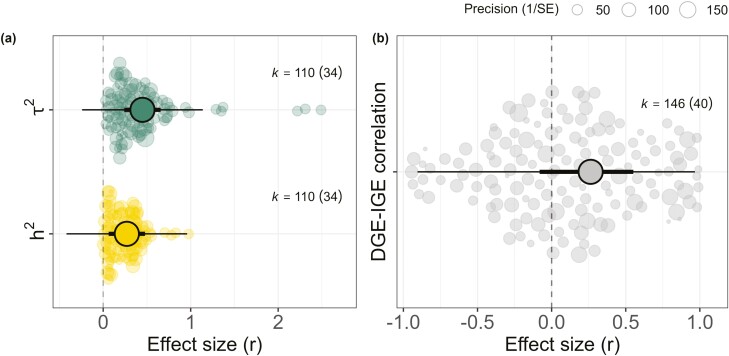
The evolutionary potential of traits is governed by the amount of heritable variation available to selection. While this is typically quantified based on genetic variation in a focal individual for its own traits (direct genetic effects, DGEs), when social interactions occur, genetic variation in interacting partners can influence a focal individual's traits (indirect genetic effects, IGEs). Theory and studies on domesticated species have suggested IGEs can greatly impact evolutionary trajectories, but whether this is true more broadly remains unclear. Here, we perform a systematic review and meta-analysis to quantify the amount of trait variance explained by IGEs and the contribution of IGEs to predictions of adaptive potential. We identified 180 effect sizes from 47 studies across 21 species and found that, on average, IGEs of a single social partner account for a small but statistically significant amount of phenotypic variation (0.03). As IGEs affect the trait values of each interacting group member and due to a typically positive-although statistically nonsignificant-correlation with DGEs (r DGE-IGE = 0.26), IGEs ultimately increase trait heritability substantially from 0.27 (narrow-sense heritability) to 0.45 (total heritable variance). This 66% average increase in heritability suggests IGEs can increase the amount of genetic variation available to selection. Furthermore, whilst showing considerable variation across studies, IGEs were most prominent for behaviors and, to a lesser extent, for reproduction and survival, in contrast to morphological, metabolic, physiological, and development traits. Our meta-analysis, therefore, shows that IGEs tend to enhance the evolutionary potential of traits, especially for those tightly related to interactions with other individuals, such as behavior and reproduction.
Keywords: animal model; associative genetic effects; interacting phenotypes; quantitative genetics; social evolution; social interactions.
© The Author(s) 2024. Published by Oxford University Press on behalf of The Society for the Study of Evolution (SSE) and European Society for Evolutionary Biology (ESEB).
Figures


Similar articles
-
The role of indirect genetic effects in the evolution of interacting reproductive behaviors in the burying beetle, Nicrophorus vespilloides.Ecol Evol. 2019 Jan 18;9(3):998-1009. doi: 10.1002/ece3.4731. eCollection 2019 Feb. Ecol Evol. 2019. PMID: 30805136 Free PMC article.
-
Indirect genetic effects: a key component of the genetic architecture of behaviour.Sci Rep. 2017 Aug 31;7(1):10235. doi: 10.1038/s41598-017-08258-6. Sci Rep. 2017. PMID: 28860450 Free PMC article.
-
Modelling the co-evolution of indirect genetic effects and inherited variability.Heredity (Edinb). 2018 Dec;121(6):631-647. doi: 10.1038/s41437-018-0068-z. Epub 2018 Mar 28. Heredity (Edinb). 2018. PMID: 29588510 Free PMC article.
-
The quantitative genetics of indirect genetic effects: a selective review of modelling issues.Heredity (Edinb). 2014 Jan;112(1):61-9. doi: 10.1038/hdy.2013.15. Epub 2013 Mar 20. Heredity (Edinb). 2014. PMID: 23512010 Free PMC article. Review.
-
Social traits, social networks and evolutionary biology.J Evol Biol. 2017 Dec;30(12):2088-2103. doi: 10.1111/jeb.13195. Epub 2017 Nov 4. J Evol Biol. 2017. PMID: 29044796 Review.
Cited by
-
Indirect genetic effects among neighbors promote cooperation and accelerate adaptation in a small-scale human society.Sci Adv. 2025 Aug;11(31):eads3129. doi: 10.1126/sciadv.ads3129. Epub 2025 Jul 30. Sci Adv. 2025. PMID: 40737417 Free PMC article.
-
Evolutionary feedbacks for Drosophila aggression revealed through experimental evolution.Proc Natl Acad Sci U S A. 2025 Apr 29;122(17):e2419068122. doi: 10.1073/pnas.2419068122. Epub 2025 Apr 24. Proc Natl Acad Sci U S A. 2025. PMID: 40273109
-
Molecular Mechanisms and Regulatory Factors Governing Feed Utilization Efficiency in Laying Hens: Insights for Sustainable Poultry Production and Breeding Optimization.Int J Mol Sci. 2025 Jul 2;26(13):6389. doi: 10.3390/ijms26136389. Int J Mol Sci. 2025. PMID: 40650167 Free PMC article. Review.
-
Towards assessing indirect genetic effects in dairy cattle.Genet Sel Evol. 2025 Jul 21;57(1):42. doi: 10.1186/s12711-025-00988-w. Genet Sel Evol. 2025. PMID: 40691763 Free PMC article.
References
-
- Adams, M. J., Robinson, M. R., Mannarelli, M., & Hatchwell, B. J. (2015). Social genetic and social environment effects on parental and helper care in a cooperatively breeding bird. Proceedings Biological Sciences, 282(1810), 20150689. https://doi.org/10.1098/rspb.2015.0689 - DOI - PMC - PubMed
-
- Alemu, S. W., Berg, P., Janss, L., & Bijma, P. (2016). Estimation of indirect genetic effects in group-housed mink (Neovison vison) should account for systematic interactions either due to kin or sex. Journal of Animal Breeding and Genetics = Zeitschrift fur Tierzuchtung und Zuchtungsbiologie, 133(1), 43–50. https://doi.org/10.1111/jbg.12163 - DOI - PubMed
-
- Alemu, S. W., Bijma, P., Møller, S. H., Janss, L., & Berg, P. (2014). Indirect genetic effects contribute substantially to heritable variation in aggression-related traits in group-housed mink (Neovison vison). Genetics, Selection, Evolution: GSE, 46(1), 30. https://doi.org/10.1186/1297-9686-46-30 - DOI - PMC - PubMed
-
- Arango, J., Misztal, I., Tsuruta, S., Culbertson, M., & Herring, W. (2005). Estimation of variance components including competitive effects of large white growing gilts. Journal of Animal Science, 83(9), 2052–2057. https://doi.org/10.2527/2005.8361241x - DOI - PubMed
-
- Araya-Ajoy, Y. G., Westneat, D. F., & Wright, J. (2020). Pathways to social evolution and their evolutionary feedbacks. Evolution, 74(9), 1894–1907. https://doi.org/10.1111/evo.14054 - DOI - PubMed
LinkOut - more resources
Full Text Sources
Research Materials
