. 2024 Nov 20;10(1):1-15.
doi: 10.1016/j.jacbts.2024.09.004. eCollection 2025 Jan.

Targeting the Gut-Heart Axis Improves Cardiac Remodeling in a Clinical Scale Model of Cardiometabolic Syndrome

Affiliations

Targeting the Gut-Heart Axis Improves Cardiac Remodeling in a Clinical Scale Model of Cardiometabolic Syndrome

Florence M Herisson et al. JACC Basic Transl Sci. .

Abstract

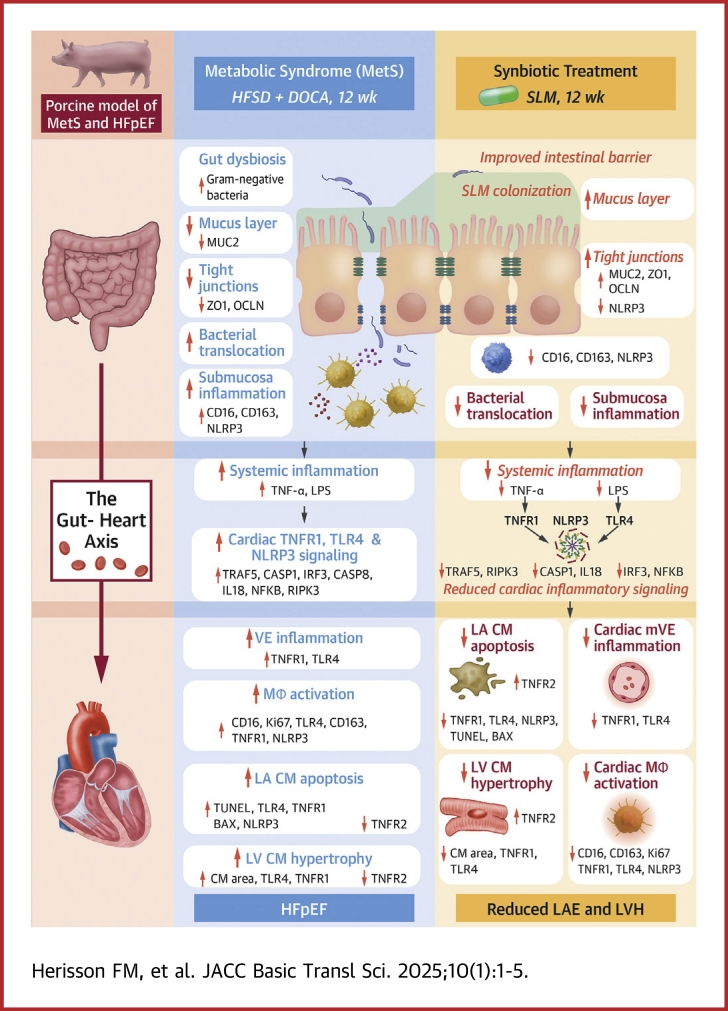
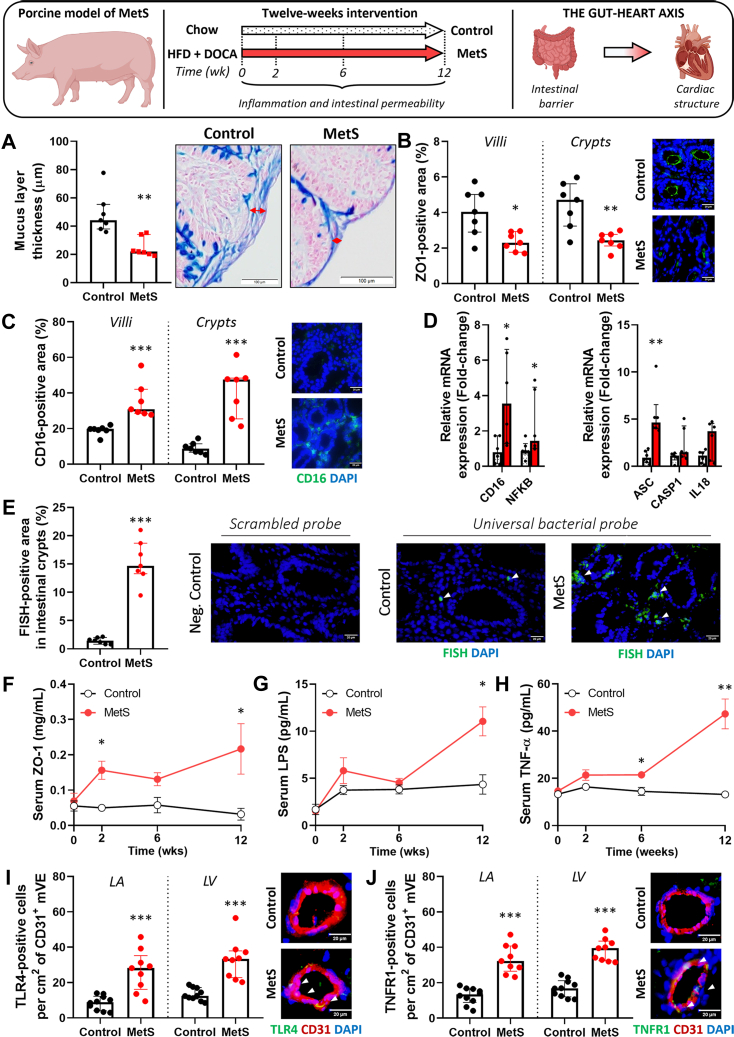
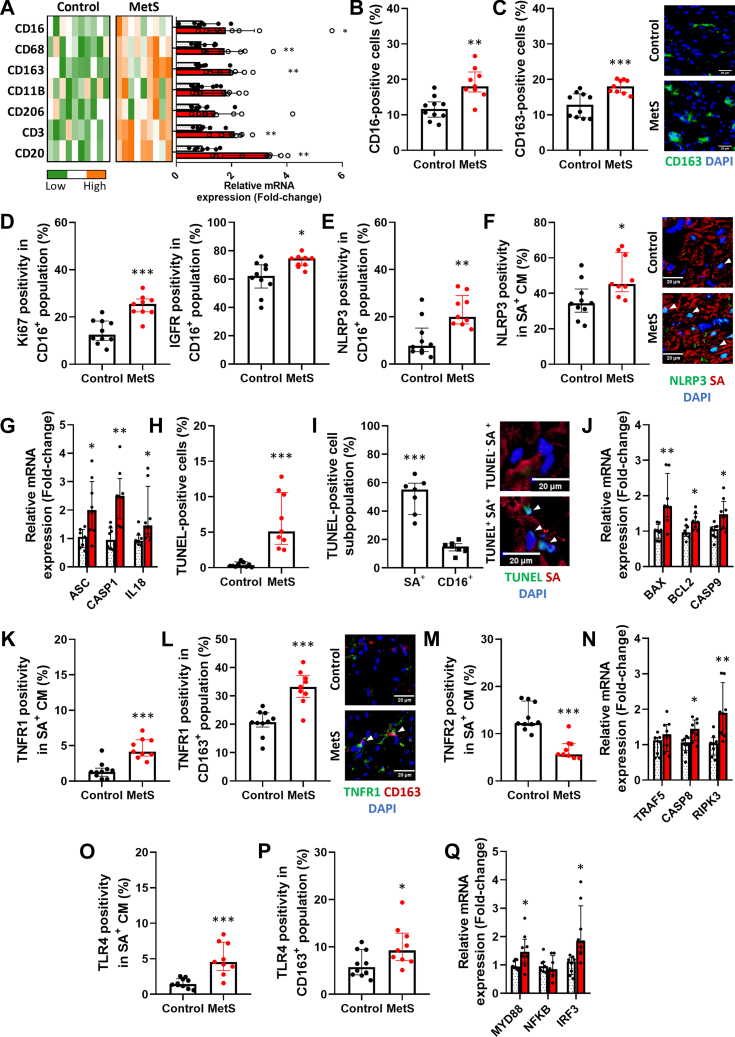
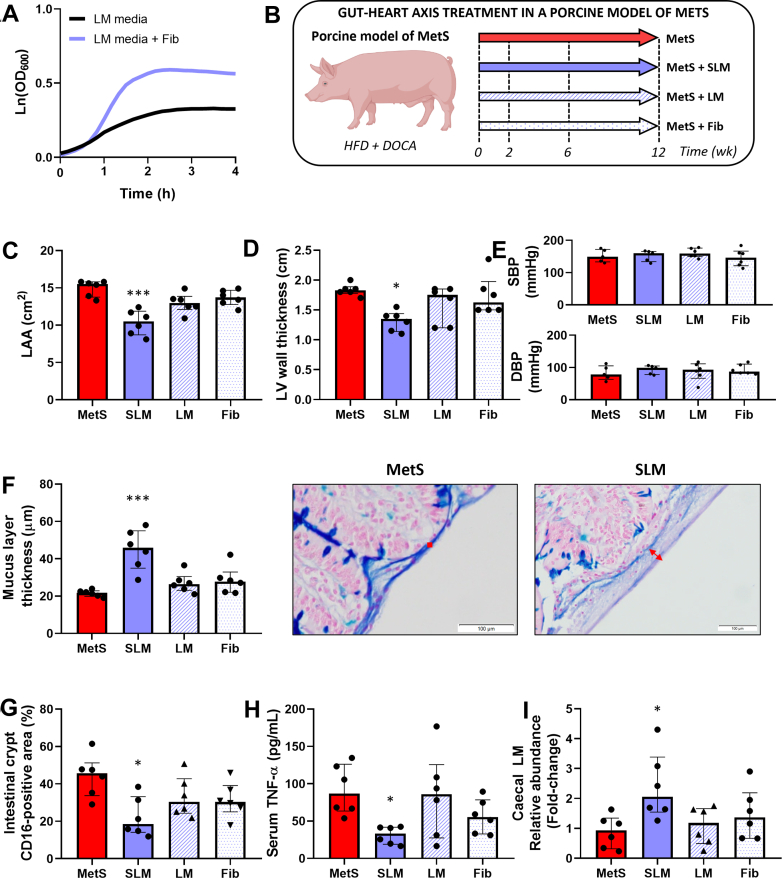
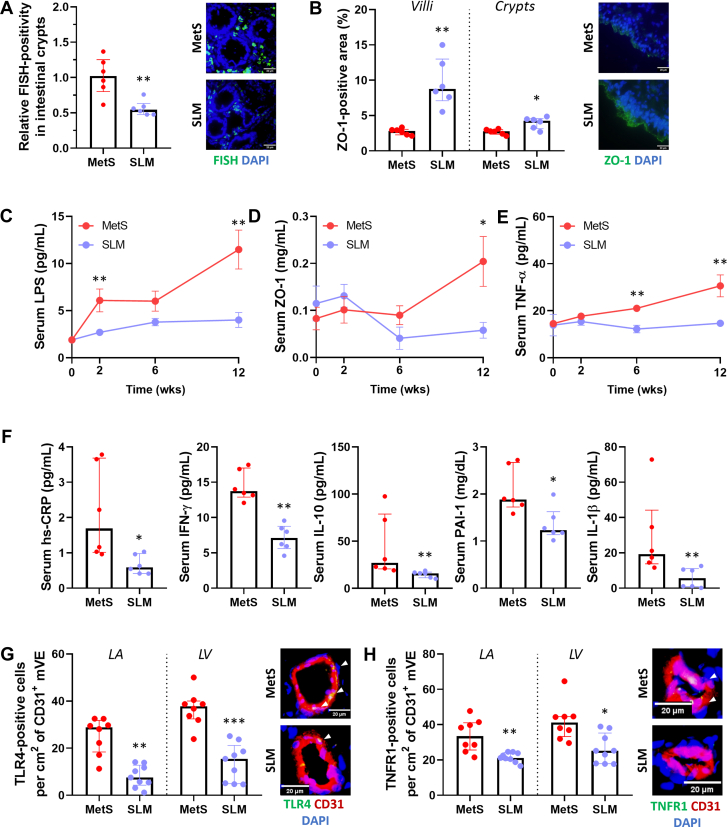
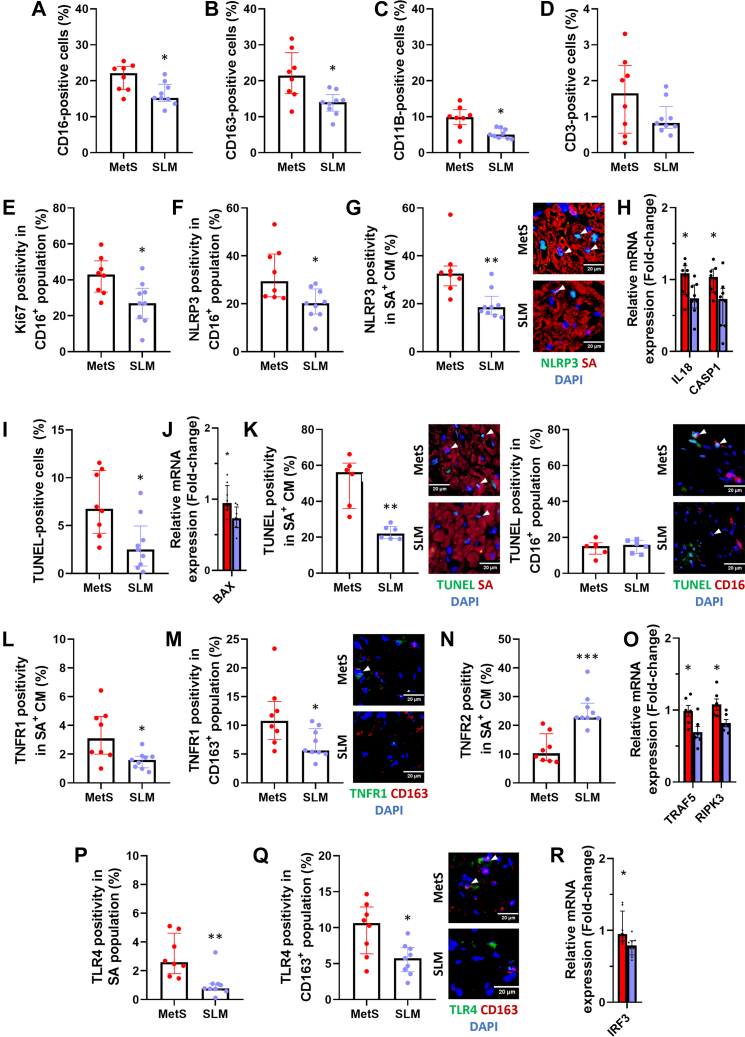
Poor diet, gut dysbiosis, and systemic inflammation constitute a gut-heart axis (GHA) that may affect heart failure with preserved ejection fraction. Clinical scale models to interrogate this axis are limited. Here, we show the full extent of the GHA-gut barrier function loss, systemic and microvascular inflammation, and its colocalization with apoptosis (left atrium) and hypertrophy (left ventricle). Gut barrier function primacy in regulating the GHA is supported by a synbiotic intervention that shuts down gut epithelial permeability, markedly decreasing systemic inflammation and, remarkably, cardiac structural changes in left heart chambers. These data support a new paradigm for targeting heart failure with preserved ejection fraction via the GHA.

Keywords: heart failure; metabolic syndrome; microbiome; synbiotic.


Conflict of interest statement

This study was funded by a grant from Tate and Lyle Solutions USA LLC and by a grant from Science Foundation Ireland to the Alimentary Pharmabiotic Centre at University College Cork, grant number 12/RC/2273-P2. Drs Herisson, Karnik, Laurie, Canene-Adams, Ross, Stanton, Caplice are named inventors on intellectual property co-owned by University College Cork and Tate and Lyle Solutions, LLC relating to synbiotic treatment of metabolic syndrome. All other authors have reported that they have no relationships relevant to the contents of this paper to disclose.

Figures

None
Graphical abstract
Figure 1
Figure 1
Intestinal Barrier Dysfunction, Mucosal Inflammation, Bacterial Translocation, and Systemic and Cardiac mVE Inflammation in MetS Study of the gut-heart axis in control and MetS pigs fed, respectively, normal chow or HFD along with DOCA to induce hypertension over 12 weeks. (A) Intestinal mucus layer thickness (red arrows) by Alcian blue staining of TI sections. (B to D) TI immunofluorescence labeling of (B) ZO-1 and (C) CD16 in crypts and villi (control: n = 7; MetS: n = 7) and (D) relative mRNA expression of inflammatory and NLRP3 signaling genes (control: n = 6; MetS: n = 6). (E) FISH labeling of translocating bacteria within TI crypts (designated by arrowheads) with scrambled probe as negative control (control: n = 7; MetS: n = 7). (F to H) Temporal serum levels of (F) ZO-1, (G) LPS, and (H) TNF-α (control: n = 5; MetS: n = 5). (I, J) LA and LV immunofluorescence labeling of (I) TLR4 and (J) TNFR1 in the LA and LV within CD31+ mVE area (designated by arrowheads) (control: n = 10; MetS: n = 9). All cropped or representative images were acquired at 600× magnification except for Alcian blue staining, which was imaged at 200×. Data are presented as median (Q1-Q3) and were compared using the Mann-Whitney test. ∗P < 0.05, ∗∗P < 0.01, and ∗∗∗P < 0.001. DAPI = 4′,6-diamidino-2-phenylindole; DOCA = deoxycorticosterone acetate; FISH = fluorescence in situ hybridization; HFD = high-fat diet; IL = interleukin; LA = left atrium; LV = left ventricle; MetS = metabolic syndrome; mRNA = messenger RNA; mVE = microvascular endothelium; Neg. = negative; NFKB = nuclear factor κB TI = terminal ileum; TLR4 = Toll-like receptor 4; TNF = tumor necrosis factor; TNFR1 = tumor necrosis factor receptor 1; TUNEL = terminal deoxynucleotidyl transferase dUTP nick end labeling; wk = weeks.
Figure 2
Figure 2
LA Inflammation, NLRP3 Activation, CM Apoptosis, and Cytokine Receptor Signaling in MetS (A) Relative mRNA expression of immune cell marker genes in the LA (control: n = 8 vs MetS: n = 8). (B to D) Immunofluorescence labeling of (B) CD16 and (C) CD163 as a percentage of total LA cells in control vs MetS and (D) Ki67 and IGFR labeling of CD16+ Mφs (control: n =10; MetS: n = 9). (E) LA NLRP3 immunofluorescence labeling among CD16+ Mφs, (F) SA+ CMs (designated by arrowheads) (control: n = 10; MetS: n = 9), and (G) relative mRNA expression of NLRP3-associated genes (control: n = 8; MetS: n = 8). (H) TUNEL positivity in total LA cells in both groups (control: n = 10; MetS: n = 9) and (I) within CD16+ and SA+ cell populations (designated by arrowheads) in the MetS group (n = 7), and (J) relative expression of proapoptotic gene mRNA (control: n = 8; MetS: n = 8). (K to N) LA TNFR1 immunofluorescence positivity among (K) SA+ CMs and (L) CD163+ Mφs designated by arrowheads as well as (M) TNFR2 positivity among SA+ CMs (control: n = 10; MetS: n = 9) and (N) relative mRNA expression of TNFR1-associated genes (control: n = 8; MetS: n = 8). LA TLR4 immunofluorescence positivity among (O) SA+ CMs and (P) CD163+ Mφs (control: n = 10; MetS: n = 9) as well as (Q) relative mRNA expression of TLR4-associated genes (control: n = 8; MetS: n = 8). All representative images were cropped from 600× magnification. Data are presented as median (Q1-Q3) and were compared using the Mann-Whitney test. ∗P < 0.05, ∗∗P < 0.01, and ∗∗∗P < 0.001. CM = cardiomyocyte; IGFR = insulin-like growth factor type 1 receptor; Mφ = macrophage; NLRP3 = nucleotide binding oligomerization leucine-rich repeat and pyrin domain 3; SA = sarcomeric actinin; other abbreviations as in Figure 1.
Figure 3
Figure 3
Synbiotic Targeting of the Gut-Heart Axis Reduced Cardiac Structural Changes, Intestinal Barrier Dysfunction, Mucosal Mφ Abundance, and Systemic Inflammation in MetS (A) LM growth curve in the presence or absence of fiber in media. (B) Gut-heart axis targeting of MetS using a synbiotic combination of LM and fiber (SLM) or individual LM or fiber. (C, D) Echocardiographic measurements of the (C) LAA and (D) LV wall thickness. (E) SBP and DBP at study termination. (F) TI mucus layer thickness measurements (red arrows) from Alcian blue staining images. Representative images were cropped from 200× magnification. (G) TI crypt immunofluorescence positivity of CD16. (H) Serum levels of TNF-α at the study end. (I) LM abundance measured by quantitative reverse-transcription polymerase chain reaction in cecal samples at study termination. MetS group (red): n = 6; SLM group (blue): n = 6; LM group (pale gray): n = 6; Fib group (speckled): n = 6. Data are presented as median (Q1-Q3) and were compared using the Kruskal-Wallis test. ∗P < 0.05 and ∗∗∗P < 0.001. DBP = diastolic blood pressure; Fib = fiber; LAA = left atrial area; LM = Lactobacillus mucosae; OD = optical density; SBP = systolic blood pressure; SLM = synbiotic Lactobacillus mucosae; other abbreviations as in Figures 1 and 2.
Figure 4
Figure 4
Synbiotic Targeting of the Gut-Heart Axis Reduced Bacterial Translocation, Improved Tight Junction Protein Expression, and Reduced Systemic and Cardiac mVE Inflammation in MetS (A) TI FISH labeling of translocating bacteria within crypts and (B) ZO-1 labeling in crypts and villi (MetS: n = 6; SLM: n = 6). (C to F) Time course serum levels of (C) LPS, (D) ZO-1, and (E) TNF-α (at 0, 2, 6, and 12 weeks) and (F) week 12 levels of hs-CRP, IFN-γ, IL-10, PAI-1, and IL-1β (MetS: n = 6; SLM: n = 6). (G, H) LA and LV immunofluorescence labeling of (G) TLR4 and (H) TNFR1 in LA and LV within CD31+ mVE (designated by arrowheads) (MetS: n = 8; SLM: n = 9). Representative images were cropped from 600× magnification. Data are presented as median (Q1-Q3) and were compared using the Mann-Whitney test. ∗P < 0.05, ∗∗P < 0.01, and ∗∗∗P < 0.001. hs-CRP = high-sensitivity C-reactive protein; IFN-γ = interferon gamma; IL = interleukin; LPS = lipopolysaccharide; other abbreviations as in Figure 1, Figure 2, Figure 3.
Figure 5
Figure 5
Synbiotic Targeting of the Gut-Heart Axis Reduced LA Inflammatory Cell Activity, NLRP3 Signaling, and CM Apoptosis and Decreased TNFR1 and TLR4 Activation in MetS (A to E) Immunofluorescence labeling of (A) CD16, (B) CD163, (C) CD11B, and (D) CD3 as a percentage of total LA cells and (E) Ki67 labeling of CD16+ Mφs (MetS: n = 8; SLM: n = 9). (F to H) LA NLRP3 immunofluorescence labeling among (F) CD16+ Mφs and (G) SA+ CMs (designated by arrowheads) (MetS: n = 8; SLM: n = 9) and (H) relative mRNA expression of NLRP3-associated genes (MetS: n = 8; SLM: n = 8). (I) LA TUNEL positivity in total LA cells (MetS: n = 8; SLM: n = 9), (J) relative mRNA expression of proapoptotic gene BAX (MetS: n = 8; SLM: n = 8), and (K) TUNEL positivity within SA+ (designated by arrowheads) (MetS: n = 6; SLM: n = 6) and CD16+ cell populations (designated by arrow heads) (MetS: n = 6; SLM: n = 6). (L-O) LA TNFR1 immunofluorescence positivity among (L) SA+ CMs and (M) CD163+ Mφs (designated by arrowheads), (N) TNFR2 positivity among SA+ CMs (MetS: n = 8; SLM: n = 9), and (O) relative mRNA expression of TNFR1-associated genes (MetS: n = 8; SLM: n = 8). (P-R) LA TLR4 immunofluorescence positivity among (P) SA+ CMs and (Q) CD163+ Mφs (designated by arrowheads) (MetS: n = 8; SLM: n = 9) and (R) relative mRNA expression of TLR4-associated gene IRF3 (MetS: n = 8; SLM: n = 8). All representative images were cropped from 600× magnification. Data are presented as median (Q1-Q3) and were compared using the Mann-Whitney test. ∗P < 0.05, ∗∗P < 0.01, and ∗∗∗P < 0.001. Abbreviations as in Figure 1, Figure 2, Figure 3.

Comment in

Similar articles

Cited by

References

    1. Lusis A.J., Attie A.D., Reue K. Metabolic syndrome: from epidemiology to systems biology. Nat Rev Genet. 2008 Nov;9(11):819–830. - PMC - PubMed
    1. Borlaug B.A., Sharma K., Shah S.J., Ho J.E. Heart failure with preserved ejection fraction: JACC scientific statement. J Am Coll Cardiol. 2023;81:1810–1834. - PubMed
    1. Usman M.S., Siddiqi T.J., Anker S.D., et al. Effect of SGLT2 inhibitors on cardiovascular outcomes across various patient populations. J Am Coll Cardiol. 2023;81(25):2377–2387. - PubMed
    1. Murphy S.P., Kakkar R., McCarthy C.P., Januzzi J.L. Inflammation in heart failure: JACC state-of-the-art review. J Am Coll Cardiol. 2020;75(11):1324–1340. - PubMed
    1. Di Vincenzo F., Del Gaudio A., Petito V., Lopetuso L.R., Scaldaferri F. Gut microbiota, intestinal permeability, and systemic inflammation: a narrative review. Intern Emerg Med. 2024;19(2):275–293. - PMC - PubMed

LinkOut - more resources