

Golgi scaffold protein PAQR11 in pan-cancer landscape: A comprehensive bioinformatics exploration of expression patterns, prognostic significance, and potential immunological function
- PMID: 39906812
- PMCID: PMC11791267
- DOI: 10.1016/j.heliyon.2025.e41724
Golgi scaffold protein PAQR11 in pan-cancer landscape: A comprehensive bioinformatics exploration of expression patterns, prognostic significance, and potential immunological function
Abstract
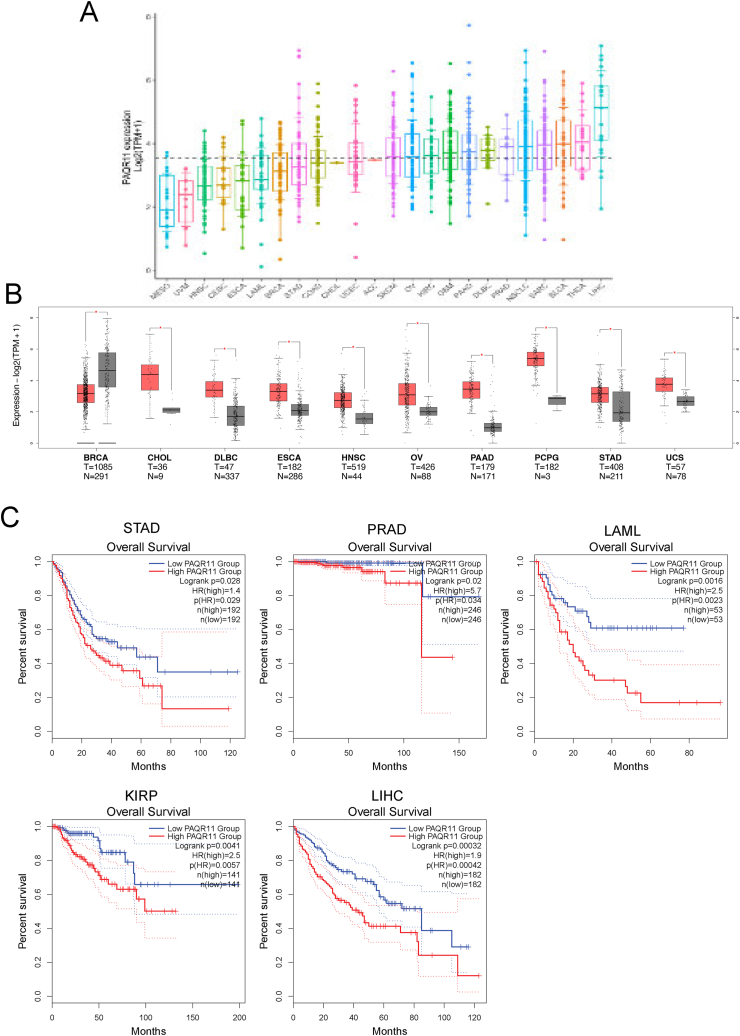
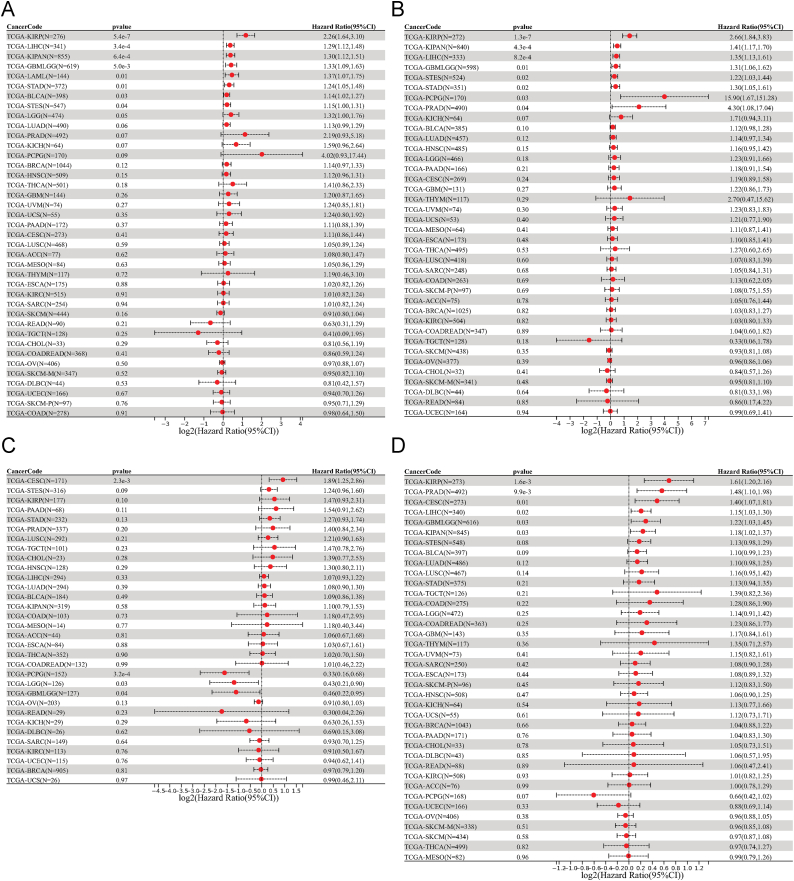
Background: The progestin and adipoQ receptor family member, PAQR11, is recognized for its roles in vesicle trafficking, mitogenic signaling, and metastatic spread, positioning it as a crucial regulator in cancer biology. PAQR11 influences lipid metabolism and susceptibility to ferroptosis in cancer cells. This study aims to investigate the prognostic significance of PAQR11, its relevance to immune responses, and its association with drug sensitivity across various cancer types. By elucidating these aspects, the research seeks to assess PAQR11's potential as a biomarker and therapeutic target in oncology.
Methods: We conducted a comprehensive bioinformatics analysis using publicly available pan-cancer datasets from TCGA, GEO, UALCAN, TIMER, GEPIA2, KM plotter, and TISIDB. This analysis encompassed gene expression profiles across 33 cancer types, with a focus on PAQR11's expression patterns, prognostic significance, and immunological relevance. In addition, the study explored the correlation between PAQR11 expression and drug sensitivity, alongside its molecular and pathological characteristics in various tumors.
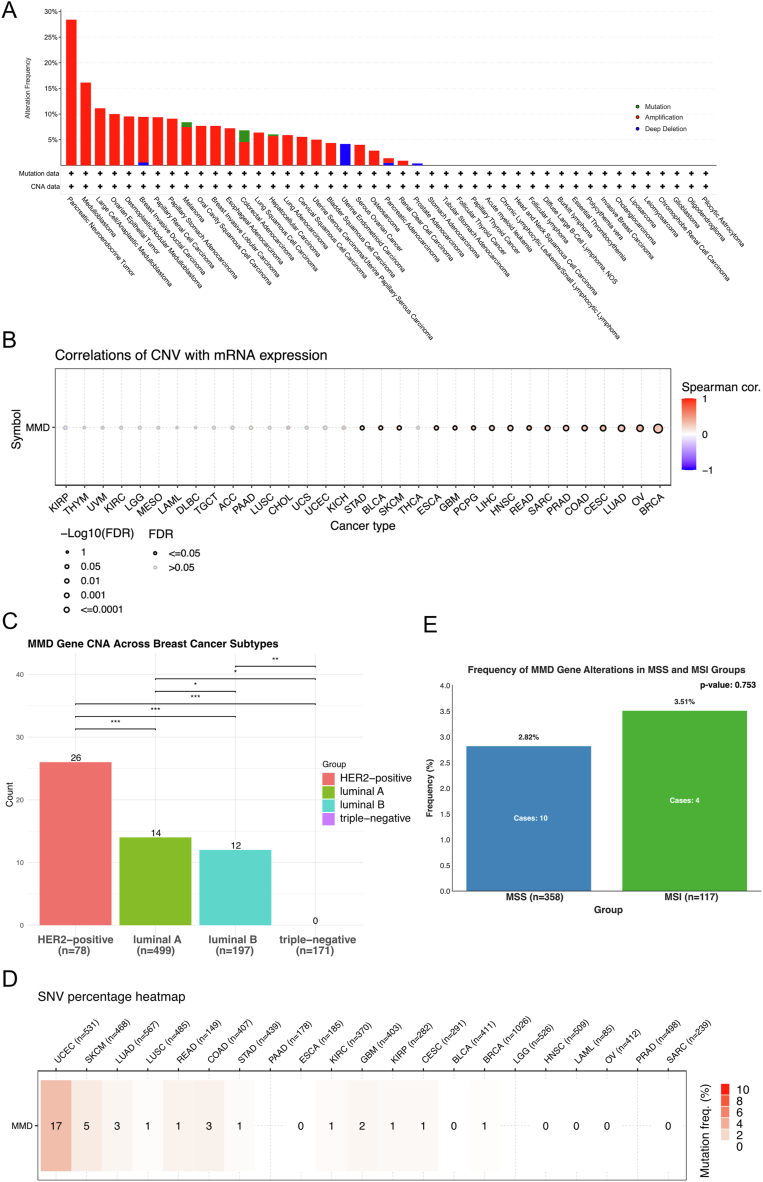
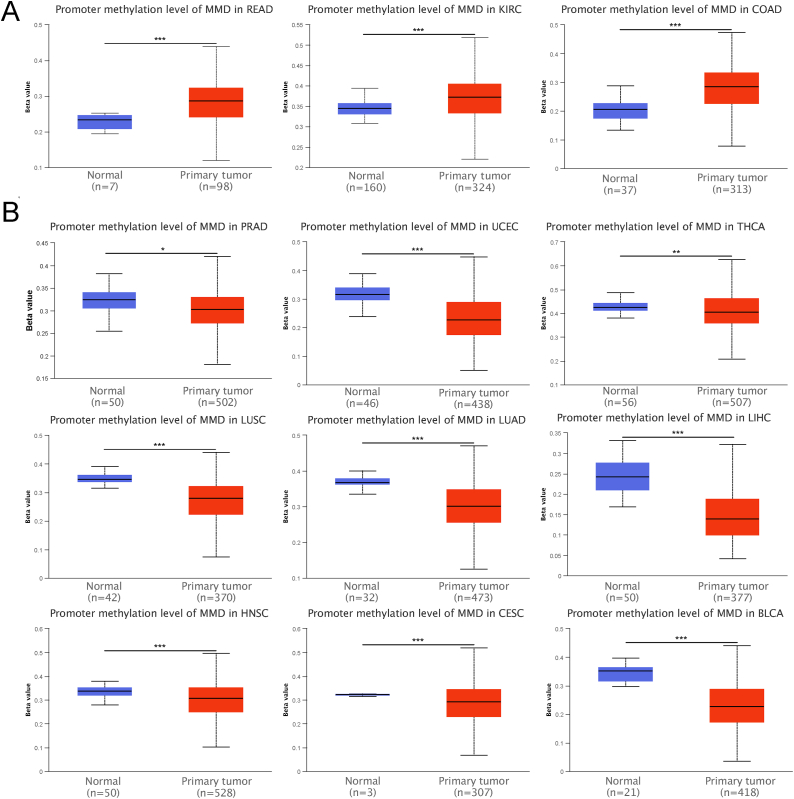
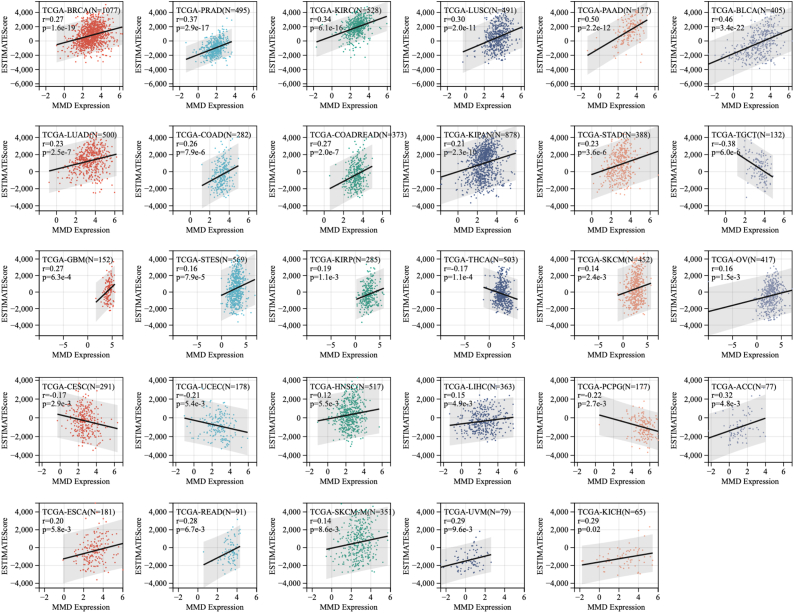
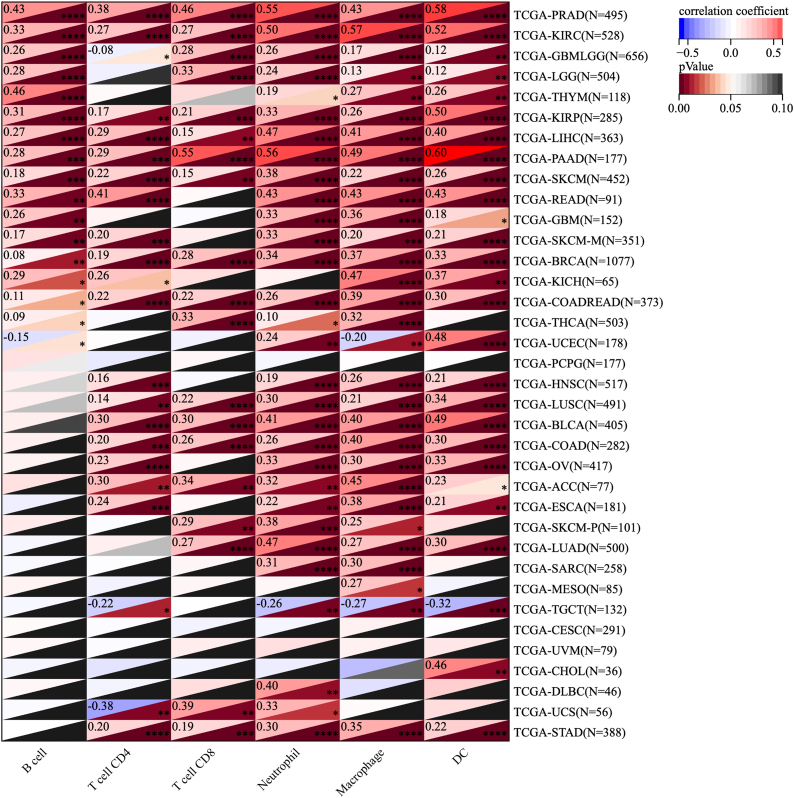
Results: Our findings demonstrate elevated PAQR11 expression levels across multiple cancer types, which significantly correlate with patient prognostic outcomes. The analysis further revealed PAQR11's involvement in immunological and epigenetic processes, underscoring its critical role in cancer progression and treatment response. Notably, a strong correlation between PAQR11 expression and drug sensitivity was identified, suggesting its potential influence on the initiation and progression of various cancers and highlighting its promise as a therapeutic target.
Conclusions: The comprehensive analysis of PAQR11 underscores its significance as a biomarker for cancer prognosis and its role in regulating immunological and epigenetic processes. These findings offer valuable insights that could inform early detection strategies and the development of novel therapeutic approaches. Further exploration and validation of PAQR11 are essential, highlighting the need for its integration into future oncological research and treatment strategy development.
Trial registration: Not applicable.
Keywords: Monocyte to macrophage differentiation-associated (MMD); Pan-cancer analysis; Potential immunological function; Progestin and adipoQ receptor family member 11 (PAQR11); TCGA.
© 2025 The Authors.
Conflict of interest statement
The authors declare the following financial interests/personal relationships which may be considered as potential competing interests:Zhi-Qiang Ling reports financial support, administrative support, article publishing charges, statistical analysis, and writing assistance were provided by National Natural Science Foundation of China (32271238, 81972908). Zhi-Qiang Ling reports financial support, administrative support, article publishing charges, statistical analysis, and writing assistance were provided by National Health Commission Science Research Fund-Zhejiang Provincial Health Key Science and Technology Plan Project (WKJ-ZJ-2117). Zhi-Qiang Ling reports financial support, administrative support, article publishing charges, statistical analysis, and writing assistance were provided by Zhejiang Province Health Leader Talent (Zjwjw2021-40). Zhi-Qiang Ling reports financial support, administrative support, article publishing charges, statistical analysis, and writing assistance were provided by Zhejiang Provincial Public Welfare Technology Research Plan Project (LGD20H160003, LY20H160005 and LGF21H160010). If there are other authors, they declare that they have no known competing financial interests or personal relationships that could have appeared to influence the work reported in this paper.
Figures
Similar articles
-
Multiomic characterization, immunological and prognostic potential of SMAD3 in pan-cancer and validation in LIHC.Sci Rep. 2025 Jan 3;15(1):657. doi: 10.1038/s41598-024-84553-3. Sci Rep. 2025. PMID: 39753728 Free PMC article.
-
PAQR11 modulates monocyte-to-macrophage differentiation and pathogenesis of rheumatoid arthritis.Immunology. 2021 May;163(1):60-73. doi: 10.1111/imm.13303. Epub 2021 Jan 24. Immunology. 2021. PMID: 33421113 Free PMC article.
-
A Comprehensive Pan-Cancer Analysis Reveals Cyclin-Dependent Kinase Inhibitor 2A Gene as a Potential Diagnostic and Prognostic Biomarker in Colon Adenocarcinoma.Cureus. 2024 May 19;16(5):e60586. doi: 10.7759/cureus.60586. eCollection 2024 May. Cureus. 2024. PMID: 38894777 Free PMC article.
-
Pan-cancer analysis and validation show GTF2E2's diagnostic, prognostic, and immunological roles in regulating ferroptosis in endometrial cancer.PLoS One. 2025 Apr 23;20(4):e0321983. doi: 10.1371/journal.pone.0321983. eCollection 2025. PLoS One. 2025. PMID: 40267151 Free PMC article.
-
Transcription factor ELF4 in physiology and diseases: Molecular roles and clinical implications.Genes Dis. 2024 Aug 23;12(3):101394. doi: 10.1016/j.gendis.2024.101394. eCollection 2025 May. Genes Dis. 2024. PMID: 40083328 Free PMC article. Review.
References
-
- Siegel R.L., Miller K.D., Fuchs H.E., Jemal A. Cancer statistics, 2021. CA Cancer J Clin. 2021;71:7–33. - PubMed
-
- Sung H., Ferlay J., Siegel R.L., Laversanne M., Soerjomataram I., Jemal A., et al. Global cancer statistics 2020: GLOBOCAN estimates of incidence and mortality worldwide for 36 cancers in 185 countries. CA Cancer J Clin. 2021;71:209–249. - PubMed
-
- Crosby D., Bhatia S., Brindle K.M., Coussens L.M., Dive C., Emberton M., et al. Early detection of cancer. Science. 2022;375 - PubMed
Publication types
LinkOut - more resources
Full Text Sources
Miscellaneous
