. 2025 Jan 24;53(3):gkaf045.
doi: 10.1093/nar/gkaf045.

zol and fai: large-scale targeted detection and evolutionary investigation of gene clusters

Affiliations

zol and fai: large-scale targeted detection and evolutionary investigation of gene clusters

Rauf Salamzade et al. Nucleic Acids Res. .

Abstract

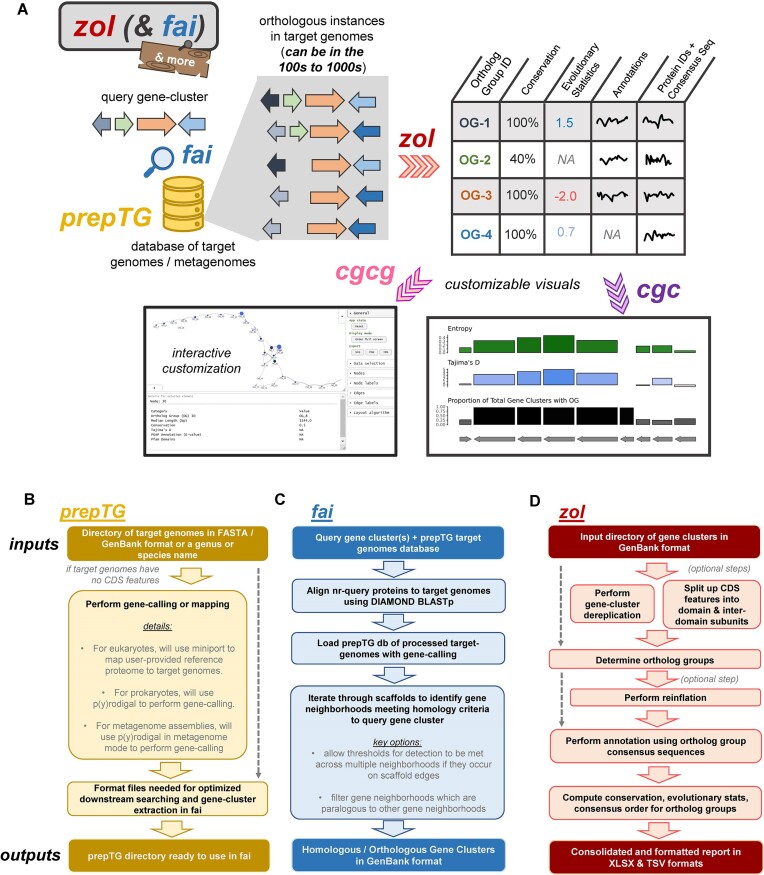
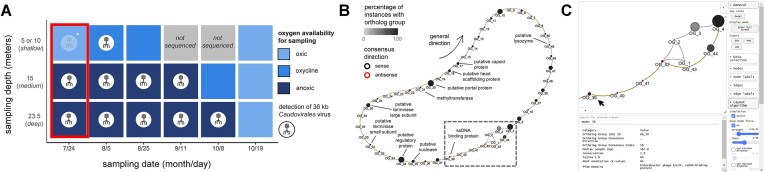
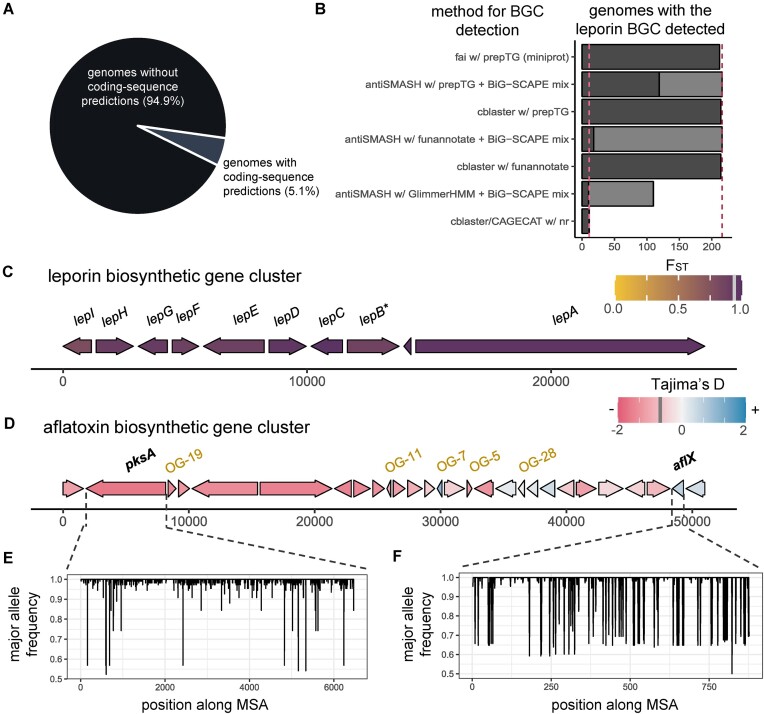
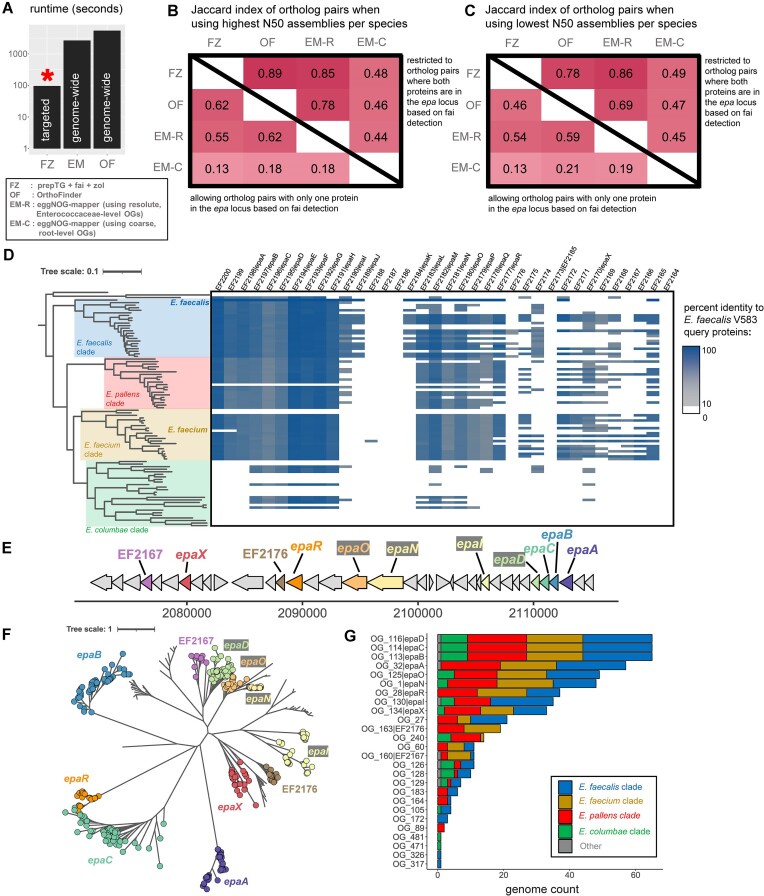
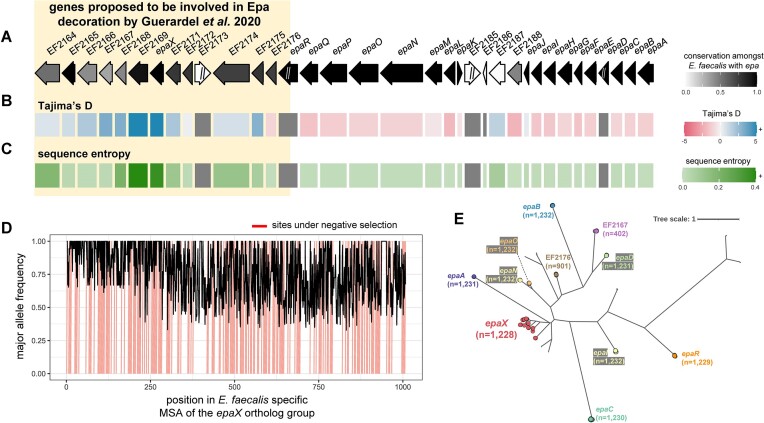
Many universally and conditionally important genes are genomically aggregated within clusters. Here, we introduce fai and zol, which together enable large-scale comparative analysis of different types of gene clusters and mobile-genetic elements, such as biosynthetic gene clusters (BGCs) or viruses. Fundamentally, they overcome a current bottleneck to reliably perform comprehensive orthology inference at large scale across broad taxonomic contexts and thousands of genomes. First, fai allows the identification of orthologous instances of a query gene cluster of interest amongst a database of target genomes. Subsequently, zol enables reliable, context-specific inference of ortholog groups for individual protein-encoding genes across gene cluster instances. In addition, zol performs functional annotation and computes a variety of evolutionary statistics for each inferred ortholog group. Importantly, in comparison to tools for visual exploration of homologous relationships between gene clusters, zol can scale to handle thousands of gene cluster instances and produce detailed reports that are easy to digest. To showcase fai and zol, we apply them for: (i) longitudinal tracking of a virus in metagenomes, (ii) performing population genetic investigations of BGCs for a fungal species, and (iii) uncovering evolutionary trends for a virulence-associated gene cluster across thousands of genomes from a diverse bacterial genus.


Conflict of interest statement

None declared.

Figures

Graphical Abstract
Graphical Abstract
Figure 1.
Figure 1.
Overview of the zol suite. (A) A cartoon schematic of how prepTG, fai, and zol, as well as visualization tools cgc and cgcg, are integrated. Certain statistics in the zol report will not be calculated if not enough instances of an ortholog group are identified, resulting in non-available (NA) values being reported. Squiggles correspond to arbitrary text pertaining to functional annotation information, etc. (B) An overview of steps in the core programs in the suite: prepTG, (C) fai, and (D) zol algorithms and workflows. Inputs and outputs for the programs are indicated with bolder coloring.
Figure 2.
Figure 2.
Targeted viral detection in metagenomes using fai. (A) Total metagenomes from a single site in Lake Mendota across multiple depths and timepoints from Tran et al. (2023) were investigated using fai for the presence of a virus found in two of the three earliest microbiome samplings (red box; samples from 7/24). The presence of the virus is indicated by a virus icon. * denotes a metagenome sample where the virus was partially detected based on more sensitive searching criteria using fai. Metagenome samples are colored according to whether they corresponded to oxic, oxycline, or anoxic. The most shallow sampling depths varied for different dates and consolidated as a single row corresponding to a sampling depth of either 5 or 10 meters. (B) A depiction of the pangenome of the virus created using cgcg is shown. Nodes correspond to ortholog groups with sizes indicating the median size in bp divided by 100. Only ortholog groups found in ≥25% of virus instances are shown. Coloring, which can be configured, for this figure corresponds to conservation of ortholog groups across instances of the virus. Edges and arrows show the consensus order of ortholog groups, with border colors of nodes indicating the consensus direction of the ortholog groups. Edges which are gold coincide with the major path most commonly observed across the 10 instances of the virus. Functional annotations were manually added to the figure. (C) A zoom-in of a region in the pangenome graph showing the interactive capabilities of cgcg, implemented via the gravis library, to allow users to explore zol results in a network visual.
Figure 3.
Figure 3.
Evolutionary trends of common BGCs in A. flavus. (A) The proportion of 216 A. flavus genomes from NCBI’s GenBank database with coding-sequence predictions available. (B) Comparison of the sensitivity of prepTG and fai with alternate assembly-based approaches for detecting the leporin BGC. The dashed vertical lines indicate the number of genomes with CDS features available on NCBI (n= 11; pink) and the total number of genomes assessed (n = 216; violet), respectively. Dark gray indicates instances identified by CAGECAT/cblaster or fai or as belonging to the same GCF as the reference leporin BGC from MIBiG by antiSMASH and BiG-SCAPE analysis. Lighter gray indicates the number of similar BGCs identified by BiG-SCAPE as belonging to the same clan but not to the same GCF as the reference leporin BGC. A schematic of the (C) leporin and (D) aflatoxin BGCs is shown with genes present in ≥10% of samples shown in consensus order and relative directionality. Coloring of genes in (C) corresponds to FST values and in (D) to Tajima's D values, as calculated by zol. Vertical bars in the legends, at (C) 0.92 and (D) −1.06, indicate the mean values for the statistics across genes in the BGC. *For the leporin BGC, lepB corresponds to an updated open-reading frame (ORF) prediction by Skerker et al. 2021 which was the combination of AFLA_066 860 and AFLA_066 870 ORFs in the MIBiG entry BGC0001445 used as the query for fai. For the aflatoxin BGC, ORFs which were not represented in the MIBiG entry BGC0000008 but predicted to be within the aflatoxin BGC by mapping of gene-calls from A. flavus NRRL 3357 by Skerker et al. 2021 are noted in gold text. The major allele frequency distributions are shown for (E) pksA and (F) aflX, which depict opposite trends in sequence conservation according to their respective Tajima's D calculations.
Figure 4.
Figure 4.
Searching for the epa locus across the diverse genus of Enterococcus. (A) Overview of the time needed to run orthology/homology inference methods on the 92 genomes with the highest N50 for each distinct Enterococcus species. OrthoFinder and eggNOG-mapper were run at the genome-wide scale, while fai, was used to first identify genomic regions corresponding to the epa locus from E. faecalis V583 and zol was subsequently applied to determine ortholog groups. The asterisk denotes that manual assessment or filtering of homologous gene clusters identified by fai is encouraged and thus additional time if often required for them. The Jaccard index between ortholog pair sets identified by fai & zol, OrthoFinder, and eggNOG-mapper are shown following their application to representative genomes from GTDB R214 with the (B) highest N50 and (C) lowest N50 for the 92 different species. The upper-right triangles show values between methods when strictly considering ortholog pairs which are possible for zol to infer from targeted detection of epa by fai. The lower-left triangles show values between methods when considering ortholog pairs with only one protein needing to be found in an epa region identified by fai – thus allowing for ortholog pairs between epa proteins and other proteins across genomes by OrthoFinder and eggNOG-mapper. (D) The distribution of the epa locus, based on criteria used for running fai, is shown across a species phylogeny for 92 genomes representative of distinct Enterococcus species in GTDB R214. The coloring of the heatmap corresponds to the percent identity of the best matching protein from each genome to the query epa proteins from E. faecalis V583. Note, the representative genome for E. faecalis (GCA_902166685.1) is not V583 and certain strain-variable genes are not found for it. (E) A schematic of the epa gene cluster from E. faecalis V583 (from EF2164 to EF2200) with glycosyltransferase encoding genes shown in color. (F) A maximum-likelihood phylogeny of zol-identified ortholog groups corresponding to glycosyltransferases in epa loci across Enterococcus. (G) Distribution of different glycosyltransferase ortholog groups across the four major clades of Enterococcus are shown. For D and F, the tree scales correspond to the number of amino acid substitutions per site along the alignments used for phylogeny construction.
Figure 5.
Figure 5.
High sequence diversity of epaX-like glycosyltransferases amongst E. faecalis. A schematic of the epa locus from E. faecalis V583 with evolutionary statistics, (A) conservation, (B) Tajima's D and (C) sequence entropy, gathered from the best corresponding ortholog group for each protein. Ortholog groups were inferred from zol investigation of 1, 232 epa loci from the species. Genes upstream of and including epaR were recently proposed to be involved in Epa decoration by Guerardel et al. 2020. ‘//’ indicates that the ortholog group was not single-copy in the context of the gene-cluster and calculation of evolutionary statistics for these genes was avoided (gray in panels B and C). Note, the same ortholog group was regarded for EF2173 and EF2185 which correspond to an identical ISEf1 transposase. The length of proteins in the locus schematic are the median lengths of the corresponding ortholog groups. (D) The major allele frequency is depicted across the alignment for the ortholog group featuring epaX. Sites predicted to be under negative selection by FUBAR, Prob (formula image) ≥ 0.9, are marked in red. E) An approximate maximum-likelihood phylogeny of glycosyltransferase ortholog groups identified by zol which were found in > 1% of epa instances. Ortholog groups identified by zol are indicated by colored circular nodes with names of epa genes from E. faecalis V583 noted where possible. The number of leaves/proteins for each clade is provided for labeled ortholog groups. The tree scale corresponds to the number of amino acid substitutions per site along the input protein alignment used for phylogeny construction.

Update of

Similar articles

Cited by

References

    1. Fitch WM Distinguishing homologous from analogous proteins. Syst Zool. 1970; 19:99–113.10.2307/2412448. - DOI - PubMed
    1. Tatusov RL, Galperin MY, Natale DA et al. . The COG database: a tool for genome-scale analysis of protein functions and evolution. Nucleic Acids Res. 2000; 28:33–6.10.1093/nar/28.1.33. - DOI - PMC - PubMed
    1. Huerta-Cepas J, Szklarczyk D, Heller D et al. . eggNOG 5.0: a hierarchical, functionally and phylogenetically annotated orthology resource based on 5090 organisms and 2502 viruses. Nucleic Acids Res. 2019; 47:D309–14.10.1093/nar/gky1085. - DOI - PMC - PubMed
    1. Enright AJ, Kunin V, Ouzounis CA Protein families and TRIBES in genome sequence space. Nucleic Acids Res. 2003; 31:4632–8.10.1093/nar/gkg495. - DOI - PMC - PubMed
    1. Li L, Stoeckert CJ Jr, Roos DS OrthoMCL: identification of ortholog groups for eukaryotic genomes. Genome Res. 2003; 13:2178–89.10.1101/gr.1224503. - DOI - PMC - PubMed

LinkOut - more resources