. 2025 Mar 18;99(3):e0211324.
doi: 10.1128/jvi.02113-24. Epub 2025 Feb 5.

The Japanese encephalitis virus NS1 protein concentrates ER membranes in a cytoskeleton-independent manner to facilitate viral replication

Affiliations

The Japanese encephalitis virus NS1 protein concentrates ER membranes in a cytoskeleton-independent manner to facilitate viral replication

Shengda Xie et al. J Virol. .

Abstract

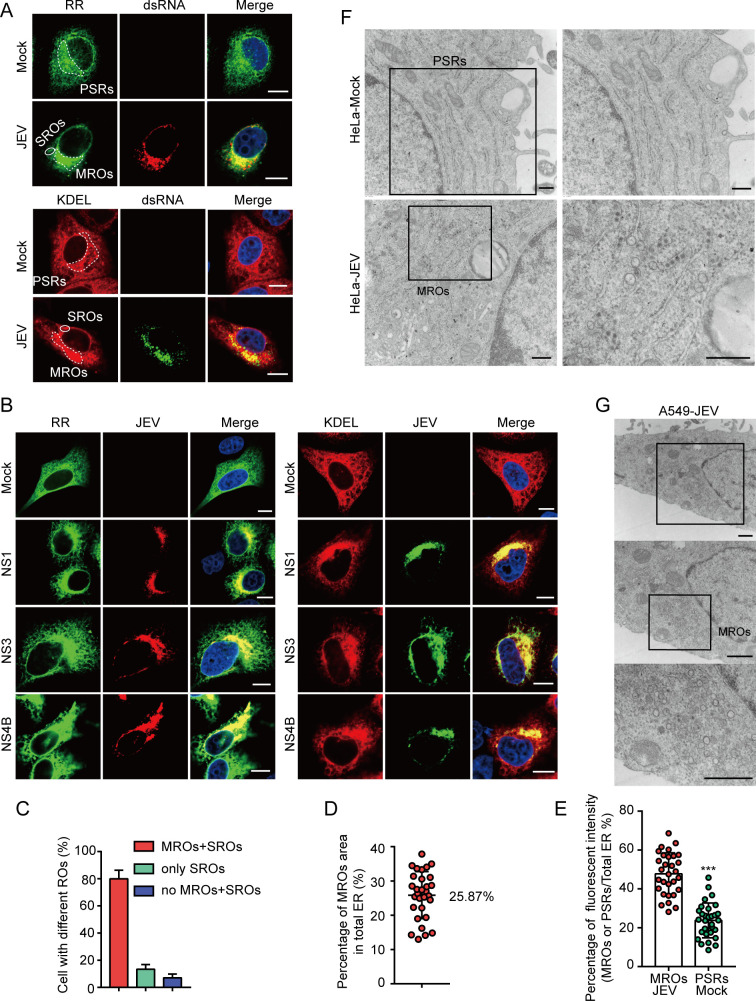
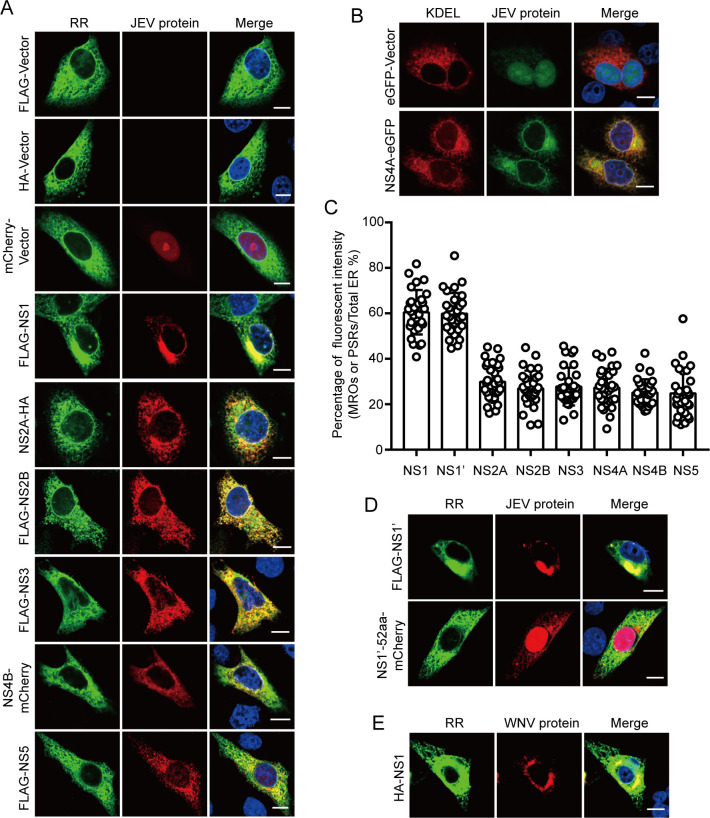
Orthoflaviviruses remodel the endoplasmic reticulum (ER) network to construct replication organelles (ROs) for RNA replication. In this study, we demonstrate that the Japanese encephalitis virus (JEV) NS1 protein concentrates ER membranes in the perinuclear region, which provides a substantial membrane source for viral replication. Subsequently, the virus forms main replication organelles within this membrane-concentrated area to facilitate efficient replication. This process relies on the ER localization signal, glycosylation, dimerization, and membrane-binding sites of the NS1 protein. In conclusion, our study highlights the role of the NS1 protein in the formation of the ROs by JEV, providing new insights into orthoflavivirus replication.IMPORTANCEOrthoflaviviruses use the endoplasmic reticulum (ER) membranes for replication by forming invaginations to assemble the replication organelles. Here, we found that Japanese encephalitis virus (JEV) utilizes the NS1 protein to concentrate a significant number of ER membranes in the perinuclear area, thereby providing a membrane source for viral replication and facilitating the formation of main replication organelles (MROs). This process depends on the ER localization signals of NS1, as well as its glycosylation, dimerization, and membrane-binding sites, but not on the cytoskeleton. In summary, our study highlights how NS1 remodels ER membranes to facilitate the formation of MROs for JEV, thereby accelerating viral replication.

Keywords: ER membranes; Japanese encephalitis virus; NS1; concentration; main replication organelles; viral replication.


Conflict of interest statement

The authors declare no conflict of interest.

Figures

Fig 1
Fig 1
Concentrated ER membranes in JEV-infected cells. (A and B) HeLa cells were transfected with the RR or KDEL plasmids and then infected with the JEV NJ2008 strain at a multiplicity of infection (MOI) of 0.5, 36 hpi. Viral dsRNA (A), NS1 (B), NS3 (B), and NS4B (B) were stained with respective antibodies. Scale bars, 10 µm. Dotted circles in JEV-infected cells represent MROs (A). Solid circles in JEV-infected cells represent SROs (A). Dotted circles in mock cells represent PSRs (A). (C) The percentage of JEV-infected wild-type (WT) HeLa cells with three different types of ER clusters. Average of three counts, each with more than 40 cells. (D) Area percentage of MROs to the total ER. Each point represents a single cell from two independent experiments. (E) The percentage of ER fluorescence intensity in MROs or PSRs. Each point represents a single cell from two independent experiments, two-tailed t-test, ***P < 0.001. (F) TEM images of mock and JEV-infected (MOI = 0.5, 36 hpi) HeLa cells. Scale bars, 400 nm. (G) TEM images of JEV-infected A549 cells at 36 hpi (MOI = 0.5). Scale bars, 600 nm.
Fig 2
Fig 2
JEV concentrates ER membranes in different cell types. (A) Different cells types were infected with the JEV NJ2008 strain at an MOI of 0.5 (Vero, PK-15, and BHK-21 cells for 24 hpi; A549, Neuro-2a, and DF-1 cells for 36 hpi; C6/36 cells for 48 hpi). JEV infection in the ER was observed using the confocal microscope. The ER was stained with dye. Scale bars, 20 µm. (B) HeLa cells were infected with JEV HEN0701 and SA14-14-2 strains at an MOI of 0.5 for 36 hpi. The concentration of ER membranes was observed using the confocal microscope. Scale bars, 10 µm. (C) BHK-21 cells were infected with the TMUV XZ2012 strain at an MOI of 1 for 24 hpi. The concentration of ER membranes was observed using the confocal microscope. The ER was stained with dye. Scale bars, 10 µm.
Fig 3
Fig 3
JEV NS1 and NS1’ proteins mediate membrane concentration. (A and B) HeLa cells were co-transfected with plasmids encoding either RR or KDEL, along with individual JEV non-structural proteins. The concentration of ER membranes was observed using the confocal microscope. The FLAG-tagged plasmids expressing JEV NS1, NS2B, NS3, and NS5 proteins. The mCherry-tagged plasmid expressing JEV NS4B protein. The HA-tagged plasmids expressing JEV NS2A (A). The eGFP-tagged plasmid expressing JEV NS4A protein (B). Scale bars, 10 µm. (C) Quantification of ER membrane concentration shown in A and B. Each point represents a single cell from two independent experiments. The statistics for WT NS1 are the same set as used in Fig. 4C. (D and E) HeLa cells were co-transfected with the RR and the JEV NS1' plasmid (D top), the mCherry-tagged plasmid expressing 52 shifted amino acids (D bottom), or the WNV NS1 plasmid (E). The concentration of ER membranes was observed using the confocal microscope. Scale bars, 10 µm.
Fig 4
Fig 4
The key sites of NS1 protein in ER membrane concentration. (A) The structure of the JEV NS1. The structural model of NS1 dimer (left). The β-roll domain (amino acid residues 1–29) is colored in green, a wing domain (amino acids 38–151) is colored in blue, and β-ladder domains (amino acids 181–352) are colored in brown. Hydrophobic residues (namely, residues 28, 115, 118, 123, and 160–163) suspected to be involved with cell membrane interaction are labeled. This structural model was provided by Prof. Svetlana V. Antonyuk and adapted from reference . The primary structure of orthoflavivirus NS1 protein (right). The β-roll, wing, β-ladder domains, and two connector subdomains are marked in different colors. The glycosylation sites are shown with red dots. (B) HeLa cells were co-transfected with RR and mutant NS1 plasmids for 36 h. Immunofluorescence staining was performed to detect the ER membranes and viral NS1 protein. Scale bars, 10 µm. (C) Quantification of ER membrane concentration shown in B. Each point represents a single cell from two independent experiments. The statistics for WT NS1 are the same set as used in Fig. 3C.
Fig 5
Fig 5
MROs are absent in Vimentin-deficient cells. (A) WT and Vim-KO HeLa cells were infected with the JEV NJ2008 strain, MOI = 0.5, 36 hpi. Immunofluorescence assays were performed to detect the JEV NS1 protein. Scale bars, 20 µm. (B) WT and Vim-KO HeLa cells were transfected with the RR plasmid and then infected with the JEV NJ2008 strain, MOI = 0.5, 36 hpi. Immunofluorescence assays were performed to observe the ER and viral dsRNA. Scale bars, 10 µm. MROs, SROs, and PSRs were indicated with dotted circles. (C) The percentage of JEV-infected Vim-KO HeLa cells with three different types of ER clusters. Average of three counts, each with more than 39 cells. (D) WT and Vim-KO HeLa cells were transfected with the RR or KDEL plasmid and then infected JEV NJ2008 strain, MOI = 0.5, 36 hpi. Immunofluorescence assays were performed to observe the ER and viral NS1 protein. Scale bars, 10 µm. (E) The percentage of ER fluorescence intensity in SROs or PSRs. Each point represents a single cell from two independent experiments, two-tailed t-test, ***P < 0.001. (F) Vim-KO HeLa cells were co-transfected with the RR and JEV NS1 plasmids. Immunofluorescence assays were performed to observe the ER and viral NS1 protein. Scale bars, 10 µm. (G) Vim-KO HeLa cells were co-transfected with KDEL and either the JEV NS1-3 or NS1-4A polyprotein plasmids. The concentration of ER membranes was observed using the confocal microscope. Scale bars, 10 µm.
Fig 6
Fig 6
Vimentin regulates ER morphology. (A) The strategy for quantifying the ER membrane distribution (left). A demonstration of the distribution of the ER within a cell (right). PN, perinuclear; PP, cell periphery. (B) WT and Vim-KO HeLa cells were transfected with the RR and KDEL plasmids. Immunofluorescence assays were performed to observe the ER. Scale bars, 10 µm. (C) The ER of WT and Vim-KO HeLa cells stained with the dye was observed using confocal microscopy. Scale bars, 10 µm. (D) The quantification of the ER signal distribution in PN and PP regions. Each point represents a single cell from two independent experiments, two-tailed t-test, *** P < 0.001. (E) The immunofluorescence images of CLIMP63 and VAP-A in WT and Vim-KO HeLa cells. Scale bars, 10 µm. (F) The expression of CLIMP63 and VAP-A in WT and Vim-KO HeLa cells was detected by immunoblotting.
Fig 7
Fig 7
MROs enriched for host factors accelerate viral replication. (A) A549 and HeLa cells were infected with the JEV NJ2008 strain for 36 h at an MOI of 0.5. Viral dsRNA was stained with the corresponding antibody. The ER was stained with dye. The dotted circles represent MROs. Solid circles represent SROs. Scale bars, 10 µm. (B) HeLa-RR cells were infected with the JEV NJ2008 strain for 36 h at an MOI of 0.5. Viral NS3 and NS5 proteins were stained with the corresponding antibody. The dotted circles represent MROs. Solid circles represent SROs. Scale bars, 10 µm. (C) Analysis of dsRNA, NS3, and NS5 intensity per unit area in MROs and SROs, two-tailed t-test, ***P < 0.001. Each point represents a MRO or SRO from two independent experiments. (D) Immunofluorescence analysis of concentrated ER membranes induced by JEV infection in dimethyl sulfoxide (DMSO), TVB-2640 (1 µM), or MβCD (1 mM) treated HeLa-RR cells. MOI = 0.5, 36 hpi. Scale bars, 10 µm. (E) The percentage of JEV-infected cells with MROs following treatment with DMSO, TVB-2640 (1 µM), or MβCD (1 mM). Average of two counts, each with more than 39 cells. (F) The expression of NS1 in HeLa cells following treatment with TVB-2640 (1 µM) and MβCD (1 mM). (G) Immunofluorescence analysis of concentrated ER membranes induced by NS1 protein (plasmid transfection) in DMSO, TVB-2640 (1 µM), or MβCD (1 mM) treated HeLa-RR cells. Scale bars, 10 µm. (H) The percentage of ER fluorescence intensity in NS1-induced MROs after treatment of HeLa cells with DMSO, TVB-2640 (1 µM), or MβCD (1 mM). Each point represents a single cell from two independent experiments, two-tailed t-test, ns, not significant. (I) HeLa cells were infected with JEV NJ2008 strain, MOI = 0.5, 36 hpi. RRBP1 and viral NS1 protein were stained with respective antibodies. Scale bars, 10 µm. (J) The percentage of RRBP1 fluorescence intensity in MROs and PSRs. Each point represents a single cell from two independent experiments, two-tailed t-test, ***P < 0.001. (K) HeLa cells were co-transfected with the RR and either the NS1 or NS1' plasmids. RRBP1, NS1, and NS1' proteins were stained with respective antibodies. Scale bars, 10 µm. (L) The percentage of RRBP1 fluorescence intensity in MROs (NS1 or NS1' plasmids transfected cells) and PSRs (vector plasmid transfected cells). Each point represents a single cell from two independent experiments, two-tailed t-test, ***P < 0.001.
Fig 8
Fig 8
RRBP1 was concentrated in MROs and SROs. (A) The immunofluorescence images of RRBP1 in WT and Vim-KO HeLa cells (left). Scale bars, 10 µm. PN, perinuclear; PP, cell periphery. The quantification of RRBP1 signal distribution in PN and PP regions (right). Each point represents a single cell from two independent experiments, two-tailed t-test, ***P < 0.001. (B) WT and Vim-KO HeLa cells were infected with the JEV NJ2008 strain, MOI = 0.5, 36 hpi. Immunofluorescence assays were performed to observe RRBP1 and viral dsRNA. Scale bars, 10 µm. MROs, SROs, and PSRs were indicated with dotted circles. (C) The percentage of RRBP1 fluorescence intensity in SROs or PSRs. Each point represents a single cell from two independent experiments, two-tailed t-test, **P < 0.01. (D) WT and Vim-KO HeLa cells were infected with the JEV NJ2008 strain, MOI = 0.5, 36 hpi. Immunofluorescence assays were performed to observe RRBP1 and viral NS1 protein. Scale bars, 10 µm.

Similar articles

Cited by

References

    1. van den Hurk AF, Ritchie SA, Mackenzie JS. 2009. Ecology and geographical expansion of Japanese encephalitis virus. Annu Rev Entomol 54:17–35. doi:10.1146/annurev.ento.54.110807.090510 - DOI - PubMed
    1. Levesque ZA, Walsh MG, Webb CE, Zadoks RN, Brookes VJ. 2024. A scoping review of evidence of naturally occurring Japanese encephalitis infection in vertebrate animals other than humans, ardeid birds and pigs. PLoS Negl Trop Dis 18:e0012510. doi:10.1371/journal.pntd.0012510 - DOI - PMC - PubMed
    1. Quan TM, Thao TTN, Duy NM, Nhat TM, Clapham H. 2020. Estimates of the global burden of Japanese encephalitis and the impact of vaccination from 2000-2015. Elife 9:e51027. doi:10.7554/eLife.51027 - DOI - PMC - PubMed
    1. Campbell GL, Hills SL, Fischer M, Jacobson JA, Hoke CH, Hombach JM, Marfin AA, Solomon T, Tsai TF, Tsu VD, Ginsburg AS. 2011. Estimated global incidence of Japanese encephalitis: a systematic review. Bull World Health Organ 89:766–774, doi:10.2471/BLT.10.085233 - DOI - PMC - PubMed
    1. Pearce JC, Learoyd TP, Langendorf BJ, Logan JG. 2018. Japanese encephalitis: the vectors, ecology and potential for expansion. J Travel Med 25:S16–S26. doi:10.1093/jtm/tay009 - DOI - PubMed

MeSH terms

Substances

LinkOut - more resources