. 2025 Feb 3;42(2):msaf023.
doi: 10.1093/molbev/msaf023.

Combinatorial In Vivo Genome Editing Identifies Widespread Epistasis and an Accessible Fitness Landscape During Lung Tumorigenesis

Affiliations

Combinatorial In Vivo Genome Editing Identifies Widespread Epistasis and an Accessible Fitness Landscape During Lung Tumorigenesis

Jess D Hebert et al. Mol Biol Evol. .

Abstract

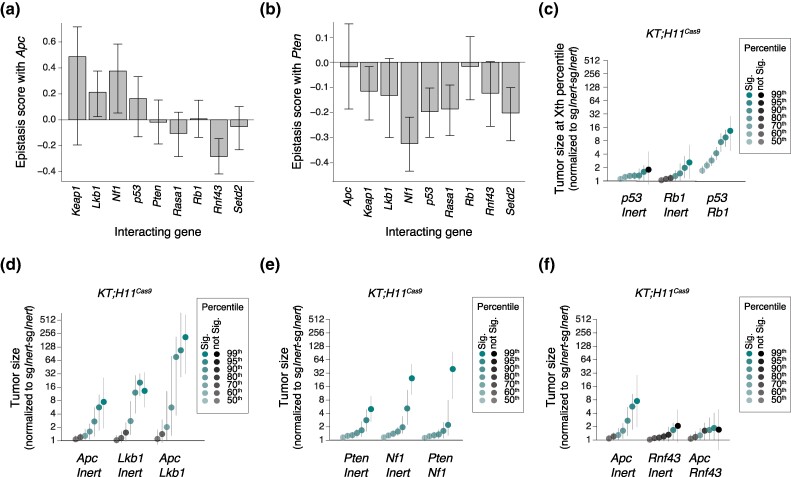
Lung adenocarcinoma, the most common subtype of lung cancer, is genomically complex, with tumors containing tens to hundreds of non-synonymous mutations. However, little is understood about how genes interact with each other to enable the evolution of cancer in vivo, largely due to a lack of methods for investigating genetic interactions in a high-throughput and quantitative manner. Here, we employed a novel platform to generate tumors with inactivation of pairs of ten diverse tumor suppressor genes within an autochthonous mouse model of oncogenic KRAS-driven lung cancer. By quantifying the fitness of tumors with every single and double mutant genotype, we show that most tumor suppressor genetic interactions exhibited negative epistasis, with diminishing returns on tumor fitness. In contrast, Apc inactivation showed positive epistasis with the inactivation of several other genes, including synergistic effects on tumor fitness in combination with Lkb1 or Nf1 inactivation. Sign epistasis was extremely rare, suggesting a surprisingly accessible fitness landscape during lung tumorigenesis. These findings expand our understanding of the interactions that drive tumorigenesis in vivo.

Keywords: cancer evolution; cancer models; epistasis.


Figures

Fig. 1.
Fig. 1.
A dual-sgRNA system integrated with barcoding of clonal cell lineages and application to tumor suppressor gene epistasis in lung cancer. a) Generation of a library of dual-sgRNA vectors with an integrated diverse barcode to enable clonal tracking. BbsI and BsmBI, type IIS restriction enzyme sites; mU6 and bU6, mouse and bovine RNA Pol III promoters; BC, barcode; PGK, phosphoglycerate kinase promoter; LTR, long terminal repeat. b) sgRNA pairs in the Lenti-U6BC-sgDbl/Cre pool. The sgRNA in position 1 (sgRNA1) and position 2 (sgRNA2) is indicated, and the number of sgRNAs targeting each gene is shown in parentheses. This pool should create tumors with 45 distinct double knockout combinations. c) Initiation of KRASG12D-driven lung tumors with Lenti-U6BC-sgDbl/Cre. Genotype, lentiviral titer (ifu, infectious units), and mouse numbers are indicated. Note that KrasLSL−G12D;R26LSL−Tomato (KT) mice received 25-fold more virus than KT;H11LSL−Cas9 and KT;H11Cas9 mice. Bulk tumor-bearing lungs were analyzed after 12 weeks of tumor growth. d) Tomato fluorescent images of lung lobes from the indicated genotypes of mice. Dashed lines outline tissue. Mean ± SD lung weights are indicated. Scale bars, 2 mm. e) Overview of BC-sgRNA1–sgRNA2 read processing, filtering, and analysis. f) Box plot of tumor burden (total number of neoplastic cells of any genotype) normalized to lentiviral titer (ifu) across mouse genotype. g) Box plot of total number of tumors (any genotype of tumor estimated to have >50 neoplastic cells) normalized to lentiviral titer (ifu) across mouse genotype.
Fig. 2.
Fig. 2.
Efficient inactivation of an essential gene, a synthetic lethal pair, and tumor suppressor genes. a) Impact of targeting an essential gene (Pcna) on tumor number in KT;H11LSL−Cas9 and KT;H11Cas9 mice with sgPcna as sgRNA1 or sgRNA2 in the vector. Tumor number is normalized to the representation of each vector in KT mice (which lack Cas9) as well as to all sgInert–sgInert vectors. Means ± 95% confidence intervals are shown. b) Impact of targeting Pcna on tumor number in KT;H11Cas9 mice across all vector configurations with sgPcna as sgRNA1 or sgRNA2 in the vector and different non-targeting (NT), not expressed (NE), and Safe-targeting sgInerts. sgeGFP is a non-targeting sgInert that was previously suggested to be highly competitive for Cas9. Means ± 95% confidence intervals are shown. c) Impact of targeting Ccln1 and/or Ccln2 (synthetic lethal pair) on tumor number in KT;H11Cas9 mice across all vector configurations. Means ± 95% confidence intervals are shown. d) Tumor sizes at the Xth percentile within the tumor size distribution for tumors with inactivation of each single tumor suppressor gene (TSG) normalized to sgInert–sgInert tumors. Data for tumors with inactivation of each TSG are an aggregate of all sgTSG–sgInert, sgInert–sgTSG, and sgTSG–sgTSG vectors targeting that gene. 95% confidence intervals are shown. e) Comparison of effects on tumor size with TSG-targeting sgRNAs as sgRNA1 or sgRNA2 in a vector. Each dot represents a gene. Means ± 95% confidence intervals are shown.
Fig. 3.
Fig. 3.
Broad epistasis between tumor suppressor genes impacts lung cancer growth. a) Definitions and calculations of fitness and epistasis metrics. Expected number of tumors is calculated from the observed number of tumors of each genotype in Cas9-negative KT mice, scaled to the lentiviral titer used for each experiment. b) Heatmap of epistasis scores for all pairwise comparisons in KT;H11Cas9 mice. The color indicates positive or negative epistasis, and the box size indicates significance. Pairs with significant (P < 0.05) and trending (P < 0.1) positive and negative epistasis scores are indicated. c) Expected double mutant relative fitness and epistasis scores negatively correlate. Each dot is a tumor suppressor gene pair. Spearman's rho and associated P value are indicated. d) Fitness effect of a second mutation (columns) on the background of a first mutation (rows) for all genes that increase fitness when inactivated as single mutants in KT;H11Cas9 mice. The color indicates whether each second mutation increases or decreases fitness, and the box size indicates significance. Mutations with significant (P < 0.05) and trending (P < 0.1) positive and negative changes to fitness are indicated. Keap1 inactivation increases mean tumor size but decreases tumor number, resulting in an overall negative effect on fitness, and so interactions involving Keap1 are shown in supplementary fig. S4c and d, Supplementary  Material online. The fitness effects of second mutations are also depicted as bar plots with 95% confidence intervals in supplementary fig. S5, Supplementary Material online.
Fig. 4.
Fig. 4.
Tumor suppressor gene-specific genetic interactions influence tumor fitness. a and b) Epistasis scores ± 95% confidence intervals for all pairs with Apc a) and Pten b). c to f) The size of tumors with single and double mutants of p53/Rb1 c), Apc/Lkb1 d), Pten/Nf1 e), and Apc/Rnf43 f) at the given percentiles of the tumor size distribution normalized to sgInert–sgInert tumors. p53–Rb1 and Apc–Lkb1 genotypes represent positive (synergistic) epistasis because the double mutants have significantly greater fitness than would be expected if the fitness effects of the composite single mutations were merely multiplicative (additive in log space). Pten–Nf1 represents negative (buffering) epistasis because the double mutant genotype has significantly lower fitness than would be expected if the fitness effects of the composite single mutations were multiplicative. However, as the Pten–Nf1 double mutant still has greater tumor sizes than either single mutant, this represents magnitude epistasis. Conversely, Apc–Rnf43 is an instance of negative epistasis and sign epistasis, as the double mutant has lower tumor sizes compared to Apc single mutant tumors. 95% confidence intervals are shown.

Update of

References

    1. Aaltonen LA, Abascal F, Abeshouse A, Aburatani H, Adams DJ, Agrawal N, Ahn KS, Ahn S-M, Aikata H, Akbani R, et al. Pan-cancer analysis of whole genomes. Nature. 2020:578(7793):82–93. 10.1038/s41586-020-1969-6. - DOI - PMC - PubMed
    1. Alonso-del Valle A, León-Sampedro R, Rodríguez-Beltrán J, DelaFuente J, Hernández-García M, Ruiz-Garbajosa P, Cantón R, Peña-Miller R, San Millán A. Variability of plasmid fitness effects contributes to plasmid persistence in bacterial communities. Nat Commun. 2021:12(1):2653. 10.1038/s41467-021-22849-y. - DOI - PMC - PubMed
    1. Ben-David U, Siranosian B, Ha G, Tang H, Oren Y, Hinohara K, Strathdee CA, Dempster J, Lyons NJ, Burns R, et al. Genetic and transcriptional evolution alters cancer cell line drug response. Nature. 2018:560(7718):325. 10.1038/s41586-018-0409-3. - DOI - PMC - PubMed
    1. Birkbak NJ, McGranahan N. Cancer genome evolutionary trajectories in metastasis. Cancer Cell. 2020:37(1):8–19. 10.1016/j.ccell.2019.12.004. - DOI - PubMed
    1. Bond CE, McKeone DM, Kalimutho M, Bettington ML, Pearson S-A, Dumenil TD, Wockner LF, Burge M, Leggett BA, Whitehall VLJ. RNF43 and ZNRF3 are commonly altered in serrated pathway colorectal tumorigenesis. Oncotarget. 2016:7(43):70589–70600. 10.18632/oncotarget.12130. - DOI - PMC - PubMed