

16S rRNA sequencing reveals relationships among enrichment of oral microbiota in the lower respiratory tract and pulmonary nodules malignant progression
- PMID: 39907436
- PMCID: PMC11878090
- DOI: 10.1128/spectrum.01284-24
16S rRNA sequencing reveals relationships among enrichment of oral microbiota in the lower respiratory tract and pulmonary nodules malignant progression
Abstract
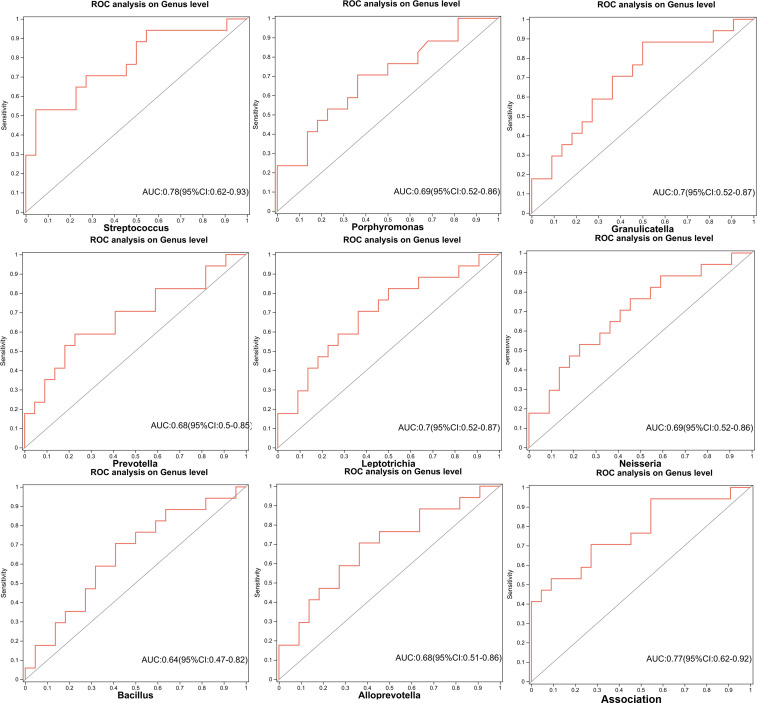
Micro-aspiration of oral microorganisms results in considerable enrichment within the lower respiratory tract (LRT), constituting an early event in lung cancer pathogenesis. To explore the correlation between malignant risk of pulmonary nodules (PNs) and oral commensals enrichment in LRT, oral saliva and bronchial alveolar lavage fluid samples from 22 low-risk PN patients, 17 intermediate-risk PN patients, and 11 high-risk PN patients were analyzed using 16S rRNA gene sequencing. Alpha and beta diversity analyses reveal minimal variation in oral microbial diversity and abundance among patients with different risks of PN. In contrast, a significant reduction in the diversity of LRT microbiota is observed in patients at high risk of PN. Based on multigroup comparative analysis of species differences and the linear discriminant analysis effect size method, Synergistes and Tannerella were identified as the dominant bacterial genera in the oral and LRT of high-risk PN patients, respectively. The study found that the LRT microbiota of PN patients seemed to originate from the oral, and the high enrichment of oral microbiota in the lower respiratory tract was most common in high-risk PN patients. The predominant bacterial genera present in the oral cavity and LRT of patients with PN were identified through abundance variance analysis. Eight key microbial genera were found in both the oral cavity and LRT: Streptococcus, Granulicatella, Porphyromonas, Bacillus, Neisseria, Alloprevotella, Prevotella, and Leptotrichia. Notably, receiver operating characteristic analysis identified Streptococcus, Granulicatella, and Leptotrichia as reliable biomarkers to differentiate high-risk PN. Spearman correlation analysis confirmed that the accumulation of oral microorganisms in the LRT played an important role in the process of PN cancerization. The co-occurrence network showed that the coexistence of Veillonella and Streptococcus in the oral and LRT may be involved in the occurrence of PN, while the LRT cluster of Rothia occurred in high-risk PN patients. Correlation analysis among species identified microbial communities predominantly composed of Veillonella, which may facilitate pulmonary carcinogenesis.
Importance: This study is the first to elucidate the composition and interrelationships of oral and lower respiratory tract (LRT) microbiota in patients with pulmonary nodule (PN) across varying malignancy risk levels. We conducted an analysis to investigate the correlation between the malignant potential of PNs and the enrichment of oral microbiota within the LRT. Additionally, we explored the feasibility of utilizing oral-lower respiratory commensal microbiota as biomarkers to assess the benign and malignant nature of pulmonary nodules. This study aims to provide evidence supporting early diagnosis and intervention strategies for lung cancer.
Keywords: biomarkers; lower respiratory microbiome; malignant risk; oral microbiome; pulmonary nodules.
Conflict of interest statement
The authors declare no conflict of interest.
Figures


References
-
- Tang W, Wu N, Huang Y, Wang J, Zhao S, Xu Z, Zhang K, Jiang Y, Cai Q, Zhou L, Li M, Tao D, Liu X, Wang Y. 2014. A study on low dose CT early lung cancer screening in 4690 asymptomatic health examination patients. Chin J Clin Oncol 36:549–554. - PubMed
-
- Aberle DR, Adams AM, Berg CD, Black WC, Clapp JD, Fagerstrom RM, Gareen IF, Gatsonis C, Marcus PM, Sicks JD, National Lung Screening Trial Research Team . 2011. Reduced lung-cancer mortality with low-dose computed tomographic screening. N Engl J Med 365:395–409. doi: 10.1056/NEJMoa1102873 - DOI - PMC - PubMed
MeSH terms
Substances
Grants and funding
LinkOut - more resources
Full Text Sources
Medical
