

Selective Recovery of Critical Minerals from Simulated Electronic Wastes Via Reaction-Diffusion Coupling
- PMID: 39907467
- PMCID: PMC12094141
- DOI: 10.1002/cssc.202402372
Selective Recovery of Critical Minerals from Simulated Electronic Wastes Via Reaction-Diffusion Coupling
Abstract
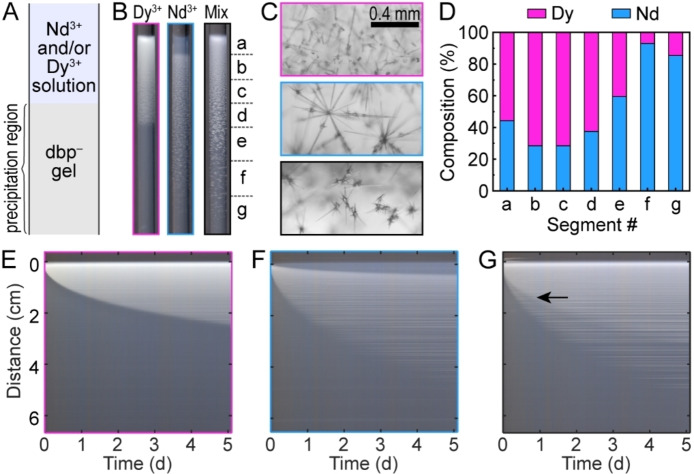
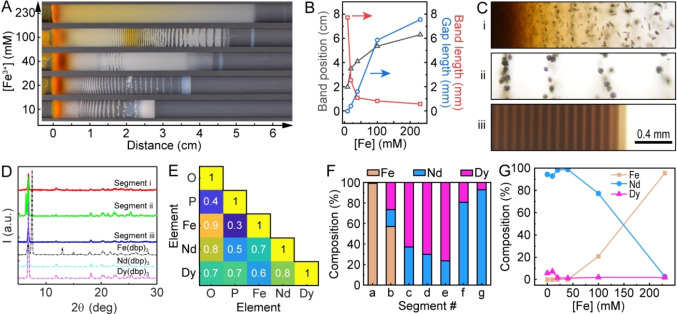
Atom- and energy-efficient chemical separations are urgently needed to meet the surging demand for critical materials that has strained supply chains and threatened environmental damage. In this study, we used reaction-diffusion coupling to separate iron, neodymium, and dysprosium ions from model feedstocks of permanent magnets, which are typically found in electronic wastes. Feedstock solutions were placed in contact with a hydrogel loaded with potassium hydroxide and/or dibutyl phosphate, resulting in complex precipitation patterns as the various metal ions diffused into the reaction medium. Specifically, we observed the precipitation of up to 40 mM of iron from the feedstock, followed by the enrichment of 73 % dysprosium, and the extraction of >95 % neodymium product at a further distance from the solution-gel interface. We designed a series of experiments and simulations to determine the relevant ion diffusivities, DNd=5.4×10⁻¹⁰ and DDy=5.1×10⁻¹⁰ m2/s, and precipitation rates, kNd =1.0×10⁻⁵ and kDy=5.0×10⁻³ m9 mol-3 s-1, which enabled a numerical model to be established for predicting the distribution of products in the reaction medium. Our proof-of-concept study validates reaction-diffusion coupling as an effective and versatile approach for critical materials separations, without relying on ligands, membranes, resins, or other specialty chemicals.
Keywords: Critical elements; crystallization; interfaces; reaction-diffusion; separations.
© 2025 Battelle Memorial Institute and The Author(s). ChemSusChem published by Wiley-VCH GmbH.
Conflict of interest statement
The authors declare no conflict of interest.
Figures


Similar articles
-
Material flow analysis of NdFeB magnets for Denmark: a comprehensive waste flow sampling and analysis approach.Environ Sci Technol. 2014 Oct 21;48(20):12229-37. doi: 10.1021/es501975y. Epub 2014 Oct 3. Environ Sci Technol. 2014. PMID: 25238428
-
Tailoring the Use of 8-Hydroxyquinolines for the Facile Separation of Iron, Dysprosium and Neodymium.ChemSusChem. 2024 Nov 11;17(21):e202400286. doi: 10.1002/cssc.202400286. Epub 2024 Jul 8. ChemSusChem. 2024. PMID: 38786929
-
Novel phosphate functionalized sodium alginate hydrogel for efficient adsorption and separation of Nd and Dy from Co.J Environ Manage. 2024 Feb 27;353:120283. doi: 10.1016/j.jenvman.2024.120283. Epub 2024 Feb 7. J Environ Manage. 2024. PMID: 38330842
-
The Minderoo-Monaco Commission on Plastics and Human Health.Ann Glob Health. 2023 Mar 21;89(1):23. doi: 10.5334/aogh.4056. eCollection 2023. Ann Glob Health. 2023. PMID: 36969097 Free PMC article. Review.
-
Co-sorption of metal ions and inorganic anions/organic ligands on environmental minerals: A review.Sci Total Environ. 2022 Jan 10;803:149918. doi: 10.1016/j.scitotenv.2021.149918. Epub 2021 Aug 26. Sci Total Environ. 2022. PMID: 34482133 Review.
Cited by
-
A Non-Autonomous Amphoteric Metal Hydroxide Oscillations and Pattern Formation in Hydrogels.Molecules. 2025 Mar 15;30(6):1323. doi: 10.3390/molecules30061323. Molecules. 2025. PMID: 40142098 Free PMC article.
References
-
- Sholl D. S., Lively R. P., Nature 2016, 532, 435–437. - PubMed
-
- Granite E. J., Bromhal G., Wilcox J., Alvin M. A., The Bridge 2023, 53, 59–66.
-
- Opare E. O., Struhs E., Mirkouei A., Renewable Sustainable Energy Rev. 2021, 143, 110917.
-
- Xie F., Zhang T. A., Dreisinger D., Doyle F., Miner. Eng. 2014, 56, 10–28.
-
- Sarker S. K., Haque N., Bhuiyan M., Bruckard W., Pramanik B. K., J. Environ. Chem. Eng. 2022, 10, 107622. - PubMed
Grants and funding
LinkOut - more resources
Full Text Sources
