. 2025 Mar 10;11(3):1598-1611.
doi: 10.1021/acsbiomaterials.4c01601. Epub 2025 Feb 5.

Freeze-Dried Porous Collagen Scaffolds for the Repair of Volumetric Muscle Loss Injuries

Freeze-Dried Porous Collagen Scaffolds for the Repair of Volumetric Muscle Loss Injuries

Ivan M Basurto et al. ACS Biomater Sci Eng. .

Abstract

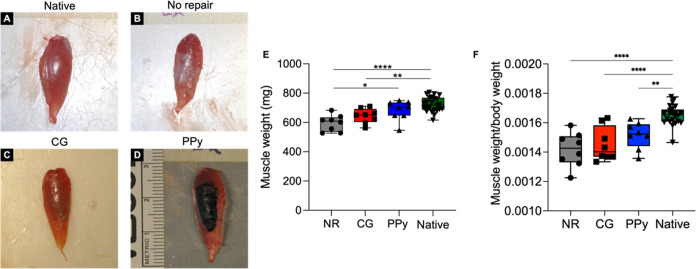
Volumetric muscle loss (VML) injuries are characterized by the traumatic loss of skeletal muscle, resulting in permanent damage to both tissue architecture and electrical excitability. To address this challenge, we previously developed a three-dimensional (3D) aligned collagen-glycosaminoglycan (CG) scaffold platform that supported in vitro myotube alignment and maturation. In this work, we assessed the ability of CG scaffolds to facilitate functional muscle recovery in a rat tibialis anterior (TA) model of VML. Functional muscle recovery was assessed following implantation of either nonconductive CG or electrically conductive CG-polypyrrole (PPy) scaffolds at 4, 8, and 12 weeks postinjury by in vivo electrical stimulation of the peroneal nerve. After 12 weeks, scaffold-treated muscles produced maximum isometric torque that was significantly greater than nontreated tissues. Histological analysis further supported these reparative outcomes with evidence of regenerating muscle fibers at the material-tissue interface in scaffold-treated tissues that were not observed in nonrepaired muscles. Scaffold-treated muscles possessed higher numbers of M1 and M2 macrophages at the injury, while conductive CG-PPy scaffold-treated muscles showed significantly higher levels of neovascularization as indicated by the presence of pericytes and endothelial cells, suggesting a persistent wound repair response not observed in nontreated tissues. Finally, only tissues treated with nonconductive CG scaffolds displayed neurofilament staining similar to native muscle, further corroborating isometric contraction data. Together, these findings show that both conductive and nonconductive CG scaffolds can facilitate improved skeletal muscle function and endogenous cellular repair, highlighting their potential use as therapeutics for VML injuries.

Keywords: CG-polypyrrole (PPy); collagen-glycosaminoglycan; volumetric muscle losss.


Conflict of interest statement

The authors declare no competing financial interest.

Figures

Figure 1
Figure 1
CG scaffolds were surgically implanted into a tibialis anterior (TA) model of VML injury. (A) Schematic representation of scaffold delivery into the TA VML injury model. Representative images of (B) no repair, (C) nonconductive CG scaffold, and (D) PPy-doped CG scaffold-treated muscles. (E) Animal body weight 1 week prior to surgery and at 4, 8, and 12 weeks post-VML injury, corresponding to functional testing time points. (F) Weight of defects created for no repair, nonconductive CG scaffold, and conductive PPy-doped CG scaffold (NR, CG, and PPy, respectively) experimental groups. (G) Maximum baseline torque generation normalized to animal body weight preinjury. Data are presented as Mean ± SD (panels E, G) while panel (F) data are presented as box plots of interquartile range (line: median) with whiskers showing minimum and maximum values. n.s.: no statistically significant differences. n = 8 animals per experimental group.
Figure 2
Figure 2
Both conductive and nonconductive scaffolds supported improved functional muscle recovery at 12 weeks post-VML. (A) Torque vs frequency curves at 4 weeks postinjury show a roughly 50% drop in muscle force from baseline values. (B) At 8 weeks post-VML, nonconductive scaffold-treated muscles showed significantly increased torque production at higher stimulation frequencies. (C) At 12 weeks postinjury, conductive CG-PPy and nonconductive CG scaffold-treated tissues produced significantly more force in response to higher stimulation frequencies. (D) Peak isometric contraction normalized to baseline values showed that both CG-PPy and CG scaffolds facilitated increased functional recovery compared to nontreated tissues. Data are presented as Mean ± SD. Statistically significant differences compared to the no repair group are denoted by g (CG) and p (PPy). * P < 0.05. n = 8 animals per experimental group.
Figure 3
Figure 3
Gross tissue morphology at 12 weeks post-VML indicates a disparate biological response to therapeutic intervention. (A) Representative image of uninjured native tissue. (B) Nonrepaired muscles possessed a layer of fibrotic and fatty tissue that surrounded the VML injury area. (C) CG scaffold-treated muscles displayed lower levels of fibrosis, but some ECM deposition was observed. (D) PPy particles remained localized to the VML defect although the collagen scaffold appeared degraded. (E) Muscle weight at the time of explant shows that NR and CG scaffold-treated tissues were significantly lighter than native muscle. (F) When normalized to animal body weight, explanted muscle weight was significantly reduced for all experimental groups compared to native muscle. Data are presented as box plots of interquartile range (line: median) with whiskers showing minimum and maximum values. * P < 0.05, ** P < 0.01, **** P < 0.0001. n = 8 muscles per experimental group and n = 24 for the native contralateral control.
Figure 4
Figure 4
Histological analysis of TA muscles at 12 weeks postinjury. (A) H&E images of TA muscle cross sections for uninjured native tissue, (B) no repair, (C) CG scaffold, and (D) PPy-doped scaffold experimental groups at 12 weeks post-VML. Dashed red line indicates the concave VML defect area that remained due to limited tissue regeneration in the no repair group. Red squares denote regions of magnified images (E–H). (E) Magnified views of native tissue, (F) no repair, (G) the CG scaffold, and (H) the CG-PPy scaffold experimental groups. Arrows indicate myofibers with centrally located nuclei. Scale bars: 1 mm (top); 100 μm (bottom).
Figure 5
Figure 5
Myofiber cross-sectional area is significantly reduced in nontreated muscle tissues. (A) Representative laminin-stained sections of TA muscles for native uninjured control, (B) no repair, (C) nonconductive CG scaffolds, and (D) conductive CG-PPy scaffold-treated muscles at 12 weeks post-VML. Red rectangles denote regions of VML injury used for FCSA analysis. (E, H) Colorized outputs from SMASH software with each color representing individually segmented myofibers corresponding to (A, D), respectively. (I) Muscle fiber count at the VML injury was not statistically different from native muscle across experimental groups. (J) Median fiber cross-sectional area (FCSA) was significantly reduced in NR muscles. (K) FCSA relative frequency curves show a leftward shift toward smaller muscle fibers compared to uninjured muscle regardless of treatment type. Data are presented as Mean ± SD while panel (J) data are presented as the median (line: median) with interquartile range (whiskers). n.s.: no statistically significant differences. n = 3 muscles per experimental group. Scale bar: 1 mm.
Figure 6
Figure 6
Scaffold-treated muscles show elevated macrophage infiltration at VML injury compared to native muscle. (A–D) Representative images of macrophage infiltration at 12 weeks post-VML. Images were taken at the site of VML injury and stained for CD68 (green, arrow) and CD163 (red, arrowhead). (E) CD68+/CD163 M1 macrophages remained elevated in CG and CG-PPy scaffold-treated muscles, indicating a prolonged wound healing response although these results were not statistically significant. (F) Quantification of CD163+ cells indicative of M2 macrophages showed no statistically significant differences across the experimental groups. Units for y-axes in panels (E, F): Macrophages per field of view. Data presented as Mean ± SD. n.s.: no statistically significant differences. n = 3 muscles per experimental group. Scale bar: 200 μm.
Figure 7
Figure 7
Conductive scaffolds support higher levels of neovascularization at 12 weeks post-VML. (A–D) Representative images of vascular staining at 12 weeks post-VML. Images were taken at and around the defect site showing CD31+ cells (red, arrowhead) and αSMA+ structures (green, arrow) within the region of interest. (E–H) Magnified images of muscle defect areas in (E) native, (F) no repair, (G) CG scaffold, and (H) CG-PPy scaffold experimental groups. (I) CD31+ cell counts were significantly elevated in CG-PPy scaffold-treated muscles. (J) The number of αSMA+ structures was significantly increased in CG-PPy scaffold-treated muscles compared to all other experimental groups. Units for y-axes in panels (I, J): Cells/structures per field of view. Data presented as Mean ± SD. ** P < 0.01, *** P < 0.001, **** P < 0.0001. n = 3 muscles per experimental group. Scale bars: 2 mm (A–D) and 100 μm (E–H).
Figure 8
Figure 8
Muscle innervation is significantly reduced in nontreated muscles at 12 weeks post-VML. (A–D) Representative images of neurofilament staining at 12 weeks post-VML. NF200 structures (green, arrow) were quantified from images across longitudinal muscle sections. (E) Quantification of NF200 structures revealed that CG scaffold-treated tissues possess statistically similar levels of peripheral nerves compared with native muscle. Units for y-axis in panel (E): structures per field of view. Data are presented as Mean ± SD. * P < 0.05. n = 3 muscles per experimental group. Scale bar: 200 μm.

Update of

Similar articles

References

    1. Grogan B. F.; Hsu J. R.; Volumetric Muscle Loss. Am. Acad. Orthop. Surg. 2011, 19, S35–S37. 10.5435/00124635-201102001-00007. - DOI - PubMed
    1. Ciciliot S.; Schiaffino S. Regeneration of Mammalian Skeletal Muscle: Basic Mechanisms and Clinical Implications. Curr. Pharm. Des. 2010, 16 (8), 906–914. 10.2174/138161210790883453. - DOI - PubMed
    1. Larouche J.; Greising S. M.; Corona B. T.; Aguilar C. A. Robust Inflammatory and Fibrotic Signaling Following Volumetric Muscle Loss: A Barrier to Muscle Regeneration Comment. Cell Death Dis. 2018, 9 (3), 18–20. 10.1038/s41419-018-0455-7. - DOI - PMC - PubMed
    1. Corona B. T.; Wenke J. C.; Ward C. L. Pathophysiology of Volumetric Muscle Loss Injury. Cells Tissues Organs 2016, 202 (3–4), 180–188. 10.1159/000443925. - DOI - PubMed
    1. Baker H. B.; Passipieri J. A.; Siriwardane M.; Ellenburg M. D.; Vadhavkar M.; Bergman C. R.; Saul J. M.; Tomblyn S.; Burnett L.; Christ G. J. Cell and Growth Factor-Loaded Keratin Hydrogels for Treatment of Volumetric Muscle Loss in a Mouse Model. Tissue Eng., Part A 2017, 23, 572–584. 10.1089/ten.tea.2016.0457. - DOI - PMC - PubMed

LinkOut - more resources