. 2025 May 2;23(5):379-390.
doi: 10.1158/1541-7786.MCR-24-0544.

ATAD2 Drives Prostate Cancer Progression to Metastasis

Affiliations

ATAD2 Drives Prostate Cancer Progression to Metastasis

Anindita Dutta et al. Mol Cancer Res. .

Abstract

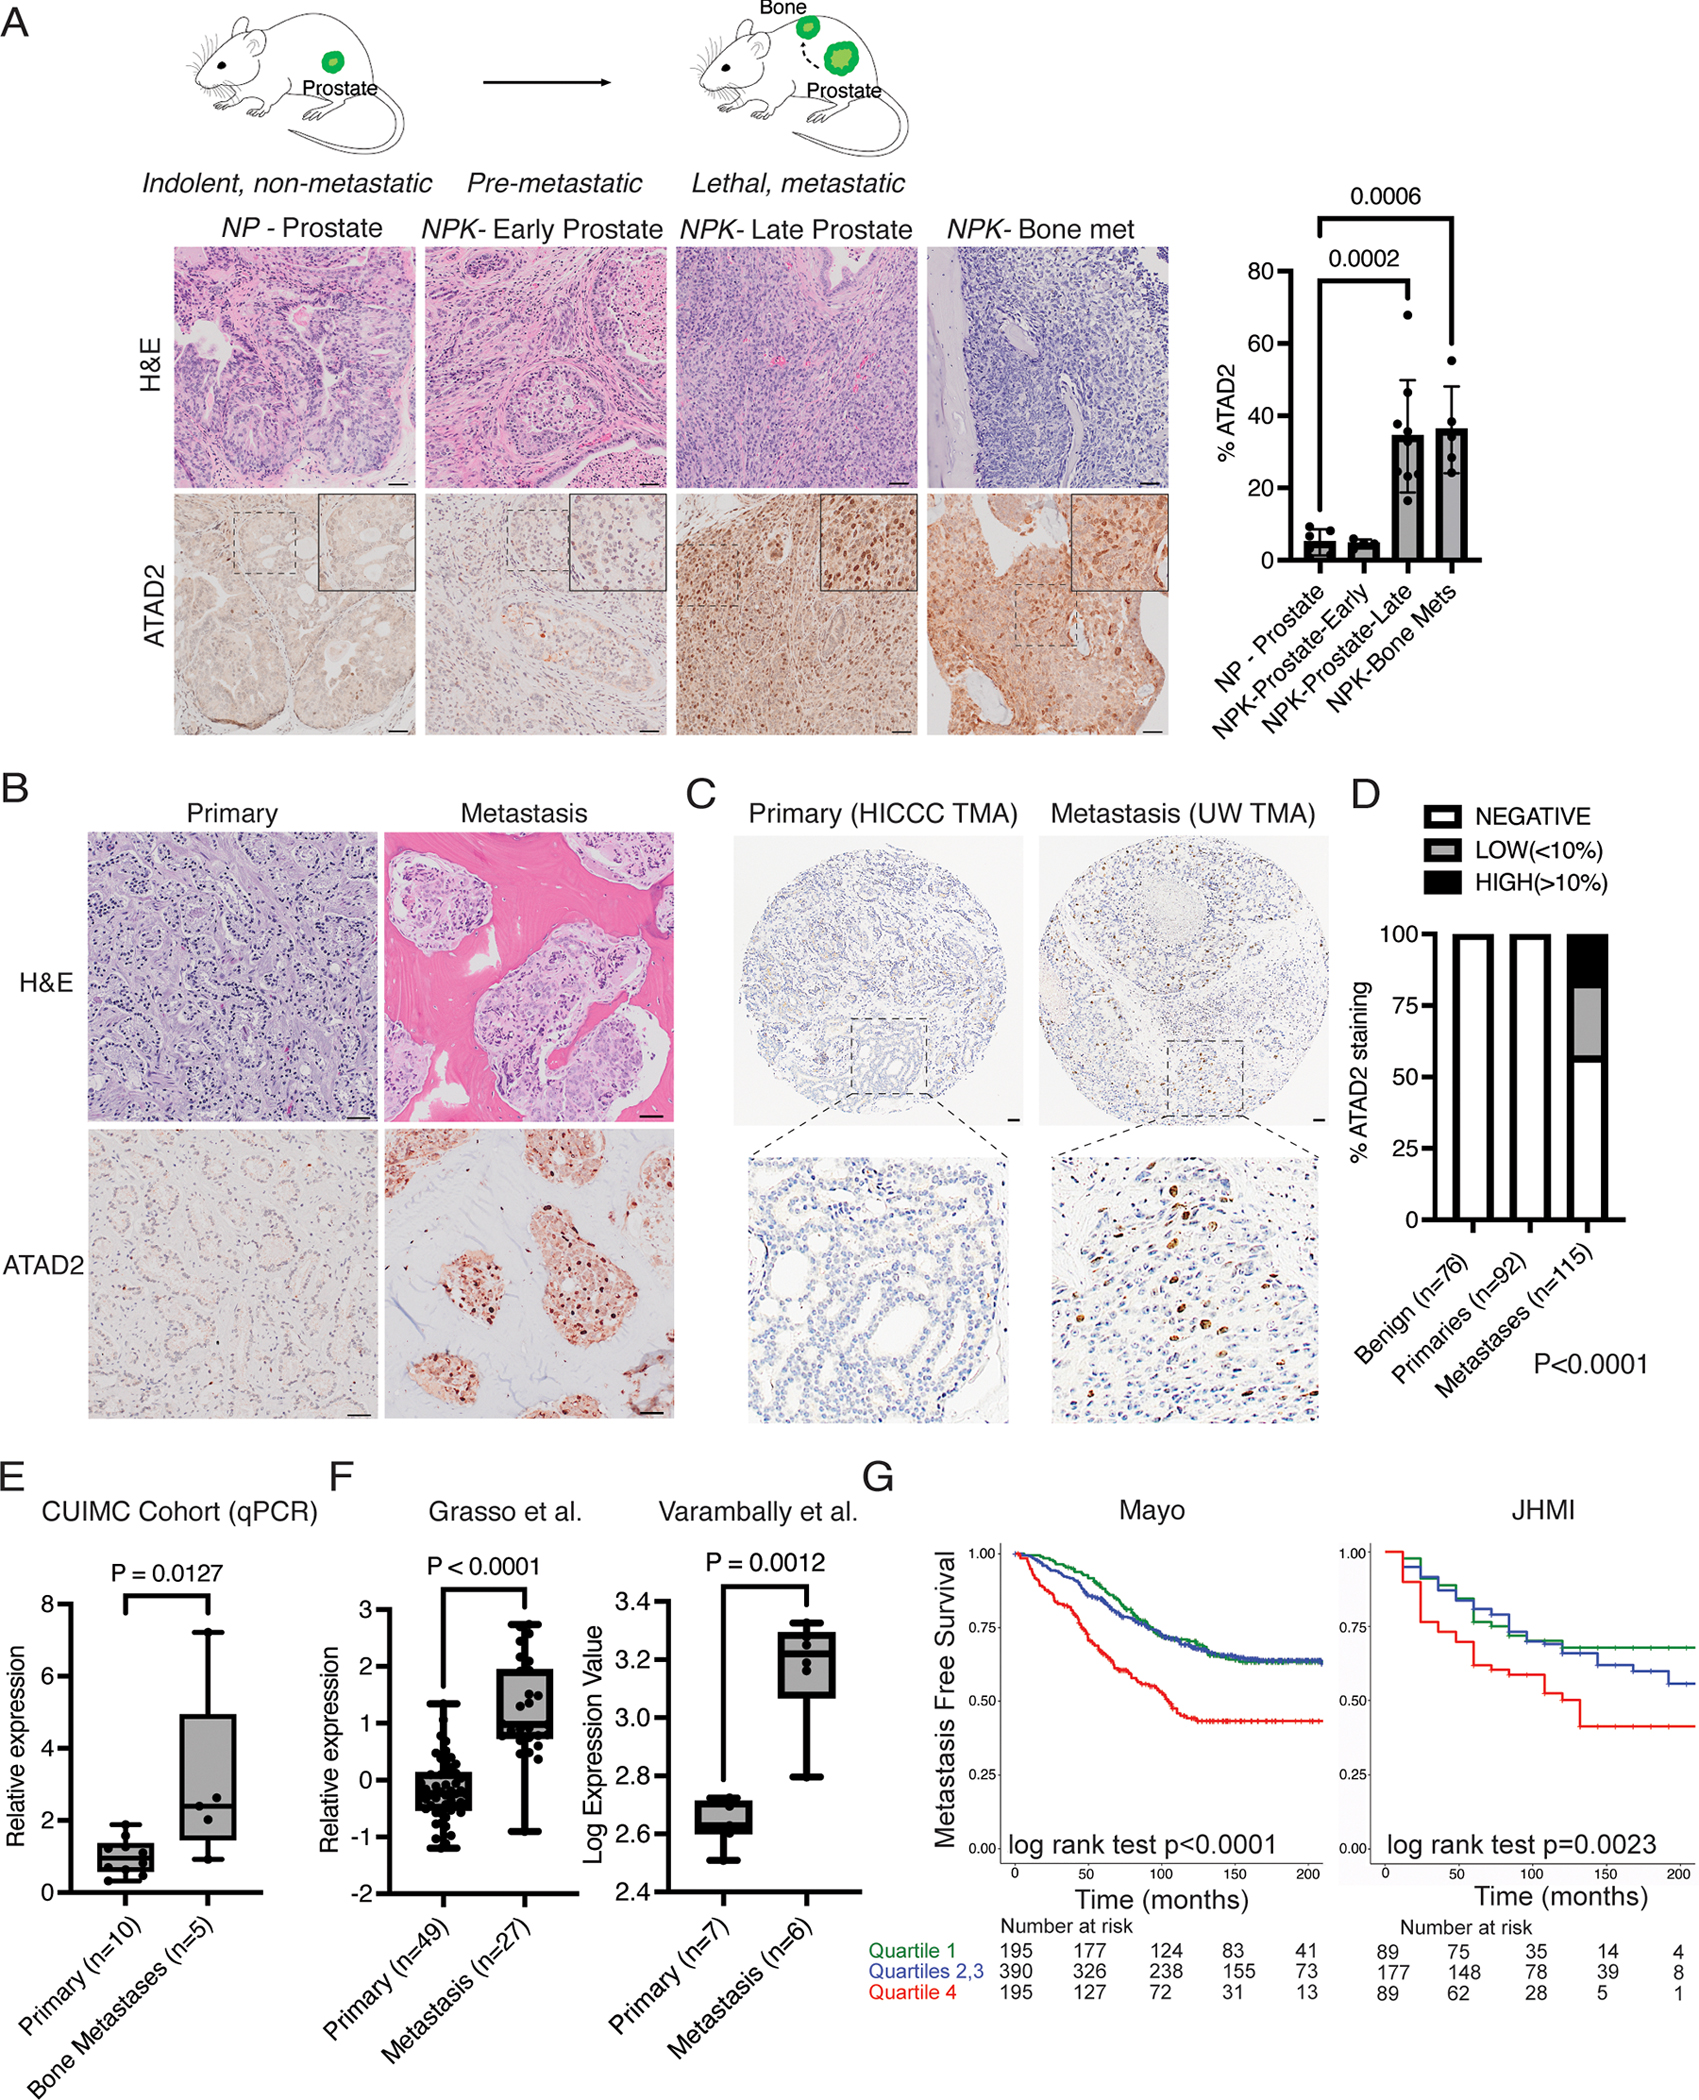
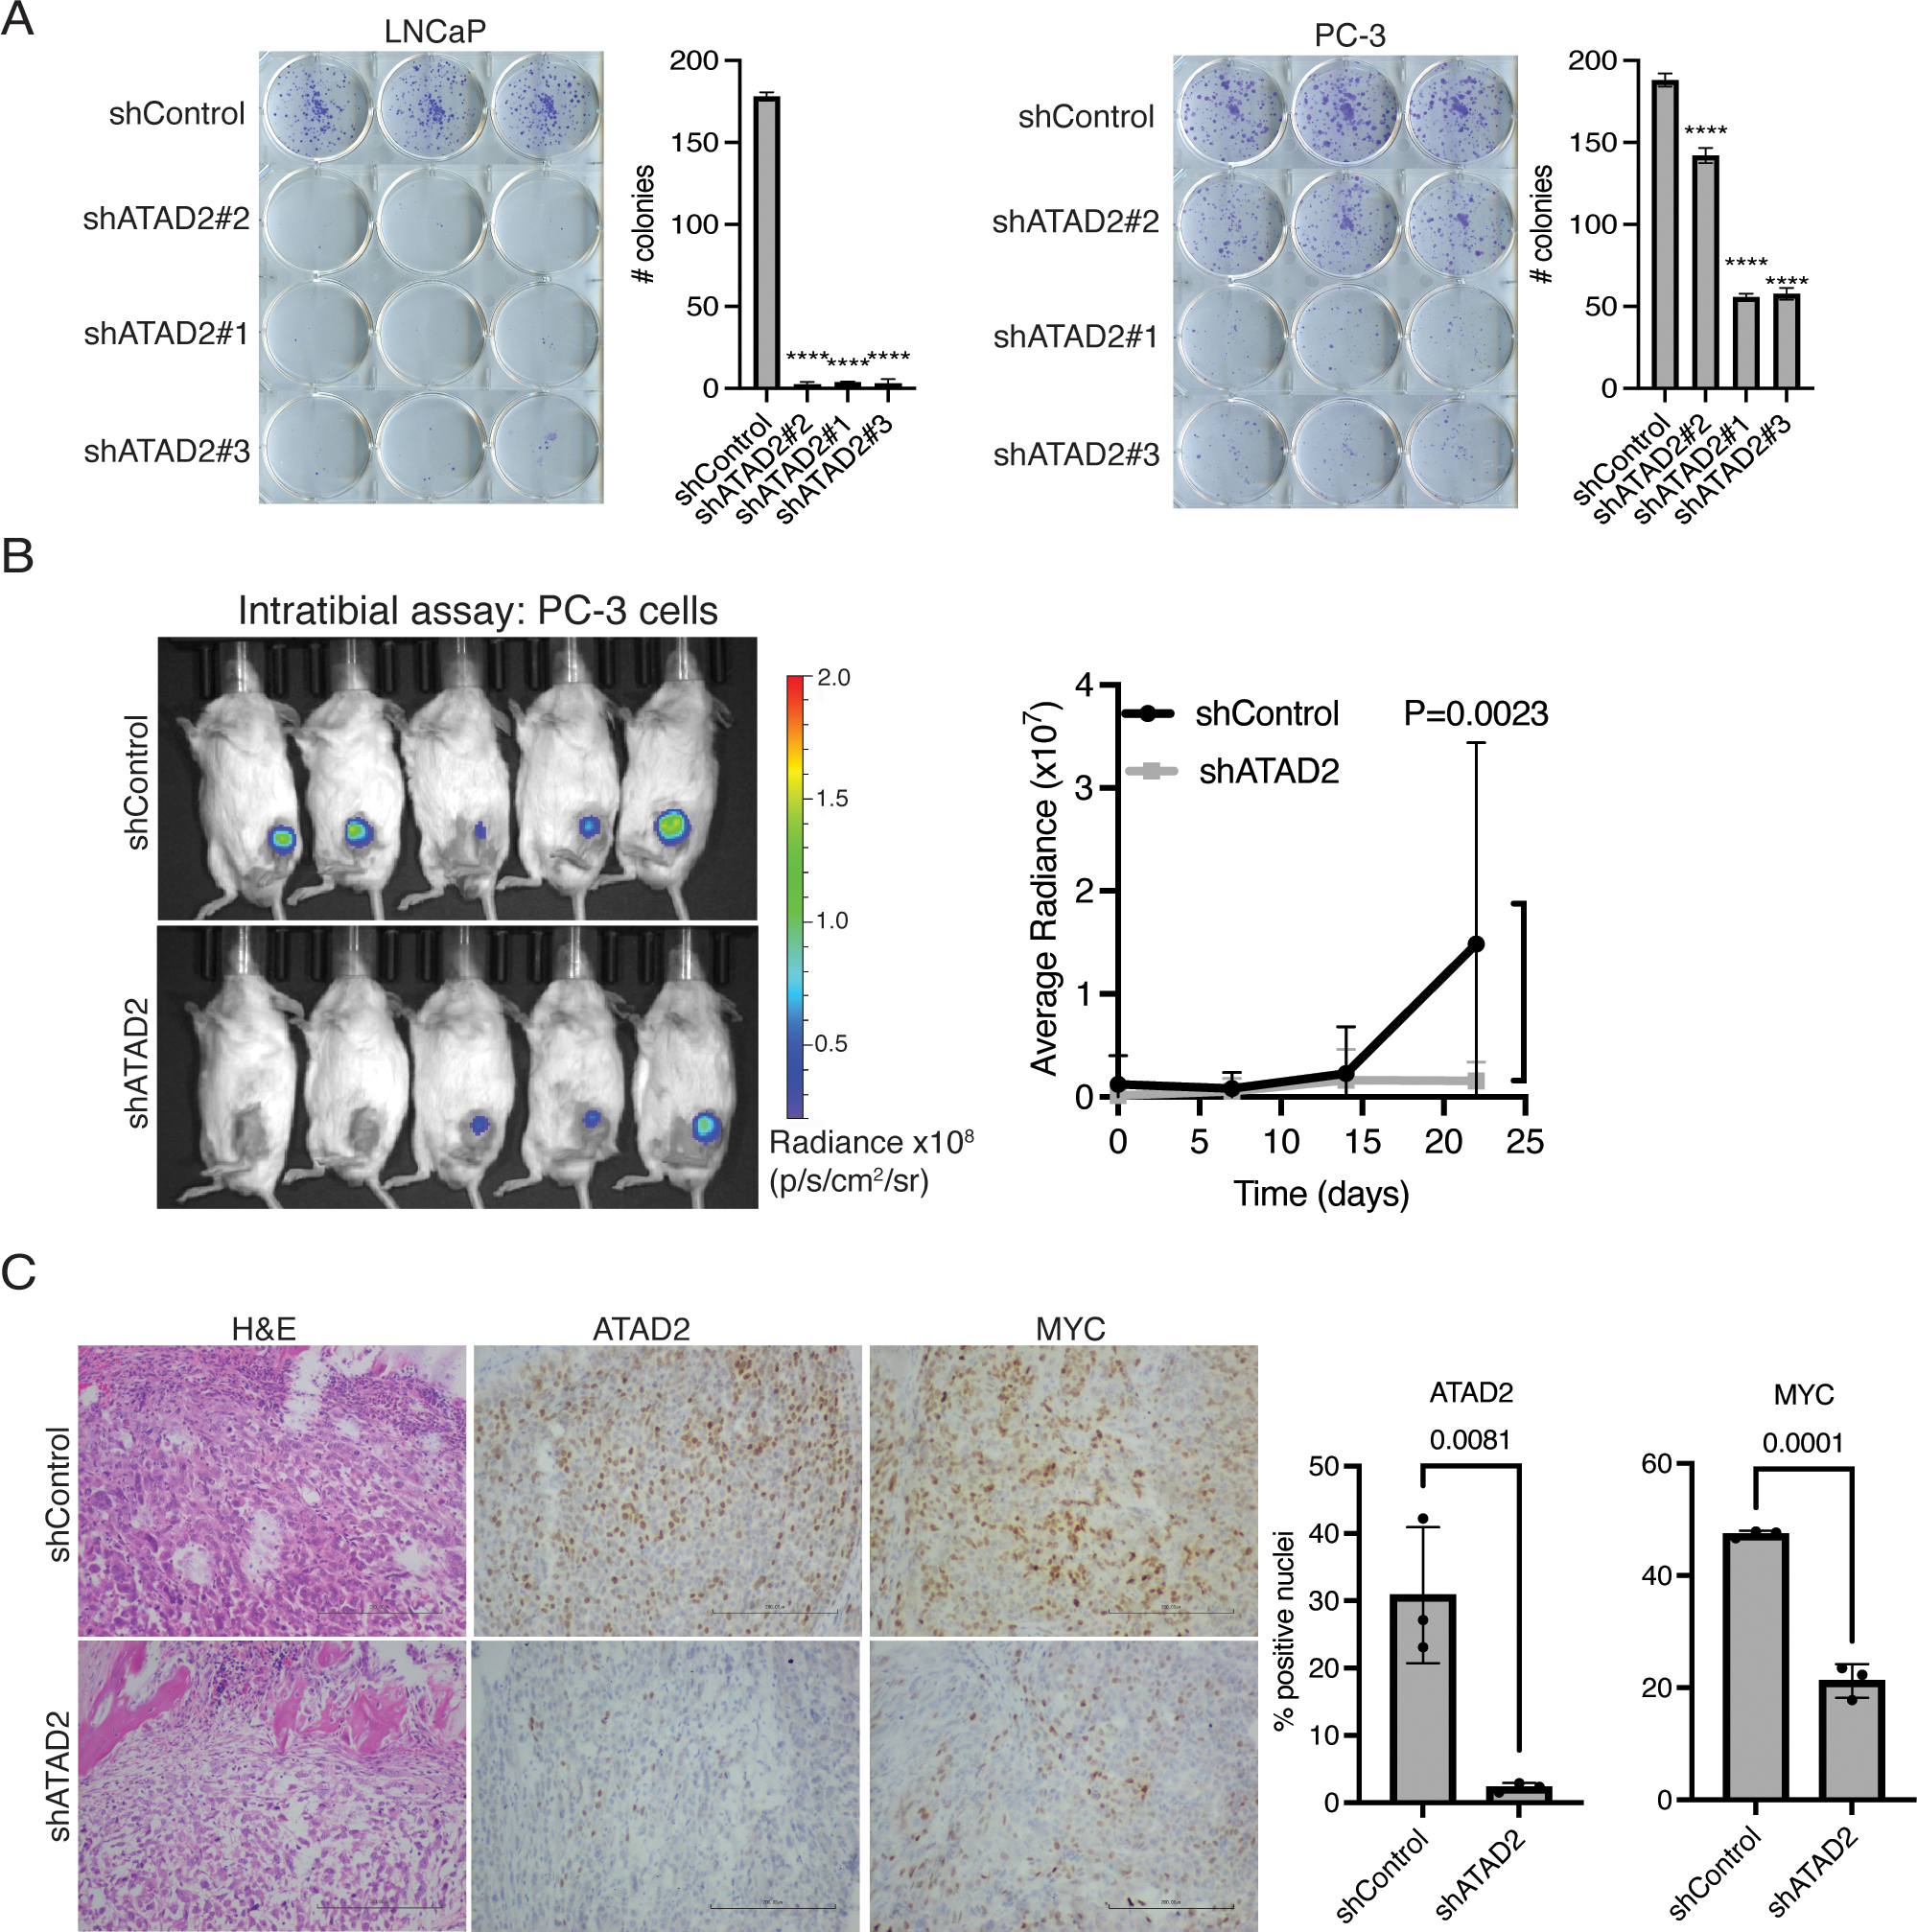
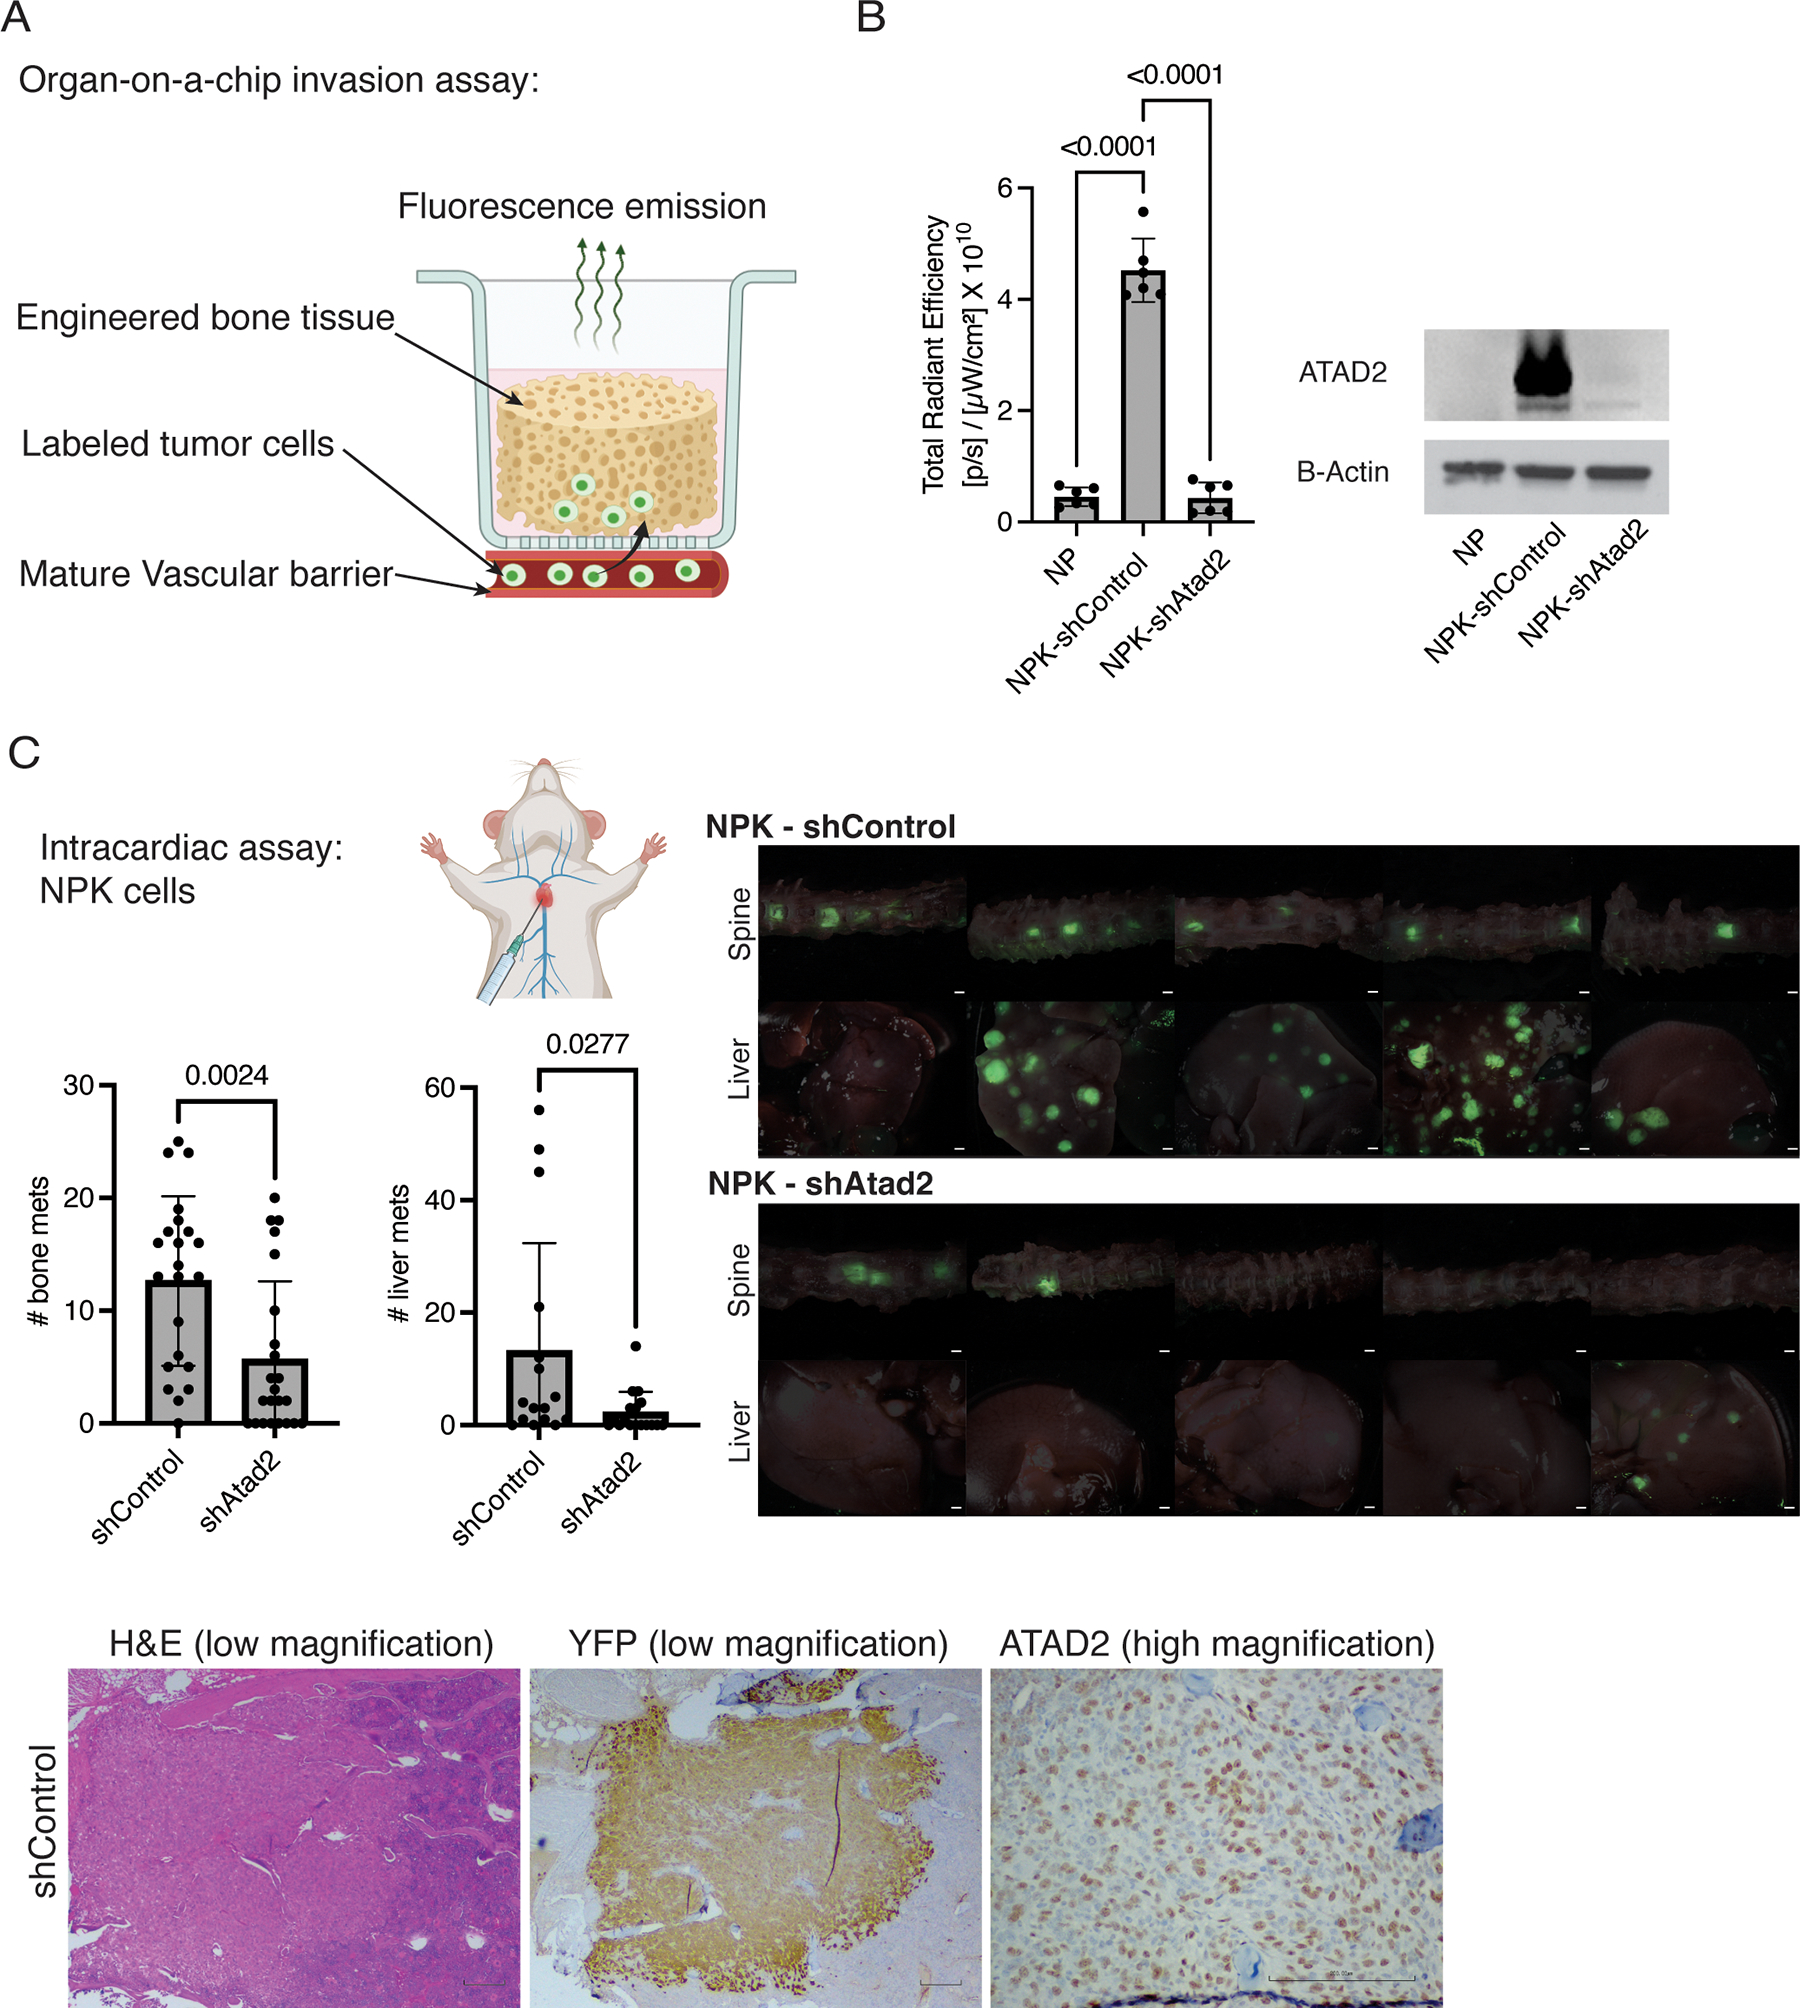
Metastasis accounts for the overwhelming majority of cancer deaths. In prostate cancer and many other solid tumors, progression to metastasis is associated with drastically reduced survival outcomes, yet the mechanisms behind this progression remain largely unknown. ATPase family AAA domain containing 2 (ATAD2) is an epigenetic reader of acetylated histones that is overexpressed in multiple cancer types and usually associated with poor patient outcomes. However, the functional role of ATAD2 in cancer progression and metastasis has been relatively understudied. Here, we employ genetically engineered mouse models of prostate cancer bone metastasis, as well as multiple independent human cohorts, to show that ATAD2 is highly enriched in bone metastasis compared with primary tumors and significantly associated with the development of metastasis. We show that ATAD2 expression is associated with MYC pathway activation in patient datasets and that, at least in a subset of tumors, MYC and ATAD2 can regulate each other's expression. Using functional studies on mouse bone metastatic cell lines and innovative organ-on-a-chip bone invasion assays, we establish a functional role for ATAD2 inhibition in reducing prostate cancer metastasis and growth in bone. Implications: Our study highlights ATAD2 as a driver of prostate cancer progression and metastasis and suggests it may constitute a promising novel therapeutic target.


Conflict of interest statement

Conflicts of Interest:

RJK: Prior research support & intellectual property licensed to Veracyte.

MA and ED: employees of Veracyte, Inc.

All other authors report no competing interests.

Figures

Figure 1:
Figure 1:. ATAD2 is expressed in human and mouse metastatic prostate cancer and associated with the development of metastasis.
A) Schematic diagrams of different GEMMs that recapitulate the progression of prostate cancer (green) from indolent (non-lethal) NP tumors, early pre-metastatic NPK tumors (ie, before development of metastasis) and late, highly metastatic tumors that include metastasis to bone. Representative histological sections stained by H&E and immunohistochemistry for ATAD2 are shown, including a bone metastasis from a late NPK mouse. The region delimited by boxes is amplified in the inset to show nuclear staining. Scatter plots show the quantification of ATAD2 nuclear positivity in tumors from each category, with P values for one-way ANOVA with Dunnett’s multiple comparisons test compared to NP. B) Representative histological sections stained by H&E and immunohistochemistry for ATAD2 on whole tissue primary tumors obtained from radical prostatectomies as well as metastases from bone biopsies. C) ATAD2 IHC on tissue microarray (TMA) cores from a representative negative primary tumor and a metastasis with high ATAD2 expression. The region delimited by boxes is amplified to show nuclear staining. D) Stacked bar graphs showing quantification of ATAD2 positivity in different TMA tissues. The P value shown is for Fisher’s exact test comparing ATAD2 positivity (using a 1% expression cutoff) in primaries versus metastases. E,F) Box plots showing relative expression of ATAD2 in primary tumors and metastasis from three different patient cohorts. E) CUIMC cohort analyzed by qRT-PCR. F) Publicly available datasets from microarray expression data. P values in E,F are for unpaired, double sided T-test. G) Kaplan-Meier metastasis-free survival curves of ATAD2 expression stratified by quartiles in the Mayo (left) and JHMI (right) cohorts of primary tumors with prolonged follow-up data. P values were estimated using a log-rank test. Scale bars represent 50um. Mouse diagrams were created with BioRender.com.
Figure 2:
Figure 2:. Association between MYC and ATAD2 expression.
A) Correlation between ATAD2 expression and MYC pathway activation in two metastatic (SU2C, n=266 and FHCRC, n=149) and one primary (TCGA, n=491) prostate cancer patient cohorts. MYC pathway activity was estimated based on the sum of Z-scores from genes in the MYC Hallmarks v1 gene set of MYC targets. R and P values are derived from Spearman’s test and the linear regression line is shown. The fourth graph on the right depicts linear regression lines on the TCGA cohort subdivided by quartiles (Q1-Q4) of ATAD2 expression, and R values are shown below for each quartile. B) Bar graph summarizing correlations between ATAD2 and MYC mRNA to MYC pathway in the three datasets. Only significant correlations (P<0.01) are shown. C) Capture of the UCSC genome browser (GRCh33/hg38) showing ~60kb region on human chromosome 8 around ATAD2 promoter (y axis = reads per kilobase per million reads). UCSC genes (blue) at the top. Putative ENCODE candidate Cis-Regulatory Elements (cCREs) are shown at the bottom, with color codes according to ENCODE classification of regulatory signatures: red= promoter-like, orange = proximal enhancer-like and yellow = distal enhancer-like. Embedded ChIP-seq tracks were obtained from Holmes et al for 22Rv1 (H3K27ac, MYC and input) and from Augello et al for LNCaP (MYC) cell lines. Orange arrows point to two putative MYC regulatory elements in the ATAD2 promoter region. D) Western blot analysis of ATAD2 expression upon MYC knockdown in human LNCaP and PC-3 cells. The numbers on top of the ATAD2 bands show their expression relative to shControl and are summarized as % inhibition in scatter plots on the right. E) Heatmap summarizing qRT-PCR analysis of MYC, ATAD2 and three well-known MYC targets after MYC knockdown in LNCaP and PC-3 cells. Color scale depicts fold change downregulation compared to shControl. Only significant changes are colored (P<0.05 using one-way ANOVA adjusted for multiple comparisons with Dunnett’s test compared to shControl).
Figure 3:
Figure 3:. ATAD2 knockdown impairs proliferation of prostate cancer cells.
A) Colony formation assays of LNCaP and PC-3 human cell lines after knockdown of ATAD2, stained with crystal violet. Asterisks denote P values for one-way ANOVA with Dunnett’s multiple comparisons test, n=3 technical replicates. **: P<0.001, ****:P<0.0001. B) Intratibial growth assays of PC-3 cells labeled with GFP-Luciferase (2 replicate experiments, n=5 each). Representative IVIS bioluminescence images of shControl and shATAD2 tumors after intratibial injection, along with tumor growth curves quantified by longitudinal bioluminescence imaging. P-value shown for day 22 was estimated by two-way ANOVA with Sidak’s multiple comparisons against shControl. C) Representative H&E, ATAD2 and MYC IHC staining of intratibial PC-3 grafts treated with shControl or shATAD2. Scale bars represent 200um. Scatter plots on the right show quantification of percent tumor nuclei positive for ATAD2 or MYC, with P values derived from two-tailed unpaired t-test and n= 3.
Figure 4:
Figure 4:. ATAD2 is a driver of prostate cancer metastasis.
A) Schematic of the organ-on-a-chip assay. B) Scatter plots showing invasion into engineered bone of indolent mouse NP cells as well as metastatic NPK cells treated with shControl or shAtad2. Corresponding expression levels of ATAD2 are shown in western blots. P values are for one-way ANOVA with Dunnett’s multiple comparisons test, n=3 technical replicates in duplicate independent experiments. C) Intracardiac assay after ATAD2 knockdown in NPK cells. Scatter plots show the number of ensuing bone (left) and liver (right) metastasis upon shControl or shAtad2 treatment of NPK cells injected intracardially into the circulation of nude mice (P values from two-tailed t test n=23 in three independent experiments). Representative epifluorescence images of bones and livers are shown, where metastases are evident by YFP-fluorescence. The corresponding brightfield image of each organ is shown underneath, with opacity set to 20%. Scale bars represent 0.1cm. Representative H&E, YFP and ATAD2 IHC staining of bone metastases ensuing from intracardiac injection of NPK shControl cells are also shown. Scale bars represent 200um.

References

    1. Siegel RL, Miller KD, Wagle NS, Jemal A. Cancer statistics, 2023. CA Cancer J Clin. 2023;73(1):17–48. doi: 10.3322/caac.21763. - DOI - PubMed
    1. Gandaglia G, Abdollah F, Schiffmann J, Trudeau V, Shariat SF, Kim SP, et al. Distribution of metastatic sites in patients with prostate cancer: A population-based analysis. Prostate. 2014;74(2):210–6. doi: 10.1002/pros.22742. - DOI - PubMed
    1. Saylor PJ, Lee RJ, Smith MR. Emerging therapies to prevent skeletal morbidity in men with prostate cancer. J Clin Oncol. 2011;29(27):3705–14. Epub 2011/08/24. doi: 10.1200/JCO.2010.34.4994. - DOI - PMC - PubMed
    1. Yossepowitch O, Bianco FJ Jr., Eggener SE, Eastham JA, Scher HI, Scardino PT. The natural history of noncastrate metastatic prostate cancer after radical prostatectomy. Eur Urol. 2007;51(4):940–7; discussion 7–8. Epub 20061030. doi: 10.1016/j.eururo.2006.10.045. - DOI - PMC - PubMed
    1. Helgstrand JT, Roder MA, Klemann N, Toft BG, Lichtensztajn DY, Brooks JD, et al. Trends in incidence and 5-year mortality in men with newly diagnosed, metastatic prostate cancer-A population-based analysis of 2 national cohorts. Cancer. 2018;124(14):2931–8. Epub 20180503. doi: 10.1002/cncr.31384. - DOI - PubMed

MeSH terms

Substances

LinkOut - more resources