. 2025 Feb 5;24(2):42.
doi: 10.1007/s12311-025-01796-0.

Functional Characterization of Parallel Fiber-Purkinje Cell Synapses in Two Friedreich's Ataxia Mouse Models

Affiliations

Functional Characterization of Parallel Fiber-Purkinje Cell Synapses in Two Friedreich's Ataxia Mouse Models

Donald J Joseph et al. Cerebellum. .

Abstract

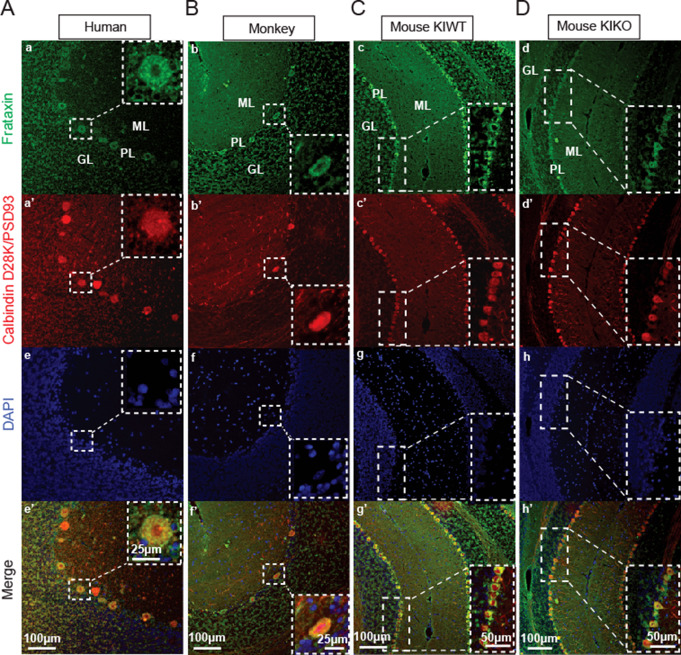
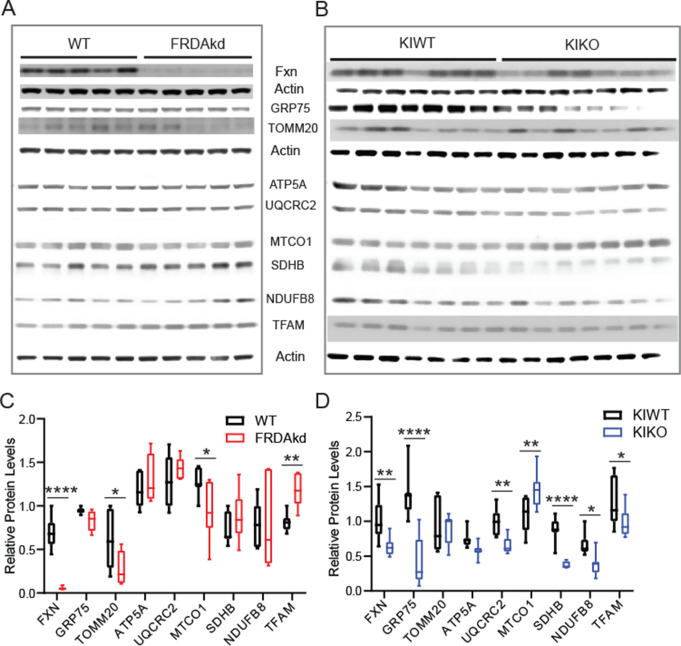
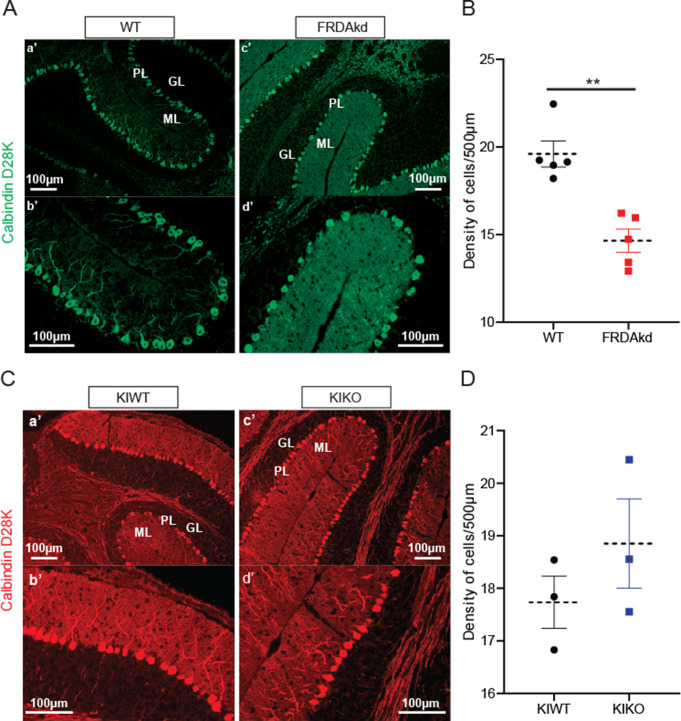
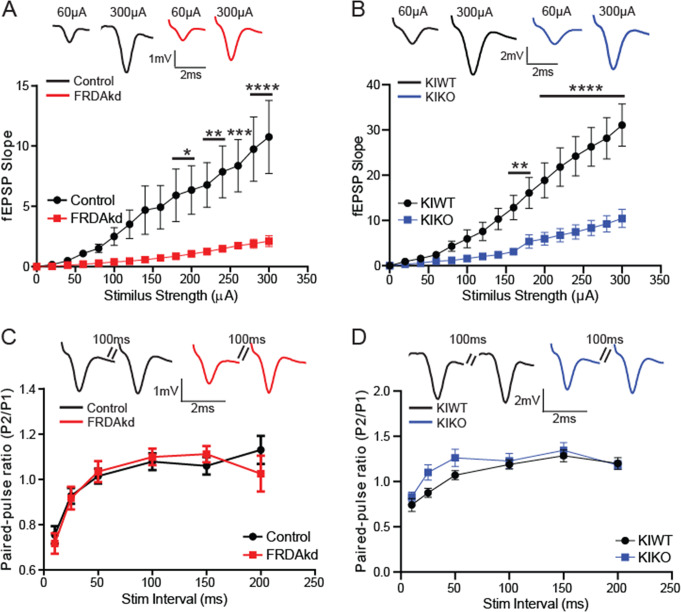
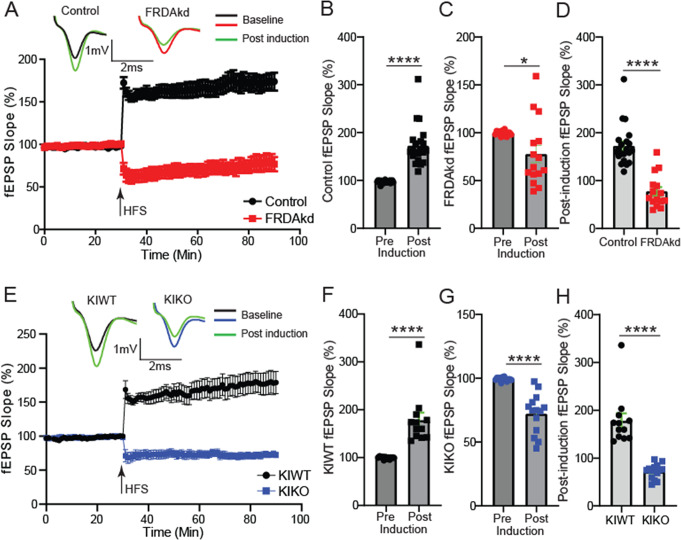
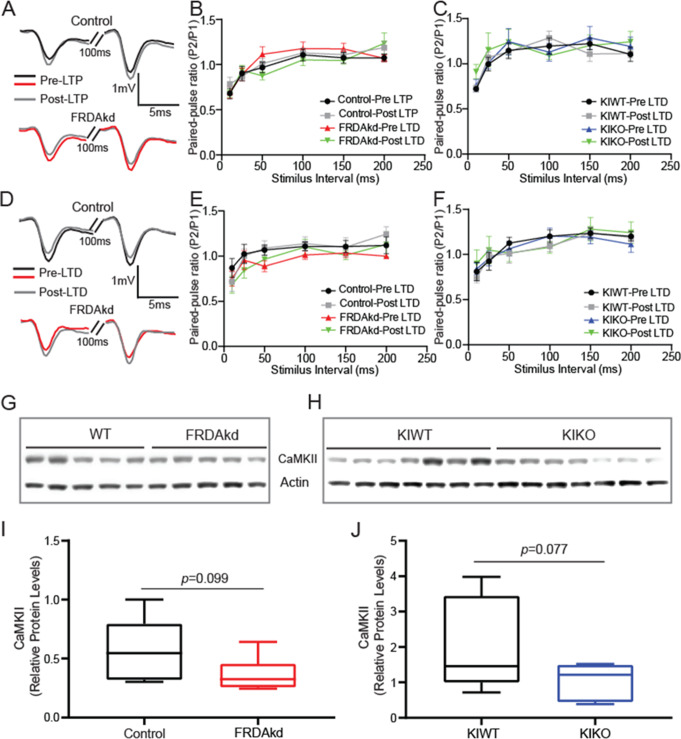
Friedreich ataxia (FRDA) is an autosomal recessive disorder caused by GAA expansions in the FXN gene, which codes for the protein frataxin (FXN). These mutations reduce FXN expression, leading to mitochondrial dysfunction and multisystemic disease. Accumulating evidence suggests that neuronal dysfunction, rather than neuronal death, may drive the neurological phenotypes of FRDA, but the mechanisms underlying such neurological phenotypes remain unclear. To investigate the neural circuit basis of this dysfunction, we employed field recordings to measure Purkinje cell (PC) function and synaptic properties along with western blotting and immunohistochemistry to determine their density and structure in two established FRDA mouse models, the shRNA-frataxin (FRDAkd) and the frataxin knock in-knockout (KIKO) mice. Western blotting demonstrated subtle changes in mitochondrial proteins and only a modest reduction in the density of calbindin positive cells PCs in the cerebellar cortex of the FRDAkd mice, with no change in the density of PCs in the KIKO mice. Though PC density differed slightly in the two models, field recordings of parallel fiber-PC synapses in the molecular layer demonstrated concordant hypo-excitability of basal synaptic transmission and impairments of long-term plasticity using induction protocols associated with both potentiation and depression of synaptic strength. These results indicate that synaptic instability might be a common feature in FRDA mouse models.

Keywords: And Mitochondria; Cerebellum; Frataxin; Friedreich’s ataxia; Long-term plasticity; Synaptic transmission.


Conflict of interest statement

Declarations. Generative AI in Scientific Writing: The authors declare that generative artificial intelligence (AI) and AI-assisted technologies were not used in the writing process of this manuscript. Competing Interests: The authors declare no competing interests.

Figures

Fig. 1
Fig. 1
Frataxin expression in Purkinje cells is conserved across species. Representative micrographs of Human (A), Monkey (B), KIWT (C), and KIKO (D) tissues showing frataxin co-labeling with calbindin D28K or PSD93. (a-d) cerebellar sections stained with frataxin (green) (a’) human stained with PSD93 (red) (b’-d’) monkey and mice sections stained with calbindin D28 (Red) markers of Purkinje cells. (e-h) DAPI shows the presence of other cells in the GL = granule layer and ML = molecular layer. (e’-h’) Merged
Fig. 2
Fig. 2
Mitochondrial proteins levels are dysregulated in the cerebellum of FRDA mice. (A & B) Representative micrograph of Western blot of mitochondrial biogenesis proteins from FRDAkd (A) mice induced for 16 weeks and 16–18 months old KIKO mice (B). (C & D) Quantitative analysis plot of FXN, GRP75, TOMM20, ATP5A, UQCRC2, MTCO1, SDHB, NDUFB8, and TFAM normalized to internal control actin. Data are given as mean ± SEM and analyzed by two-way ANOVA followed by Bonferroni post hoc test. *P < 0.05, **P < 0.01, ***P < 0.001, ****P < 0.0001; WT, FRDAkd: n = 7, 6, F(8, 99) = 5.56; KIWT, KIKO: n = 7 for both, F(8, 108) = 7.90
Fig. 3
Fig. 3
Disparate effect of FXN loss on Cerebellar Purkinje cell density. Representative micrographs of FRDAkd (A) and KIKO (C) in the cerebellum. (a, b) Control mice and FRDAkd (c, d) stained with calbindin D28K; KIWT (a’,b’) and KIKO (c’,d’) with calbindin D28 (red) (B) Quantification of calbindin D28-positive Purkinje neurons in control mice and FRDAkd mice and (D) in KIKO and KIWT mice. Approximately 30 images per mouse were analyzed by a blinded individual. Data are given as mean ± SEM and analyzed by 2-tailed unpaired Student’s t test. **P < 0.01, Control (uninduced FRDAkd), FRDAkd (Induced): n = 5 for both; KIWT, KIKO: n = 3 for both
Fig. 4
Fig. 4
Synaptic transmission at parallel fiber-Purkinje cell synapses is impaired in FRDA mice. (A) I-O relationship of molecular layer fEPSP in control (Uninduced FRDAkd) and induced FRDAkd (16–18 weeks) mice. *P < 0.05, **P < 0.01, ***<0.001, ****P < 0.0001; Control, FRDAKD: n = 20/10, 24/12, slices/mice; F(1, 654) = 93.6. Top traces: Representative waveforms of fEPSP at low and high stimulation amplitudes. (B) I-O relationship of molecular layer fEPSP in KIWT and KIKO mice (16–18 months old). **P < 0.01, ****P < 0.0001; KIWT, KIKO: n = 20/10, 30/15, slices/mice; F(1, 766) = 170.3. Top traces: Representative waveforms of fEPSP at low and high stimulation amplitudes. (C) Short-term plasticity of fEPSP measured at different paired-pulse intervals in control and induced FRDAkd mice. Control, FRDAkd: n = 59/30, 46/23, slices/mice; P > 0.05, F(1, 618) = 0.14. Top traces: Representative waveforms of fEPSP at 100ms paired-pulse interval. (D) Short-term plasticity of fEPSP measured at different paired-pulse intervals in KIWT and KIKO mice. KIWT, KIKO: n = 35/18, 42/21, slices/mice; P > 0.05, F(1, 450) = 5.72). Top traces: Representative waveforms of fEPSP at 100ms paired-pulse interval. Data are given as mean ± SEM and analyzed by Two-way ANOVA followed by Sidak post hoc test. I-O relationships were constructed by increasing stimulus intensity from 0-300µA in 20µA increment
Fig. 5
Fig. 5
Concordant impairments of LTP in FRDAkd and KIKO mice. (A) Time course of Parallel fiber-Purkinje cell synapse fEPSP slope 30 min before and 60 min after a train of high frequency stimulation LTP protocol in control and FRDAkd mice. Top traces: representative traces of fEPSP recorded at baseline and after LTP induction. (B, C) Histograms of percent changes in fEPSP following LTP induction in control (B) and FRDAkd (C) mice relative to baseline. (D) Comparative analysis of percent change in post-induction fEPSP magnitude between control and FRDAkd mice. (E) Time course of Parallel fiber-Purkinje cell synapse fEPSP slope 30 min before and 60 min after the train of high frequency stimulation LTP protocol in KIWT and KIKO mice. Top traces: representative traces of fEPSP recorded at baseline and after LTP induction. (F, G) Histograms of percent changes in fEPSP following LTP induction in KIWT (F) and KIKO (G) mice relative to baseline. (H) Comparative analysis of percent change in post-induction fEPSP magnitude between KIWT and KIKO mice. The last 10 min of baseline and/or post-induction timelines were used for all comparative analyses. *P < 0.05, ****P < 0.0001; Control, FRDAKD: n = 21/21, 15/15, slices/mice; KIWT, KIKO: n = 12/12, 14/14, slices/mice. Data are given as mean ± SEM and analyzed by the 2-tailed unpaired Student’s t tests
Fig. 6
Fig. 6
FRDA mice display similar impairments in AMPAR-dependent LTD. (A) Time course of Parallel fiber-Purkinje cell synapse fEPSP slope 30 min before and 60 min after a train of paired stimuli of 50ms interval delivered at 1 Hz for 15 min in control and FRDAkd mice. Top traces: representative traces of fEPSP recorded at baseline and after LTD induction. (B, C) Histograms of percent changes in fEPSP following LTD induction in control (B) and FRDAkd (C) mice relative to baseline. (D) Comparative analysis of percent change in post-induction fEPSP magnitude between control and FRDAkd mice. (E) Time course of Parallel fiber-Purkinje cell synapse fEPSP slope 30 min before and 60 min after the train of low frequency 50ms paired stimulation protocol in KIWT and KIKO mice. Top traces: representative traces of fEPSP recorded at baseline and after LTD induction. (F, G) Histograms of percent changes in fEPSP following LTD induction in KIWT (F) and KIKO (G) mice relative to baseline. (H) Comparative analysis of percent change in post-induction fEPSP magnitude between KIWT and KIKO mice. The last 10 min of baseline and/or post-induction timelines were used for all comparative analyses. *P < 0.05, ***P < 0.001, ****P < 0.0001; Control, FRDAkd: n = 15/15, 12/12, slices/mice; KIWT, KIKO: n = 9/9, 11/11, slices/mice. Data are given as mean ± SEM and analyzed by the 2-tailed unpaired Student’s t tests
Fig. 7
Fig. 7
Postsynaptic localization of synaptic plasticity defects and preservation of CaMKII expression levels. (A) Example traces of paired fEPSPs before and after LTP induction in control (Top) and FRDAkd (Bottom) mice at 100ms stimulation intervals. (B) Paired-pulse ratio (fEPSP2/fEPSP1) measured at different intervals before and after LTP induction in control and FRDAkd mice. (C) Paired-pulse ratio (fEPSP2/fEPSP1) measured at different intervals before and after LTP induction in KIWT and KIKO mice. (D) Example traces of paired fEPSPs before and after LTD induction in control (Top) and FRDAkd (Bottom) mice at 100ms stimulation intervals. (E) Paired-pulse ratio (fEPSP2/fEPSP1) measured at different intervals before and after LTD induction in control and FRDAkd mice. (F) Paired-pulse ratio (fEPSP2/fEPSP1) measured at different intervals before and after LTD induction in KIWT and KIKO mice. For pre- and post-LTP PPR: Control, FRDAKD: n = 17/17, 15/15, slices/mice; KIWT, KIKO: n = 12/12, 14/14, slices/mice. For pre- and post-LTD PPR: Control, FRDAkd: n = 14/14, 12/12, slices/mice; KIWT, KIKO: n = 9/9, 11/11, slices/mice. (G, H) Representative micrograph of Western blot of CaMKII expression in FRDAkd (G) and KIKO (H). (I, J) Quantitative analysis plot of CaMKII levels in FRDAkd (I) and KIKO (J) mice normalized to internal control actin. Data are given as mean ± SEM and analyzed by analyzed by Two-way ANOVA (PPR data) or by the 2-tailed unpaired Student’s t tests (Western blotting data)
Fig. 8
Fig. 8
FRDA mice display similar impairments in NMDA-dependent LTD. (A) Time course of Parallel fiber-Purkinje cell synapse fEPSP slope 30 min before and 60 min after a train of paired stimuli of 200ms interval delivered at 1 Hz for 15 min in control and FRDAkd mice. Top traces: representative traces of fEPSP recorded at baseline and after LTD induction. (B, C) Histograms of percent changes in fEPSP following LTD induction in control (B) and FRDAkd (C) mice relative to baseline. (D) Comparative analysis of percent change in post-induction fEPSP magnitude between control and FRDAkd mice. (E) Time course of Parallel fiber-Purkinje cell synapse fEPSP slope 30 min before and 60 min after the train of low frequency 200ms paired stimulation protocol in KIWT and KIKO mice. Top traces: representative traces of fEPSP recorded at baseline and after LTD induction. (F, G) Histograms of percent changes in fEPSP following LTD induction in KIWT (F) and KIKO (G) mice relative to baseline. (H) Comparative analysis of percent change in post-induction fEPSP magnitude between KIWT and KIKO mice. The last 10 min of baseline and/or post-induction timelines were used for all comparative analyses. *P < 0.05, **P < 0.01, ****P < 0.0001; Control, FRDAkd: n = 18/18, 11/11, slices/mice; KIWT, KIKO: n = 9/9, 8/8, slices/mice, slices/mice. Data are given as mean ± SEM and analyzed by analyzed by the 2-tailed unpaired Student’s t test

References

    1. Koeppen AH, Mazurkiewicz JE. Friedreich ataxia: neuropathology revised. J Neuropathol Exp Neurol. 2013;72:78–90. 10.1097/NEN.0b013e31827e5762. - PMC - PubMed
    1. Campuzano V, Montermini L, Molto MD, Pianese L, Cossee M, Cavalcanti F, Monros E, Rodius F, Duclos F, Monticelli A, Zara F, Canizares J, Koutnikova H, Bidichandani SI, Gellera C, Brice A, Trouillas P, De Michele G, Filla A, De Frutos R, Palau F, Patel PI, Di Donato S, Mandel JL, Cocozza S, Koenig M, Pandolfo M. Friedreich’s ataxia: autosomal recessive disease caused by an intronic GAA triplet repeat expansion. Science. 1996;271:1423–7. 10.1126/science.271.5254.1423. - PubMed
    1. Pandolfo P M. Friedreich ataxia: the clinical picture. J Neurol. 2009;256(Suppl 1):3–8. 10.1007/s00415-009-1002-3. - PubMed
    1. Campuzano V, Montermini L, Lutz Y, Cova L, Hindelang C, Jiralerspong S, Trottier Y, Kish SJ, Faucheux B, Trouillas P, Authier FJ, Durr A, Mandel JL, Vescovi A, Pandolfo M, Koenig M. Frataxin is reduced in Friedreich ataxia patients and is associated with mitochondrial membranes. Hum Mol Genet. 1997;6:1771–80. 10.1093/hmg/6.11.1771. - PubMed
    1. Guillon B, Bulteau AL, Wattenhofer-Donze M, Schmucker S, Friguet B, Puccio H, Drapier JC, Bouton C. Frataxin deficiency causes upregulation of mitochondrial lon and ClpP proteases and severe loss of mitochondrial Fe-S proteins. FEBS J. 2009;276:1036–47. 10.1111/j.1742-4658.2008.06847.x. - PubMed

LinkOut - more resources