. 2025 Feb 5:12:RP88334.
doi: 10.7554/eLife.88334.

Deterministic genetic barcoding for multiplexed behavioral and single-cell transcriptomic studies

Affiliations

Deterministic genetic barcoding for multiplexed behavioral and single-cell transcriptomic studies

Jorge Blanco Mendana et al. Elife. .

Abstract

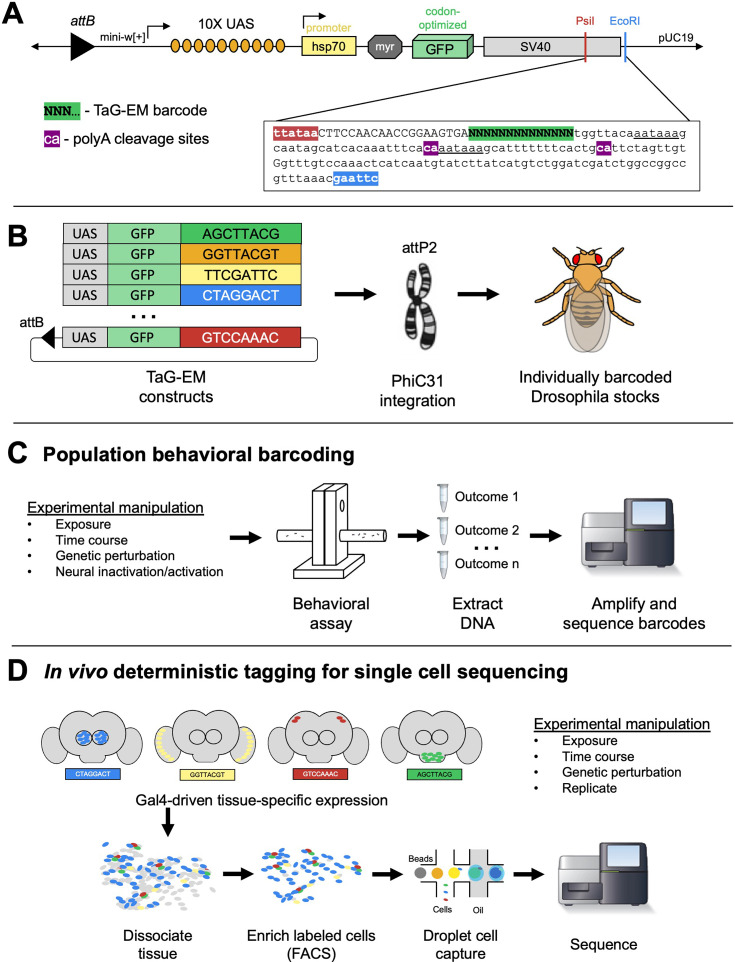
Advances in single-cell sequencing technologies have provided novel insights into the dynamics of gene expression and cellular heterogeneity within tissues and have enabled the construction of transcriptomic cell atlases. However, linking anatomical information to transcriptomic data and positively identifying the cell types that correspond to gene expression clusters in single-cell sequencing data sets remains a challenge. We describe a straightforward genetic barcoding approach that takes advantage of the powerful genetic tools in Drosophila to allow in vivo tagging of defined cell populations. This method, called Targeted Genetically-Encoded Multiplexing (TaG-EM), involves inserting a DNA barcode just upstream of the polyadenylation site in a Gal4-inducible UAS-GFP construct so that the barcode sequence can be read out during single-cell sequencing, labeling a cell population of interest. By creating many such independently barcoded fly strains, TaG-EM enables positive identification of cell types in cell atlas projects, identification of multiplet droplets, and barcoding of experimental timepoints, conditions, and replicates. Furthermore, we demonstrate that TaG-EM barcodes can be read out using next-generation sequencing to facilitate population-scale behavioral measurements. Thus, TaG-EM has the potential to enable large-scale behavioral screens in addition to improving the ability to multiplex and reliably annotate single-cell transcriptomic experiments.

Keywords: D. melanogaster; behavior; genetic barcoding; genetics; genomics; next-generation sequencing; single-cell transcriptomics.

Plain language summary

From delivery to shipping or shopping, barcodes are a part of everyday life. In biological research as well, ‘barcoding’ cells and organisms using specific DNA sequences has been a transformative approach. Such tags can be introduced into the genetic material of cells, allowing scientists to label cell populations or individuals of interest. Here, Mendana et al. investigated how DNA barcoding could be used to cut down the time and cost required to pinpoint a certain population of cells, or of organisms, within a larger group. At present, such efforts often remain labor intensive and costly. For instance, it is now possible for researchers to capture all the genes that are switched on at any given time in individual cells in an organism; however, it is still difficult to then identify which tissue or population of interest a particular cell belongs to. In response, Mendana et al. established a new approach in fruit flies, called TaG-EM, which makes it possible to bypass these limitations by introducing a carefully designed genetic barcode, easily read by DNA sequencers, into the genome of the fly. Further experiments also demonstrated that TaG-EM was valuable at the scale of an organism, to be used in behavioral experiments. Typically, researchers examine how various strains of animals respond to different conditions by testing each group separately; Mendana et al. were able to show that ‘barcoding’ the flies using TaG-EM made it possible to pool these behavioral measurements, as the different groups could then be later quickly identified using their genetic tags. Overall, this new approach should allow researchers using fruit flies to investigate questions around gene expression and behavior in a faster and cheaper way, improving our understanding of a range of biological processes.


Conflict of interest statement

JB, MD, LO, BA, JG, DG No competing interests declared

Figures

Figure 1.
Figure 1.. Overview of TaG-EM system.
(A) Detailed view of the 3’ UTR of the TaG-EM constructs showing the position of the 14 bp barcode sequence (green highlight) relative to the polyadenylation signal sequences (underlined) and poly-A cleavage sites (purple highlights). The pJFRC12 backbone schematic is modified with permission from an unpublished schematic made by Barret Pfeiffer. (B) Schematic illustrating the design of the TaG-EM constructs, where a barcode sequence is inserted in the 3’ UTR of a UAS-GFP construct and inserted in a specific genomic locus using PhiC31 integrase. (C) Use of TaG-EM barcodes for sequencing-based population behavioral assays. (D) Use of TaG-EM barcodes expressed with tissue-specific Gal4 drivers to label cell populations in vivo upstream of cell isolation and single-cell sequencing.
Figure 1—figure supplement 1.
Figure 1—figure supplement 1.. Sanger sequencing identification of TaG-EM barcode lines.
(A) Summary of barcode pool injections. Barcode sequence and transgenic vial identifier in which the barcode was identified are shown. (B) Sanger sequencing-based confirmation of the barcode sequence and PCR handle in TaG-EM transgenic lines. Because the TaG-EM barcode constructs were injected as a pool of 29 purified plasmids, some of the transgenic lines had inserts of the same construct. In total 20 unique lines were recovered from this round of injection.
Figure 2.
Figure 2.. Structured pool tests.
(A) Overview of the construction of the structured pools for assessing the quantitative accuracy of TaG-EM barcode measurements. Male and female even pools were constructed and extracted in triplicate. The table shows the number of flies that were pooled for each experimental condition. (B) Barcode abundance data for three independent replicates of the female even pool. (C) Barcode abundance data for three independent replicates of the male even pool. (D) Barcode abundance data for the female staggered pool. Inset plot shows the average observed barcode abundance among lines pooled at each level compared to the expected abundance. (E) Barcode abundance data for the male staggered pool. Inset plot shows the average observed barcode abundance among lines pooled at each level compared to the expected abundance. For all plots, bars indicate the mean barcode abundance for three technical replicates of each pool, error bars are +/-S.E.M.
Figure 2—figure supplement 1.
Figure 2—figure supplement 1.. Optimization of TaG-EM barcode amplification.
(A) Gels showing bands produced when amplifying TaG-EM flies or a wild type control with the indicated polymerase, annealing temperature, and primer pair (short = B2_3'F1_Nextera/ SV40_pre_R_Nextera; long = B2_3'F1_Nextera/ SV40_post_R_Nextera). The leftmost lanes correspond to the 1 kb Plus DNA ladder (Invitrogen). (B–E) Mean error (R.M.S.D. root mean squared deviation from expected value) for even pool amplified with the indicated primer set, input amount, and cycle number using KAPA HiFi polymerase (n=3, error bars are +/-S.E.M.). (F–G) Mean error (R.M.S.D. root mean squared deviation from expected value) for staggered pool amplified with the indicated primer set, input amount, and cycle number using KAPA HiFi polymerase (n=3 technical replicates, error bars are +/-S.E.M.).
Figure 2—figure supplement 2.
Figure 2—figure supplement 2.. Coefficient of variation for TaG-EM structured pools.
Plot showing coefficient of variation for different groups of TaG-EM barcodes in the structured pools. Dashed line indicates the mean coefficient of variation across all conditions.
Figure 3.
Figure 3.. TaG-EM barcode-based behavioral measurements.
(A) TaG-EM barcode lines in either a wild-type or norpA background were pooled and tested in a phototaxis assay. After 30 s of light exposure, flies in tubes facing the light or dark side of the chamber were collected, DNA was extracted, and TaG-EM barcodes were amplified and sequenced. Barcode abundance values were scaled to the number of flies in each tube and used to calculate a preference index (P.I.). Average P.I. values for four different TaG-EM barcode lines in both the wild-type and norpA backgrounds are shown (n=3 biological replicates, error bars are +/-S.E.M.). (B) The same eight lines used for the sequencing-based TaG-EM barcode measurements were independently tested in the phototaxis assay and manually scored videos were used to calculate a P.I. for each genotype. Average P.I. values for each line are shown (n=3 biological replicates, error bars are +/-S.E.M.) for TaG-EM-based quantification (top) and manual video-based quantification (bottom). (C) Flies carrying different TaG-EM barcodes were collected and aged for 1 to 4 weeks and then eggs were collected, and egg number and viability was manually scored for each line. In parallel, the barcoded flies from each timepoint were pooled, and eggs were collected, aged, and DNA was extracted, followed by TaG-EM barcode amplification and sequencing. Average number of viable eggs per female (manual counts) and average barcode abundance are shown both as a bar plot and scatter plot (n=3 biological replicates for 3 barcodes per condition, error bars are +/-S.E.M.).
Figure 3—figure supplement 1.
Figure 3—figure supplement 1.. Oviposition tests with TaG-EM barcode lines.
Plots showing mean TaG-EM barcode abundance for adult females used in oviposition experiments (top) and eggs collected from these females (bottom). Data from two independent trials is shown (n=3 biological replicates for each trial, error bars are +/-S.E.M.). Dashed lines indicate the expected abundance values.
Figure 3—figure supplement 2.
Figure 3—figure supplement 2.. Fecundity data for individual TaG-EM lines.
Manually collected data for mean number of viable eggs per female, barcode abundance data, and barcode abundance data normalized to adult fly barcode data for each of the TaG-EM barcode lines used in the age-dependent fecundity experiment. Scatterplots show correlations between manually collected data and barcode sequencing results. Data from two independent trials is shown (n=3 biological replicates for each trial, error bars are +/-S.E.M.).
Figure 3—figure supplement 3.
Figure 3—figure supplement 3.. Average age-dependent fecundity data for Trial 1.
Average number of viable eggs per female (manual counts) and average barcode abundance are shown both as a bar plot and scatter plot (n=3 biological replicates for 3 barcodes per condition, error bars are +/-S.E.M.). Data from Trial 2 is shown in Figure 3C.
Figure 4.
Figure 4.. TaG-EM barcode-based quantification of larval gut motility.
Schematics depicting (A) manual and (B) TaG-EM-based assays for quantifying food transit time in Drosophila larvae. (C) Transit time of a food bolus in the presence and absence of caffeine measured using the manual assay (p=0.0340). (D) Transit time of a food bolus in the presence and absence of caffeine measured using the TaG-EM assay (p=0.0488). n=3 biological replicates for each condition. A modified Chi-squared method was used for statistical testing (Hristova and Wimley, 2023).
Figure 4—figure supplement 1.
Figure 4—figure supplement 1.. Larval gut motility assay parameters.
(A) Images of larvae fed with blue-dyed yeast agar. (B) Effect of dye concentration on food transit time. (C) Effect of starvation time on feeding and uptake of the dyed food bolus (n=3 biological replicates for each trial, error bars are +/-S.E.M.). (D) Effect of liquid versus solid diet on food transit time. (E) Aversive effect of caffeine on food bolus uptake (n=2 biological replicates for each trial, error bars are +/-S.E.M.).
Figure 4—figure supplement 2.
Figure 4—figure supplement 2.. Cost comparisons for manual and TaG-EM gut motility assays.
(A) Cost per data point as a function of the number of data points generated and the number of experimental conditions screened. (B) Overall experiment cost and (C) labor effort as a function of the number of data points generated and the number of experimental conditions screened.
Figure 5.
Figure 5.. Gal4-driven expression of GFP from TaG-EM lines.
(A) Comparison of endogenous GFP expression and GFP antibody staining in the wing imaginal disc for the original pJFRC12 construct inserted in the attP2 landing site or for a TaG-EM barcode line driven by dpp-Gal4. Wing discs are counterstained with DAPI. (B) Endogenous expression of GFP from either a TaG-EM barcode construct (left column), a hexameric GFP construct (middle column), or a line carrying both a TaG-EM barcode construct and a hexameric GFP construct (right column) driven by the indicated gut driver line (PMG-Gal4: Pan-midgut driver; EC-Gal4: Enterocyte driver; EE-Gal4: Enteroendocrine driver; EB-Gal4: Enteroblast driver).
Figure 5—figure supplement 1.
Figure 5—figure supplement 1.. Expression driven by dpp-Gal4 for 20 TaG-EM lines.
GFP antibody staining in the wing imaginal disc for the indicated TaG-EM barcode line driven by dpp-Gal4. Wing discs are counterstained with DAPI.
Figure 5—figure supplement 2.
Figure 5—figure supplement 2.. TaG-EM line GFP expression driven by different Gal4 drivers.
(A) Comparison of endogenous GFP expression in larvae for the original pJFRC12 construct inserted in the attP2 landing site (left) or for a TaG-EM barcode line (right) expressed under the control of the indicated driver line. (B) GFP expression of the PC-Gal (Precursor-Gal4) driver line together with either UAS-2xGFP or a combination of UAS-2xGFP and a TaG-EM barcode line.
Figure 6.
Figure 6.. Expression of TaG-EM genetic barcodes in larval intestinal cell types.
(A) UMAP plot of Drosophila larval gut cell types. (B) Annotation of cells associated with a TaG-EM barcode across all 8 multiplexed experimental conditions using data from the gene expression library and an enriched TaG-EM barcode library. (C) Annotated enteroblast cells. (D) Presence of TaG-EM barcode (BC6) driven by the EB-Gal4 line using data from the gene expression library and an enriched TaG-EM barcode library. Gene expression levels of enteroblast marker genes (E) esg, (F) klu. (G) Annotated enterocyte cells. (H) Presence of TaG-EM barcode (BC4) driven by the EC-Gal4 line using data from the gene expression library and an enriched TaG-EM barcode library. Gene expression levels of enterocyte marker genes (I) betaTry, (J) Jon99Ciii. (K) Annotated enteroendocrine cells. (L) Presence of TaG-EM barcode (BC9) driven by the EE-Gal4 line using data from the gene expression library and an enriched TaG-EM barcode library. Gene expression levels of enteroendocrine cell marker genes (M) Dh31, (N) IA-2.
Figure 6—figure supplement 1.
Figure 6—figure supplement 1.. Dissociated intestinal cell viability.
(A) GFP expression visualized in dissociated cells from gut driver lines crossed to hexameric GFP and TaG-EM line. (B) Proportion of live (left) and dead (right) cells post-isolation and flow sorting as assessed by GFP expression and propidium iodide staining.
Figure 6—figure supplement 2.
Figure 6—figure supplement 2.. BD FACSDiva 8.0.1 gating for sorted cells.
(A) GFP gating created by analyzing a pool of GFP positive and negative cells. (B) Flow gating for Drosophila gut cells with TaG-EM GFP expression driven in intestinal precursor cells (PC-Gal4) and enterocytes (EC-Gal4).
Figure 6—figure supplement 3.
Figure 6—figure supplement 3.. Expression of TaG-EM genetic barcodes in larval intestinal precursor cells.
UMAP plots showing gene expression levels of (A) enteroblast/ISC marker genes esg, klu, and E(spl)mbeta-HLH; and (B) the TaG-EM barcodes 7, 8, and 9 driven by the PC-Gal4 line.
Figure 6—figure supplement 4.
Figure 6—figure supplement 4.. BD FACSDiva 8.0.1 gating for sorted cells.
(A) Dead cell gating created by staining sample with propidium iodine (PI). (B) Flow gating for Drosophila gut cells with TaG-EM and hexameric GFP expression driven by the pan-midgut, enteroblast, enterocyte, enteroendocrine, and precursor cell drivers.
Figure 6—figure supplement 5.
Figure 6—figure supplement 5.. TaG-EM-based doublet identification.
UMAP plots pre-doublet removal showing (A) doublets uniquely identified by DoubletFinder, (B) all doublets identified by DoubletFinder, (C) doublets uniquely identified by TaG-EM barcodes, (D) all doublets identified by TaG-EM barcodes, (E) doublets mutually found by TaG-EM and DoubletFinder, (F) Venn diagram of overlap between doublets identified by TaG-EM and DoubletFinder.
Figure 6—figure supplement 6.
Figure 6—figure supplement 6.. Clustering and automated annotation.
(A) UMAP plots clustered at different resolutions. (B) Clustree analysis of the effect of clustering resolution. (C) Automated cell type annotation using data from the Fly Cell Atlas.
Figure 6—figure supplement 7.
Figure 6—figure supplement 7.. Expression of TaG-EM genetic barcodes in larval intestinal cell types.
(A) UMAP plot of Drosophila larval gut cell types. (B) Annotation of cells associated with a TaG-EM barcode across all eight multiplexed experimental conditions using data from the gene expression library only. (C) Annotated enteroblast cells. (D) Expression level of TaG-EM barcode (BC6) driven by the EB-Gal4 line using data from the gene expression library only. Gene expression levels of enteroblast marker genes (E) esg, (F) klu. (G) Annotated enterocyte cells. (H) Expression level of TaG-EM barcode (BC4) driven by the EC-Gal4 line using data from the gene expression library only. Gene expression levels of enterocyte marker genes (I) betaTry, (J) Jon99Ciii. (K) Annotated enteroendocrine cells. (L) Expression level of TaG-EM barcode (BC9) driven by the EE-Gal4 line using data from the gene expression library only. Gene expression levels of enteroendocrine cell marker genes (M) Dh31, (N) IA-2.
Figure 6—figure supplement 8.
Figure 6—figure supplement 8.. Optimizing amplification of the TaG-EM barcode library.
(A) Workflow for single-cell capture; cDNA amplification with added spike-in primer for TaG-EM library followed by a SPRI size-selection clean-up, then PCR(s) to create library for sequencing. (B) Spike-in primers and amplification primers used to enrich TaG-EM barcodes. Table summarizes different protocols tested to amplify the TaG-EM barcodes and create an enriched sequencing library. (C) Percent of on-target reads for each enriched TaG-EM barcode library.
Figure 6—figure supplement 9.
Figure 6—figure supplement 9.. Performance of the enriched TaG-EM barcode library.
(A) Proportion of cells with at least one barcode read assigned as a function of read depth for the enriched TaG-EM barcode library. Dashed line indicated percentage of cells with TaG-EM barcodes detected in the gene expression library (B) Number of unique UMIs observed as a function of read depth. (C) Correlation between barcodes detected in the gene expression (GEX) library and the enriched TaG-EM barcode library as a function of the purity of TaG-EM barcode assignment to the corresponding cell barcode. Dashed line indicates the threshold used for TaG-EM barcode calling in the enriched TaG-EM barcode library.
Figure 6—figure supplement 10.
Figure 6—figure supplement 10.. Expression of the PMG-Gal4-driven TaG-EM barcodes.
UMAP plots showing expression of the four PMG-Gal4 driven TaG-EM barcodes (BC1, BC2, BC3, and BC7) either (A) in aggregate or (B) individually.
Figure 6—figure supplement 11.
Figure 6—figure supplement 11.. Characterization of Gal4 line expression in the larval gut.
(A) Confocal images of third instar midguts showing Gal4-driven fluorophore expression (GFP or mCherry) and comparison with immunostainings of the gut cell markers Prospero (enteroendocrine), Pdm1 (enterocyte) and Esg-GFP (progenitor cell). For each image, Z projections of the stacks recorded along the length of the midgut were manually stitched together. (B) Representative single frames confocal images of a small region of the midgut showing immunostainings of the different gut cell markers and the Gal4-driven fluorophores. Quantification of overlapping and non-overlapping expression between the Gal4-driver fluorophore expression and the cell type marker in the anterior (A), middle (M), and posterior (P) regions for (C) enteroendocrine cells (EC-Gal4), (D) enterocytes (EC-Gal4), (E) precursor cells (PC-Gal4). Five specimens for each Gal4 line were examined. In the case of the enterocyte-specific driver, only anterior and middle regions were analyzed since the driver is largely inactive in the posterior part of the midgut.
Author response image 1.

Update of

  • doi: 10.1101/2023.03.29.534817
  • doi: 10.7554/eLife.88334.1
  • doi: 10.7554/eLife.88334.2

Similar articles

References

    1. Alegria AD, Joshi AS, Mendana JB, Khosla K, Smith KT, Auch B, Donovan M, Bischof J, Gohl DM, Kodandaramaiah SB. High-throughput genetic manipulation of multicellular organisms using a machine-vision guided embryonic microinjection robot. Genetics. 2024;226:iyae025. doi: 10.1093/genetics/iyae025. - DOI - PMC - PubMed
    1. Aran D, Looney AP, Liu L, Wu E, Fong V, Hsu A, Chak S, Naikawadi RP, Wolters PJ, Abate AR, Butte AJ, Bhattacharya M. Reference-based analysis of lung single-cell sequencing reveals a transitional profibrotic macrophage. Nature Immunology. 2019;20:163–172. doi: 10.1038/s41590-018-0276-y. - DOI - PMC - PubMed
    1. Ariyapala IS, Holsopple JM, Popodi EM, Hartwick DG, Kahsai L, Cook KR, Sokol NS. Identification of split-GAL4 drivers and enhancers that allow regional cell type manipulations of the Drosophila melanogaster intestine. Genetics. 2020;216:891–903. doi: 10.1534/genetics.120.303625. - DOI - PMC - PubMed
    1. Asnicar F, Leeming ER, Dimidi E, Mazidi M, Franks PW, Al Khatib H, Valdes AM, Davies R, Bakker E, Francis L, Chan A, Gibson R, Hadjigeorgiou G, Wolf J, Spector TD, Segata N, Berry SE. Blue poo: impact of gut transit time on the gut microbiome using a novel marker. Gut. 2021;70:1665–1674. doi: 10.1136/gutjnl-2020-323877. - DOI - PMC - PubMed
    1. Aso Y, Hattori D, Yu Y, Johnston RM, Iyer NA, Ngo TTB, Dionne H, Abbott LF, Axel R, Tanimoto H, Rubin GM. The neuronal architecture of the mushroom body provides a logic for associative learning. eLife. 2014;3:e04577. doi: 10.7554/eLife.04577. - DOI - PMC - PubMed

MeSH terms

LinkOut - more resources