. 2025 Feb 11;122(6):e2421737122.
doi: 10.1073/pnas.2421737122. Epub 2025 Feb 5.

Microtubule inner proteins of Plasmodium are essential for transmission of malaria parasites

Affiliations

Microtubule inner proteins of Plasmodium are essential for transmission of malaria parasites

Franziska Hentzschel et al. Proc Natl Acad Sci U S A. .

Abstract

Microtubule inner proteins (MIPs) are microtubule-associated proteins that bind to tubulin from the luminal side. MIPs can be found in axonemes to stabilize flagellar beat or within cytoplasmic microtubules. Plasmodium spp. are the causative agents of malaria that feature different parasite forms across a complex life cycle with both unique and divergent microtubule-based arrays. Here, we investigate four MIPs in a rodent malaria parasite for their role in transmission to and from the mosquito. We show by single and double gene deletions that SPM1 and TrxL1, MIPs associated with subpellicular microtubules, are dispensable for transmission from the vertebrate host to the mosquito and back. In contrast, FAP20 and FAP52, MIPs associated with the axonemes of gametes, are essential for transmission to mosquitoes but only if both genes are deleted. In the absence of both FAP20 and FAP52, the B-tubule of the axoneme partly detaches from the A-tubule, resulting in the deficiency of axonemal beating and hence gamete formation and egress. Our data suggest that a high level of redundancy ensures microtubule stability in the transmissive stages of Plasmodium, which is important for parasite transmission.

Keywords: Plasmodium; malaria transmission; microtubule inner proteins.


Conflict of interest statement

Competing interests statement:The authors declare no competing interest.

Figures

Fig. 1.
Fig. 1.
Plasmodium relies on different types of microtubules for life cycle progression. (A) Plasmodium life cycle. Forms that possess spMTs are highlighted in light blue, and forms that possess axonemal MTs are highlighted in red. Note that P. berghei and P. falciparum form differently shaped gametocytes with only P. falciparum gametocytes containing spMTs. (B) Schematic of representative P. berghei forms containing spMTs (blue box) or axonemal MTs (male gamete). spMTs are shown in green, axonemal MTs in magenta, nucleus in purple, apical polar ring in blue, and IMC in orange. To allow for better visibility, not all MTs are shown. (C) Close-up on spMTs with predicted localization of SPM1 and TrxL1 (based on ref. 21) and axonemal MTs with predicted localization of FAP20 and FAP52 (based on refs. , , , and 18).
Fig. 2.
Fig. 2.
Depletion of spm1 and trxL1 does not affect parasite life cycle progression. (A) Asexual blood stage growth rate as calculated after injecting mice with one iRBC intravenously. PbANKA WT growth rates determined and previously published by our laboratory (–45) are plotted as reference. Each dot represents growth rate derived from one mouse. The line indicates median. (B) U-ExM of ookinetes stained for tubulin. Note that the anti-tubulin staining stains for both subpellicular and spindle microtubules (highlighted with black arrowheads). The apical end is indicated with an asterisk. (Scale bar: 10 µm.) (C) Oocyst counts per infected midgut. Pooled data from two cage feeds, each dot representing one midgut. The black line indicates median. Mean infection rates are indicated above the graph. Gray numbers indicate the total number of midguts analyzed per line, individual midguts per replicate: PbA WT: 32/64, spm1(−): 40/55, trxL1(−): 30/33, trxL1(−)/spm1(−)ns: 53/59. Kruskal–Wallis with Dunn’s multiple comparisons test. (D) Salivary gland and midgut sporozoite counts and ratio. Ratios of salivary gland/midgut sporozoites are depicted at the top. Corresponding counts from one infection are indicated by same symbol filling. (E) Gliding motility patterns of salivary gland sporozoites. Each bar represents an independent replicate. Statistics: multiple Fisher’s exact tests comparing absolute counts of moving (productive, partial movers and mixed) versus non moving (not motile and floating) sporozoites (numbers pooled over all replicates), adjusted for multiple testing according to Bonferroni–Holm. Gray numbers show total numbers of sporozoites analyzed per line, individual replicates for replicate 1 to 3: PbA WT: 91/51/212, spm1(−): 145/204/232, trxL1(−): 60/105/160, trxL1(−)/spm1(−)ns: 185/241/300. (F) Speed of productively moving salivary gland sporozoites. Kruskal–Wallis with Dunn’s multiple comparisons test. Gray numbers indicate the total number of sporozoites analyzed per line, individual numbers per replicate: PbA WT: 6/36/49, spm1(−): 21/20/66, trxL1(−): 10/21/27, trxL1(−)/spm1(−)ns: 22/21/55. (G and H) Parasitemia after infection with (G) 1,000 sporozoites intravenously or (H) natural transmission by bite. Numbers (†/n) indicate blood-stage positive mice vs. total mice.
Fig. 3.
Fig. 3.
Depletion of both fap20 and fap52 prevents productive mosquito infection. (A) Parasitemia and (B) gametocyte rate 3 d after infecting mice with two million iRBC intravenously of the indicated parasite lines. (C) Exflagellation per field of view (FOV) of the indicated parasite lines. (D) Ookinete conversion rate in % of all red fluorescent parasites (i.e. females, gametocytes, ookinetes). (E) Oocyst counts per midgut. Pooled data from three to four cage feeds, each dot representing one midgut. The black line indicates median. Mean infection rates are indicated above the graph. Gray numbers indicate the total number of midguts analyzed per line, individual midguts per replicate: Pb820WT: 9/24/16/18, fap20(−): 9/33/21, fap52(−): 6/18/27, fap20(−)/fap52(−): 6/11/12. (F) Oocyst size. Pooled data from two to five cage feeds. Gray numbers indicate the total number of oocysts analyzed per line, individual oocysts per replicate: Pb820WT: 121/87/59/90/117, fap20(−): 20/119/116, fap52(−): 7/107/109/164, fap20(−)/fap52(−): 6/10. (G) Salivary gland and midgut sporozoite counts and ratio. Ratios of salivary gland/midgut sporozoites are depicted at the top. Corresponding counts from one infection are indicated by same symbol filling. (H) Parasitemia after infection by natural transmission. Numbers (†/n) indicate blood-stage positive mice vs. total mice. (AD) Each dot represents data from one mouse. (C, D, and E) Statistics: Kruskal–Wallis with Dunn’s multiple comparisons test.
Fig. 4.
Fig. 4.
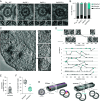
Depletion of both fap20 and fap52 leads to a detachment of the B-tubule from the A-tubule. (A) Example TEM sections of individual axonemes (Upper row, Scale bar: 100 nm.) and doublets (Lower row, Scale bar: 10 nm.) in gametocytes fixed 12 min after activation (mpa). (B) Frequency of doublet states in TEM sections. Total numbers of doublets indicated on top of the bars. (C) Example tomogram section of fap20/52(−) gametocyte 12 mpa with close-up of investigated axonemes I-III. (Scale bar: 200 nm.) Sum projection of 20 z-layers. Close-ups are taken from a slightly different angle to better visualise the doublets. (D) Doublet states of doublets 1 to 9 of axoneme I across z position. Each dot represents an assignable doublet image. Turquoise, detached; gray, attached. First row, example images corresponding to colored dots are shown, black, data points without example picture. (Scale bar: 20 nm.) (E) Fraction of assignable doublet images. Each dot represents one axoneme. (F) Fraction of attached or detached doublets of all assignable images. Each dot represents one axoneme. (G) Scheme of proposed doublet state in wild-type and fap20/52(−) parasites.

Similar articles

Cited by

References

    1. Cyrklaff M., et al. , Cryoelectron tomography reveals periodic material at the inner side of subpellicular microtubules in apicomplexan parasites. J. Exp. Med. 204, 1281–1287 (2007). - PMC - PubMed
    1. Nicastro D., et al. , The molecular architecture of axonemes revealed by cryoelectron tomography. Science 313, 944–948 (2006). - PubMed
    1. Stoddard D., et al. , Tetrahymena RIB72A and RIB72B are microtubule inner proteins in the ciliary doublet microtubules. Mol. Biol. Cell 29, 2566–2577 (2018). - PMC - PubMed
    1. Dymek E. E., et al. , PACRG and FAP20 form the inner junction of axonemal doublet microtubules and regulate ciliary motility. Mol. Biol. Cell 30, 1805–1816 (2019). - PMC - PubMed
    1. Yanagisawa H., et al. , FAP20 is an inner junction protein of doublet microtubules essential for both the planar asymmetrical waveform and stability of flagella in Chlamydomonas. Mol. Biol. Cell 25, 1472–1483 (2014). - PMC - PubMed

Substances

LinkOut - more resources