. 2025 Feb 11;122(6):e2417721122.
doi: 10.1073/pnas.2417721122. Epub 2025 Feb 5.

CO2 potentiates echinocandin efficacy during invasive candidiasis therapy via dephosphorylation of Hsp90 by Ptc2 in condensates

Affiliations

CO2 potentiates echinocandin efficacy during invasive candidiasis therapy via dephosphorylation of Hsp90 by Ptc2 in condensates

Mao Zhang et al. Proc Natl Acad Sci U S A. .

Abstract

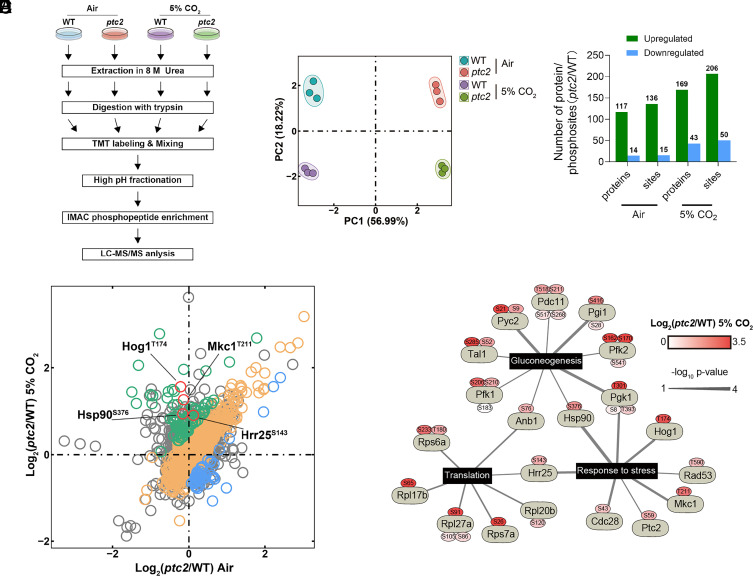
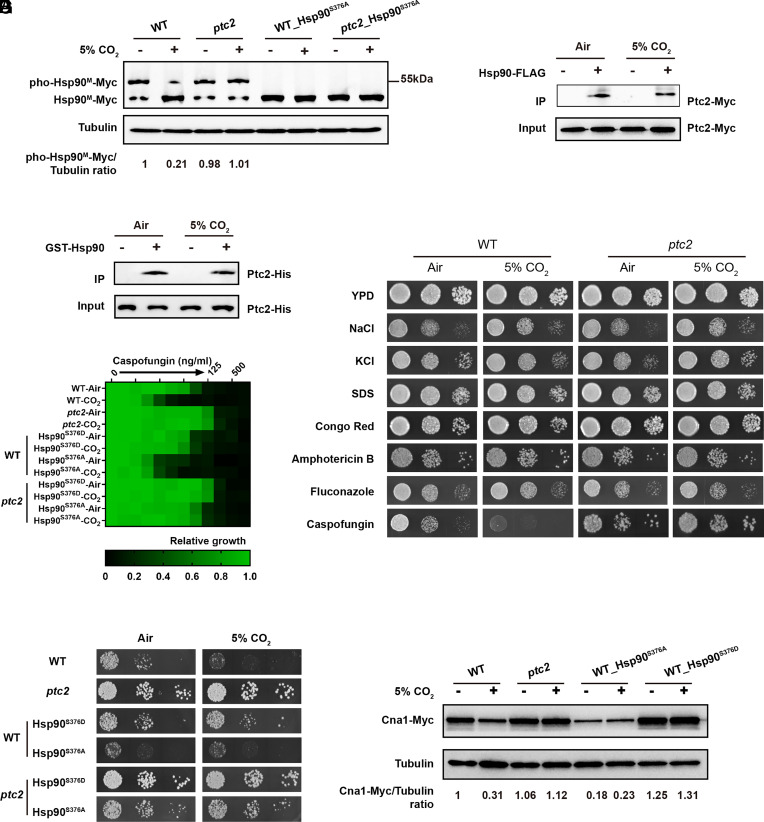
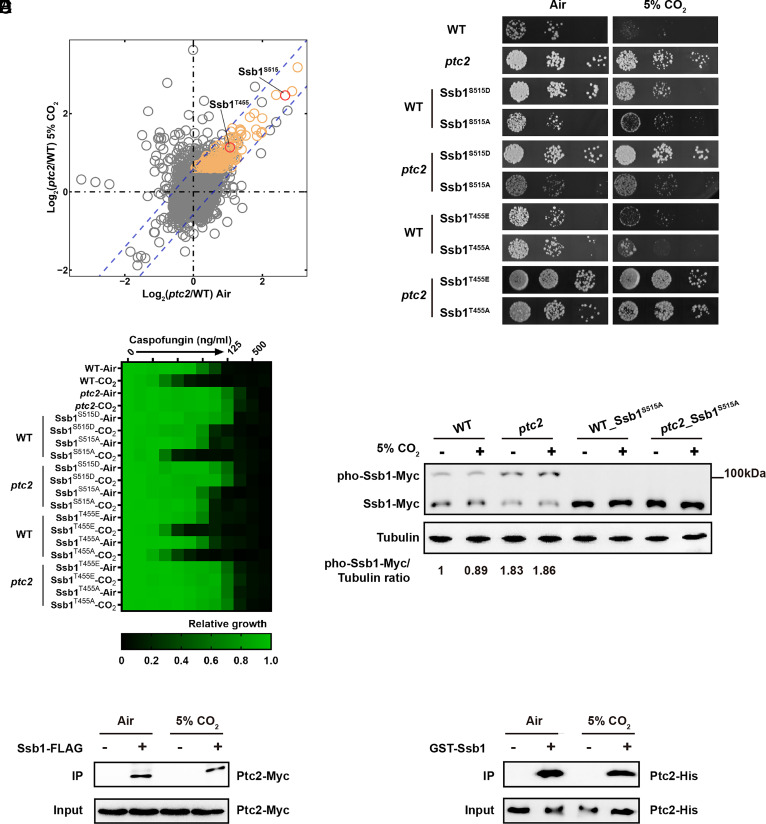
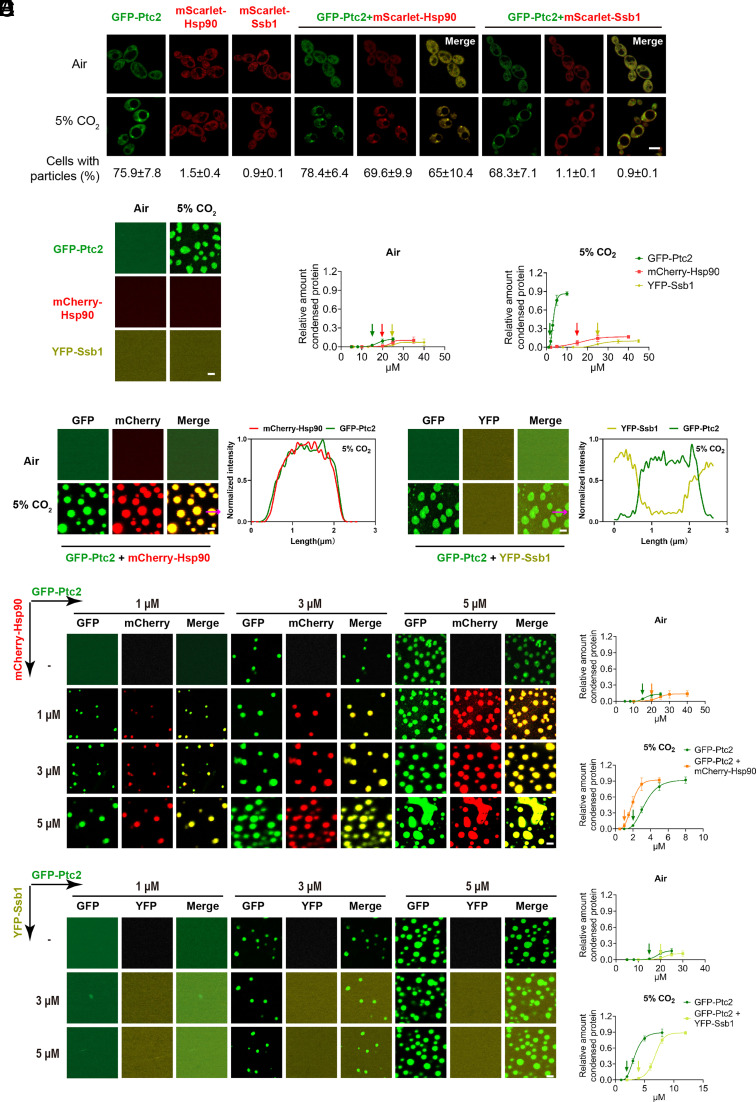
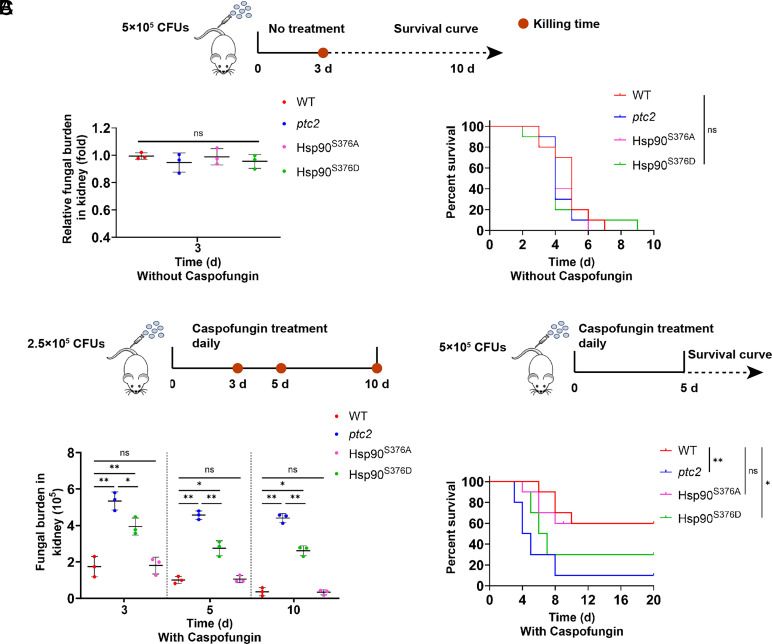
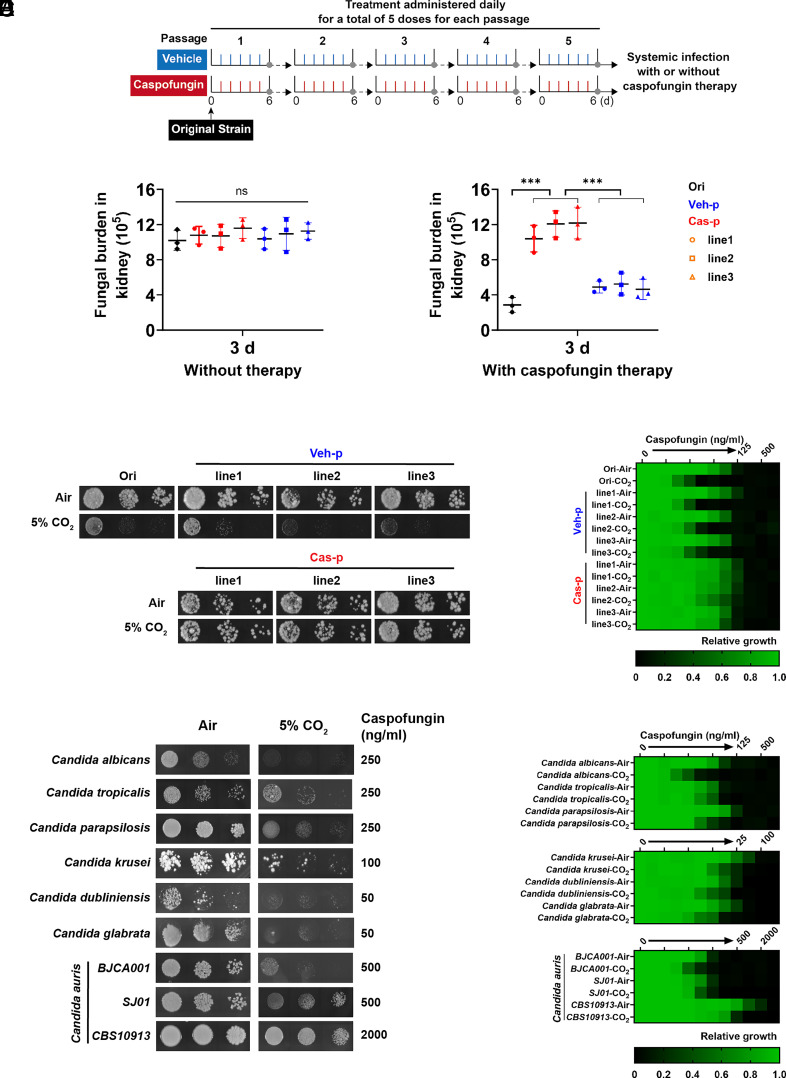
Carbon dioxide is a signaling cue critical for fungal pathogenesis. Ptc2, a type 2C protein phosphatase (PP2C), serves as a conserved CO2 sensor in fungi. By combining phosphoproteomic and biochemical assays, we identified Hsp90 as a direct target of Ptc2 at host CO2 concentrations and Ssb1 as a Ptc2 target protein regardless of CO2 levels in Candida albicans, the most prevalent human fungal pathogen. Ptc2 forms reversible condensates at elevated CO2, which enables the recruitment of Hsp90, but not Ssb1, to condensates, allowing efficient dephosphorylation. This process confers an enhanced susceptibility to caspofungin in vitro and during in vivo infection therapy. Importantly, we demonstrate this phenomenon in non-albicans Candida species. Sequential passages of C. albicans in mice with caspofungin treatment readily induce in vivo drug tolerance, causing therapeutic failure. These evolved strains display increased resistance to caspofungin under host concentrations of CO2 but remain susceptible in air. Collectively, our study reveals a profound impact of host concentrations of CO2 on antifungal drug susceptibility and connects this phenotype to therapeutic outcomes and highlights condensate formation as an efficient means that enables selective recruitment of substrates for certain signaling events.

Keywords: Candida; Hsp90; carbon dioxide; drug susceptibility; phase separation.


Conflict of interest statement

Competing interests statement:The authors declare no competing interest.

Figures

Fig. 1.
Fig. 1.
Quantitative phosphoproteomic analyses for the identification of potential Ptc2 target sites. (A) Quantitative MS-based phosphoproteomics workflow. Protein extraction was performed in wild-type and ptc2 mutant cells incubated under air and 5% CO2 conditions at 30 °C. Trypsin digestion was carried out, and resulting peptides were labeled with TMT (Tandem Mass Tags) reagents and then mixed. Peptide samples were subjected to IMAC to enrich phosphopeptides for LC-MS/MS analysis. Three biological replicate analyses per sample were performed. (B) PCA of the phosphoproteome. (C) Ptc2 target phosphosites under air and 5% CO2 conditions. The numbers of proteins with altered phosphosites were also shown. (D) Scatterplot illustrating phosphoproteomic data from wild type and ptc2 mutant strain under both air and 5% CO2 conditions. (E) GO term enrichment analysis of potential target proteins of Ptc2 in response to high CO2. The upregulated phosphorylated sites in the ptc2 mutant compared to the wild-type strain are shown. The thickness of edges indicates the confidence of data support.
Fig. 2.
Fig. 2.
Host concentrations of CO2 enhance caspofungin efficacy via Ptc2-mediated dephosphorylation of Hsp90. (A) Hsp90 is dephosphorylated at S376 in response to 5% CO2 in a Ptc2-dependent manner. Cells of wild type and ptc2 mutant carrying the Myc-tagged middle domain of Hsp90 (Hsp90M) with or without S376A mutation were collected after incubation in air or in 5% CO2 for 4 h at 30 °C. Protein was extracted for Phos-tag gel analysis. (B) Ptc2 interacts with Hsp90 in vivo under both air and 5% CO2 conditions. Overnight culture of wild-type cells carrying Hsp90-FLAG and Ptc2-Myc or Ptc2-Myc alone was diluted 1:50 into YPD liquid medium at 30 °C for 4 h. Protein lysates were subjected to immunoprecipitation with anti-FLAG antibody, and the precipitated proteins were probed with anti-Myc antibody. As an input control, cell lysates were analyzed by western blotting with the anti-Myc antibody. (C) Ptc2 directly interacts with Hsp90 in vitro. Recombinant GST-Hsp90 and Ptc2-His were incubated with Glutathione-agarose in the absence or presence of 5% CO2 at 25 °C. Samples were assayed by immunoblot with the anti-His antibody. (D) Dilutions of wild type and ptc2 mutant cells were spotted onto the solid YPD plates containing either 1.5 M NaCl, 1.5 M KCl, 0.025% SDS, 200 μg/mL Congo red, 0.4 μg/mL amphotericin B, 1 μg/mL fluconazole, or 250 ng/mL caspofungin, as well as control plates without these drugs. Photographs were taken after growth under air and 5% CO2 conditions at 37 °C. (E) Caspofungin susceptibility assays of indicated strains were conducted in liquid YPD medium with different concentrations of caspofungin under both air and 5% CO2 conditions. Growth was measured by absorbance at 600 nm. Data are quantitatively displayed in heat map format (see color bar). (F) Cells of indicated strains were serially diluted 10-fold and spotted on YPD solid medium containing 250 ng/mL caspofungin. Incubation was performed at 37 °C under both air and 5% CO2 conditions. (G) The analysis of Cna1 expression by western blot. Wild type and ptc2 mutant cells carrying C-terminally Myc-tagged CNA1 were grown as described in (B). Wild-type strains with the S376A or S376D mutation in Hsp90 were also included in the western analysis for Cna1-Myc.
Fig. 3.
Fig. 3.
Ptc2 targets Ssb1 regardless of CO2 concentrations to enhance C. albicans susceptibility to caspofungin. (A) Scatterplot illustrating phosphoproteomic data indicates Ptc2 target sites independent of CO2 that are shown in yellow. (B) Wild type and ptc2 mutant cells with or without S515 or T455 mutation at Ssb1 were serially diluted 10-fold and spotted on YPD solid medium containing 250 ng/mL caspofungin. Plates were incubated at 37 °C under air and 5% CO2 conditions. (C) Caspofungin susceptibility of indicated strains was determined in liquid YPD medium under air and 5% CO2 conditions at 37 °C. (D) Ptc2-mediated dephosphorylation of Ssb1 at S515 residue is independent of CO2 levels. Cells of wild type and ptc2 mutant carrying the Myc-tagged Ssb1 with or without S515A mutation were collected after incubation in air or in 5% CO2 at 30 °C. Protein was extracted for Phos-tag gel analysis. (E) Ptc2 interacts with Ssb1 in vivo under both air and 5% CO2 conditions. Overnight culture of wild-type cells carrying Ssb1-FLAG and Ptc2-Myc or Ptc2-Myc alone was diluted 1:50 into YPD liquid medium at 30 °C. Cells were then incubated in the presence or absence of 5% CO2 for 4 h. Protein lysates were subjected to immunoprecipitation as described for Fig. 2B. (F) Ptc2 directly interacts with Ssb1 in vitro. Recombinant GST-Ssb1 and Ptc2-His were incubated with Glutathione-agarose in the absence or presence of 5% CO2 at 25 °C. Samples were assayed by immunoblot with the anti-His antibody.
Fig. 4.
Fig. 4.
Hsp90, but not Ssb1, can be recruited to condensates at elevated CO2 (A) Fluorescence images of C. albicans expressing GFP-Ptc2, GFP-Ptc2 + mScarlet-Hsp90, or GFP-Ptc2 + mScarlet-Ssb1 in air or 5% CO2. Representative images of three independent experiments are shown. (Scale bar, 5 μm.) The percentage of cells with particles/merged particles formed in 5% CO2 is determined by counting at least 200 cells/sample and shown below. Data shown as means ± SD of three independent experiments. (B) Phase separation of GFP-Ptc2, mCherry-Hsp90, and YFP-Ssb1 at the concentration of 5 μM. The formation of liquid droplet was determined in air or 5% CO2 at room temperature. The graphs on the Right show the quantification of the relative amount of condensed protein versus the protein concentration. The saturation concentration is indicated by the arrow. (C) GFP-Ptc2 and mCherry-Hsp90 are equally enriched and homogenously distributed in droplets under 5% CO2 at room temperature; protein concentration is 5 μM. (D) GFP-Ptc2 undergoes LLPS, and the addition of mCherry-Hsp90 reduces the saturation concentration in 5% CO2. The protein concentration for each component is indicated. The graphs on the Right show the quantification of the relative amount of condensed protein versus the protein concentration under air and 5% CO2 conditions. The saturation concentration is indicated by the arrow. (E) Addition of YFP-Ssb1 does not promote phase separation of GFP-Ptc2. YFP-Ssb1 and GFP-Ptc2 were mixed at the indicated concentrations. (BE) Representative images of three independent experiments are shown. (Scale bar, 2 μm.)
Fig. 5.
Fig. 5.
CO2 significantly impacts caspofungin therapeutic efficacy during invasive candidiasis. (A) Female BALB/c mice were infected with 5 × 10⁵ CFUs of either the wild-type strain with or without the Hsp90 S376 mutation or the ptc2 mutant via tail vein injections. Relative fungal burdens in the infected kidneys at day 3 postinfection are shown on the Left. Data are presented as means ± SD (n = 3). Significance was measured with an unpaired t test in GraphPad Prism. Ten mice were monitored for clinical end points for each strain and survival curves are shown on the Right. Percentage of survival is indicated in the y-axis. Significance was measured with the log-rank test. (B) Kidney fungal burdens of the indicated strains at days 3, 5, and 10 after C. albicans infection (2.5 × 10⁵ CFUs). Caspofungin (0.05 mg/kg of body weight per day) was administered intraperitoneally after challenge with C. albicans. Data are presented as means ± SD (n = 3). Significance was measured with an unpaired t test in GraphPad Prism. (C) Survival curves for indicated strains in a mouse model of systemic infection with the caspofungin treatment. Caspofungin (0.05 mg/kg of body) was administered intraperitoneally starting 24 h after infection and then daily for a total of five doses. Ten mice were monitored for clinical end points until day 20 postinfection for each group. Significance was measured with the log-rank test. ns, no significance; *P < 0.05; **P < 0.01.
Fig. 6.
Fig. 6.
Sequential passages of C. albicans in mice with caspofungin therapy readily induce resistant phenotype at host concentrations of CO2. (A) Schematic overview of the evolution protocol based on the systemic infection of mice by C. albicans cells coupled with serial transplants from infected to naïve hosts. Caspofungin (0.05 mg kg−1), or a vehicle control (color coded) was administered intraperitoneally starting 24 h after infection and then daily for a total of five doses. C. albicans cells recovered from infected kidneys were collected at day 6 postinfection for subsequent infection of naïve hosts. (B) Kidney fungal burdens of the strains recovered from each evolution line after five serial passages at day 3 after systemic infection. Caspofungin or a vehicle was administered daily. The original strain serves as the control, which is shown in black color. Cells recovered from the three independent evolution lines are indicated with different symbols. Data are presented as means ± SD (n = 3). Significance was measured with an unpaired t test in GraphPad Prism. ns, no significance; ***P < 0.001. (C) Cells of the strains from (B) were serially diluted 10-fold and spotted on YPD solid medium containing 250 ng/mL caspofungin. The plates were incubated at 37 °C in air and 5% CO2. (D) Caspofungin susceptibility assays of indicated strains were conducted in liquid YPD medium with different concentrations of caspofungin. Growth was measured by absorbance at 600 nm after incubation under air and 5% CO2 conditions at 37 °C. Optical densities were normalized relative to those of caspofungin-free controls. Data are quantitatively displayed in heat map format (see color bar). Caspofungin susceptibility of C. albicans, Candida tropicalis, Candida parapsilosis, Candida krusei, Candida dubliniensis, Candida glabrata, and C. auris (BJCA001, SJ01, and CBS10913) was determined in YPD solid (E) and liquid (F) media as described in (C) and (D), respectively.

Similar articles

Cited by

References

    1. Denning D. W., Global incidence and mortality of severe fungal disease. Lancet Infect. Dis. 24, e428–e438 (2024). - PubMed
    1. Salmanton-Garcia J., et al. , Attributable mortality of candidemia–Results from the ECMM Candida III multinational European Observational Cohort Study. J. Infect. 89, 106229 (2024). - PubMed
    1. Sharma M., Chakrabarti A., Candidiasis and other emerging yeasts. Curr. Fungal Infect. Rep. 17, 15–24 (2023). - PMC - PubMed
    1. Pappas P. G., et al. , Clinical practice guideline for the management of candidiasis: 2016 Update by the Infectious Diseases Society of America. Clin. Infect. Dis. 62, 409–417 (2016). - PubMed
    1. Pfaller M. A., Moet G. J., Messer S. A., Jones R. N., Castanheira M., Geographic variations in species distribution and echinocandin and azole antifungal resistance rates among Candida bloodstream infection isolates: Report from the SENTRY Antimicrobial Surveillance Program (2008 to 2009). J. Clin. Microbiol. 49, 396–399 (2011). - PMC - PubMed

MeSH terms

LinkOut - more resources