. 2025 Feb 11;122(6):e2417735122.
doi: 10.1073/pnas.2417735122. Epub 2025 Feb 5.

Ethylene-independent modulation of root development by ACC via downregulation of WOX5 and group I CLE peptide expression

Affiliations

Ethylene-independent modulation of root development by ACC via downregulation of WOX5 and group I CLE peptide expression

Wangshu Mou et al. Proc Natl Acad Sci U S A. .

Abstract

In seed plants, the canonical role of 1-aminocyclopropane-1-carboxylic acid (ACC) is to serve as the precursor in the biosynthesis of the phytohormone ethylene, and indeed, ACC treatment is often used as a proxy for ethylene treatment. Increasing evidence suggests that ACC can also act independently of ethylene to regulate various aspects of plant growth and development. Here, we explore the effects of ACC on Arabidopsis thaliana root growth and the mechanisms by which it acts. ACC inhibits growth of the primary root in Arabidopsis seedlings when ethylene signaling is blocked, which becomes evident after 36 h of treatment with ACC. This reduced root growth is in part the result of suppressed cell proliferation in the root meristem resulting from altered expression of a key regulator of stem cell niche activity, WOX5. ACC also promotes lateral root (LR) development, in contrast to ethylene, which inhibits LR formation. Transcriptomic analysis of roots revealed no significant changes in gene expression after 45 min or 4 h of ACC treatment, but longer treatment times revealed a large number of differentially expressed genes, including the downregulation of the expression of a small group of phylogenetically related CLE peptides. Reduced expression of these group 1 CLEs in response to ACC leads to the activation of a transcription factor, LBD18, which promotes LR development. These results suggest that ACC acts to modulate multiple aspects of Arabidopsis root growth independently of ethylene via distinct transcriptional effects in the root meristem and LR precursor cells.

Keywords: ACC; CLE peptides; ethylene; lateral roots; root development.


Conflict of interest statement

Competing interests statement:The authors declare no competing interest.

Figures
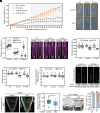
Fig. 1.
Fig. 1.
ACC treatment inhibits primary root elongation independent of its role in ethylene biosynthesis. (A) Kinetics of the response of Arabidopsis primary roots to ACC. WT or ein2-5 seedlings were grown on MS agar medium for 5 d in light and then transferred to medium with or without ACC (10 μM used for all treatments) and grown for a further 96 h with root length measurements taken at 4-h intervals. n = 8 for each sample. Data shown are mean ± SE. (B) Representative images of 7-d-old WT, ein2-5, and ET-free seedlings grown on media with or without ACC. (Scale bar, 1 cm.) (C) Quantification of primary root length of WT, ein2-5, and ET-free mutant seedlings grown in control, ACC, or 10 ppm ethylene for 7 d. n = 42 to 98 seedlings for each sample. (D) Confocal microscopy images of propidium iodide (PI)-stained root tips of 7-d-old WT, ein2-5, and ET-free seedlings grown on MS agar medium in the continuous presence or absence of ACC. Yellow arrows indicate the position of the QC (bottom arrow) and the boundary of the meristem just below the first elongated cell (top arrow, with close-up images in the figure Inset). (Scale bar, 100 μm.) Quantifications of meristem length, cortical cell number, and the average cortical cell length within the meristem zone are shown in (EG), respectively. n = 15 to 19 for each sample. (H) Images of EdU incorporation assays of ein2-5 and ET-free root meristems of 6-d-old seedlings in the continuous presence or absence of ACC. (Scale bar, 100 μm.) The fluorescence intensity (Fluor. Intensity) was determined as described in Materials and Methods. The fluorescence intensity of each genotype under the control treatment was normalized to 100. Data are shown as the mean ± SE (n = 12 to 15); significant differences between the control and ACC-treated roots for the same genotype are indicated by asterisks (****P < 0.0001 for ein2-5 and **P < 0.01 for ET-free, two-tailed t test). (I) Representative images of roots of 6-d-old seedlings showing the expression pattern of proWOX5:GFP in the WT background with and without ACC treatment in the presence of 1-MCP (10 ppm). (Scale bar, 50 μm.) The red arrows indicate the QC, and the yellow arrow indicates the expansion of expression of the WOX5 reporter. (J) Quantification of the fluorescence intensity (Fluor. Intensity) of proWOX5:GFP specifically at the QC position using ImageJ. The fluorescence intensity for the control group was set as 100. n = 36 and 42 seedlings for the control and ACC treatment, respectively. Significant difference (P < 0.05, two-tailed t test) compared to the control is indicated by an asterisk. (K) Representative images of distal root meristems of 7-d-old seedlings grown with and without ACC in the presence of 1-MCP analyzed by mPS-PI staining. Arrowheads: blue, QC; yellow, columella stem cell (CSC); red, differentiated columella cells (CC). (Scale bar, 20 μm.) (L) Frequency of roots of 7-d-old WT seedlings carrying the indicated layers of CSC. n = 16 and 24 for control and ACC treatment, respectively. For the box plots shown in (C, EG, and J), the 25th and 75th percentiles are bound by boxes, whiskers extend to 1.5 times the interquartile range beyond the box, blue crosses indicate mean values, and center lines show the medians, and all the data points are represented by gray dots. Different letters (P < 0.05) represent significant differences by one-way ANOVA with the Tukey test for (EG) and by Kruskal–Wallis with Dunn’s post hoc test for (C).
Fig. 2.
Fig. 2.
ACC positively regulates LR development. (A) Representative phenotypes of LRs in WT, ein2-5, and ET-free 10-d-old seedlings continuously grown with or without ACC. (Scale bar, 1 cm.) (B) LR density (emerged LRs/cm primary root) of 10-d-old WT, ein2-5, and ET-free seedlings grown in the presence or absence of ACC. n = 49 to 73 for each sample. (C) The total number of LRP+LRs per 100 cortical cells of 10-d-old WT, ein2-5, and ET-free seedlings grown in the presence or absence of ACC. n = 18 to 20 for each sample. (D) The cellular LR density (corresponding to 100 cortical cells) in ein2-5 treated with and without ACC for 5, 7, and 9 d, classified by LR developmental stages. Small LRPs: Stage I–IV, large LRP: Stage V–VII, ELRs: emerged LRs. Data are mean ± SE (n = 11 to 18). Significant differences are indicated by asterisks (****P < 0.0001, ***P < 0.001, **P < 0.01, and *P < 0.05, two-tailed t test). (E) Stage distribution of LRP (I to VII) and emerged LR (E) in ein2-5 seedlings treated with or without ACC for 5, 7, and 9 d. n ≥ 10 for each group. Asterisks indicate significant difference (****P < 0.0001, ***P < 0.001, **P < 0.01, and *P < 0.05) compared to the control determined by the two-tailed t test. (F) LR phenotypes of WT and acs octuple grown for 10 d with or without ACC in the presence of 1-MCP (10 ppm). (Scale bar, 1 cm.) (G) LR density (LR/cm) of the seedlings shown in the (F). n = 29 to 32 seedlings for each group. (H) The cellular LR density (LRs/100 cortical cells) in the acs octuple compared to the WT for 5, 7, and 9 d, classified by LR developmental stages. Small LRPs: Stage I–IV, large LRP: Stage V–VII, ELRs: emerged LRs. Data are mean ± SE (n = 11 to 14). Significant differences are indicated by asterisks (****P < 0.0001, ***P < 0.001, **P < 0.01, and *P < 0.05, two-tailed t test). (I) Stage distribution of LRP (I to VII) and emerged LR (E) in WT and acs oct seedlings at different time points. Asterisks indicate significant difference (*P < 0.05, **P < 0.01, and ***P < 0.001) compared to the WT determined by the two-tailed t test. For the box plots shown in (B), (C), and (G), the 25th and 75th percentiles are bound by boxes, whiskers extend to 1.5 times the interquartile range beyond the box, blue crosses indicate mean values, and center lines show the medians, and all the data points are represented by gray dots. Different letters (P < 0.05) represent significant differences by one-way ANOVA with the Tukey test for (C), and Kruskal–Wallis test with Dunn’s post hoc test for (B) and (G), respectively.
Fig. 3.
Fig. 3.
ACC promotes LR formation by inhibiting expression of CLEs (5, 6, and 7). (A) Volcano plot of DEGs identified by RNA-seq in ein2-5 seedlings exposed to ACC vs. control for 40 h. DEGs were sorted by P-value and fold-change. Those genes that display a P-value < 0.001, a log2 fold-change ≥ 1 up/down in response to ACC, and an FDR of <0.05 are colored red (up-regulated) or blue (down-regulated). Three biological replicates for each treatment. (B) The expression level of CLEs in control and ACC-treated ein2-5 seedlings as determined from the RNA-seq data. CLE4, 5, 6, and 7 exhibited significantly reduced expression in response to ACC treatment compared to control, with log2 (Fold change) >1.0 and P value < 0.0001, indicated by asterisks (****). (C) Phylogenetic tree of Arabidopsis CLEs based on full-length protein sequences and constructed using the Neighbor-Joining method in MEGA11. The evolutionary distances were computed via the p-distance method. Tree scale = 0.1. Group I CLEs are indicated in red color. (D) Relative expression level of CLE5, 6, and 7 in the acs octuple mutant compared to the WT. The expression level in WT was normalized as 1.0 for each gene. Data are presented as mean ± SE (n = 4). Significant differences are indicated by asterisks (*P < 0.05, two-tailed t test). (E) GUS staining of 8-d-old proCLE5/6/7:GUS seedlings treated with or without ACC, in the presence of 1-MCP (10 ppm). Red arrows indicate the LR primordia/emerged LRs at the same developmental stages. (Scale bar, 50 μm.)
Fig. 4.
Fig. 4.
ACC-induced downregulation of CLE5/6 peptide expression promotes LR formation by activating LBD18 expression. (A) LR phenotypes of WT, acs octuple, and cle septuple seedlings grown for 10 d on control media, media plus ACC, CLE5/6 peptide (CLE5/6p, 0.1 μM), or ACC+CLE5/6p. All the treatments are in the presence of 1-MCP. (Scale bar, 1 cm.) (B) LR density (LR/cm) of the seedlings shown in (A). One-way ANOVA with the Tukey test was performed for each genotype across different treatments. Different letters (P < 0.05) indicate significant differences among treatments within each genotype. n > 10 seedlings for each sample. (C) The relative expression levels of LBD16, 18, and 29 in the root tissue of ein2-5 grown on media containing ACC compared to seedlings grown on control media. Data are mean ± SE (n = 3) with significant difference indicated by asterisks (**P < 0.01, two-tailed t test). (D) GUS expression of representative 8-d-old proLBD18:GUS seedlings at different LR developmental stages, treated with ±ACC in the presence of 1-MCP (10 ppm). Black arrowheads indicate the difference in the expression pattern (pericycle cells and LRP). Dashed lines indicate LRP. (Scale bar, 50 μm.) (E) LR phenotypes of 10-d-old WT and lbd18 seedlings grown with or without ACC in the presence of 1-MCP. (Scale bar, 1 cm.) (F) LR density of the seedlings shown in (F). n = 28 to 60 seedlings for each sample. Different letters (P < 0.05) represent significant differences by the Kruskal–Wallis test with Dunn’s post hoc test. (G) A proposed model for the ACC-mediated regulation of root development. ACC is synthesized from S-adenosylmethionine (AdoMet), and ACC can in turn be converted to ethylene via ACO. ACC inhibits primary root growth via downregulation of WOX5 expression and promotes LR development by downregulation of multiple CLEs, which in turn regulate the expression of LBD18. Ethylene opposes the role of ACC in LR development.

Similar articles

Cited by

References

    1. Yang S. F., Hoffman N. E., Ethylene biosynthesis and its regulation in higher plants. Annu. Rev. Plant Physiol. 35, 155–189 (1984).
    1. Xu S. L., Rahman A., Baskin T. I., Kieber J. J., Two leucine-rich repeat receptor kinases mediate signaling linking cell wall biosynthesis and ACC synthase in Arabidopsis. Plant Cell 20, 3065–3079 (2008). - PMC - PubMed
    1. Tsang D. L., Edmond C., Harrington J. L., Nühse T. S., Cell wall integrity controls root elongation via a general 1-aminocyclopropane-1-carboxylic acid-dependent, ethylene-independent pathway. Plant Physiol. 156, 596–604 (2011). - PMC - PubMed
    1. Vanderstraeten L., Depaepe T., Bertrand S., Van Der Straeten D., The ethylene precursor ACC affects early vegetative development independently of ethylene signaling. Front. Plant Sci. 10, 1591 (2019). - PMC - PubMed
    1. Yin J., et al. , Aminocyclopropane-1-carboxylic acid is a key regulator of guard mother cell terminal division in Arabidopsis thaliana. J. Exp. Bot. 70, 897–908 (2019). - PMC - PubMed

MeSH terms

LinkOut - more resources