. 2025 Feb 5;20(2):e0313556.
doi: 10.1371/journal.pone.0313556. eCollection 2025.

Transient ocular hypertension remodels astrocytes through S100B

Affiliations

Transient ocular hypertension remodels astrocytes through S100B

Weiran Huang et al. PLoS One. .

Abstract

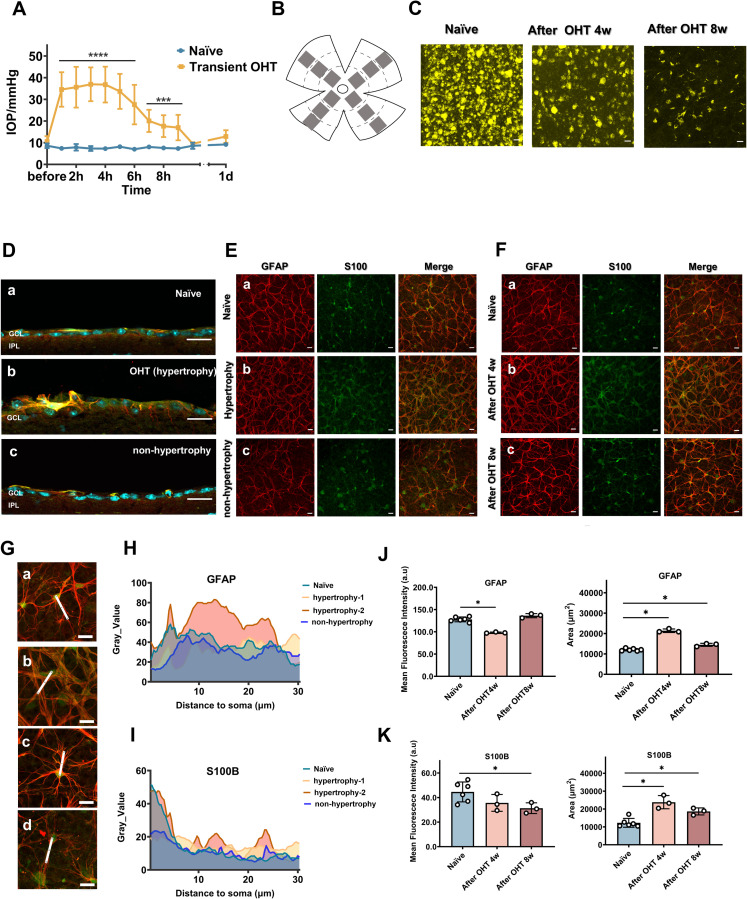
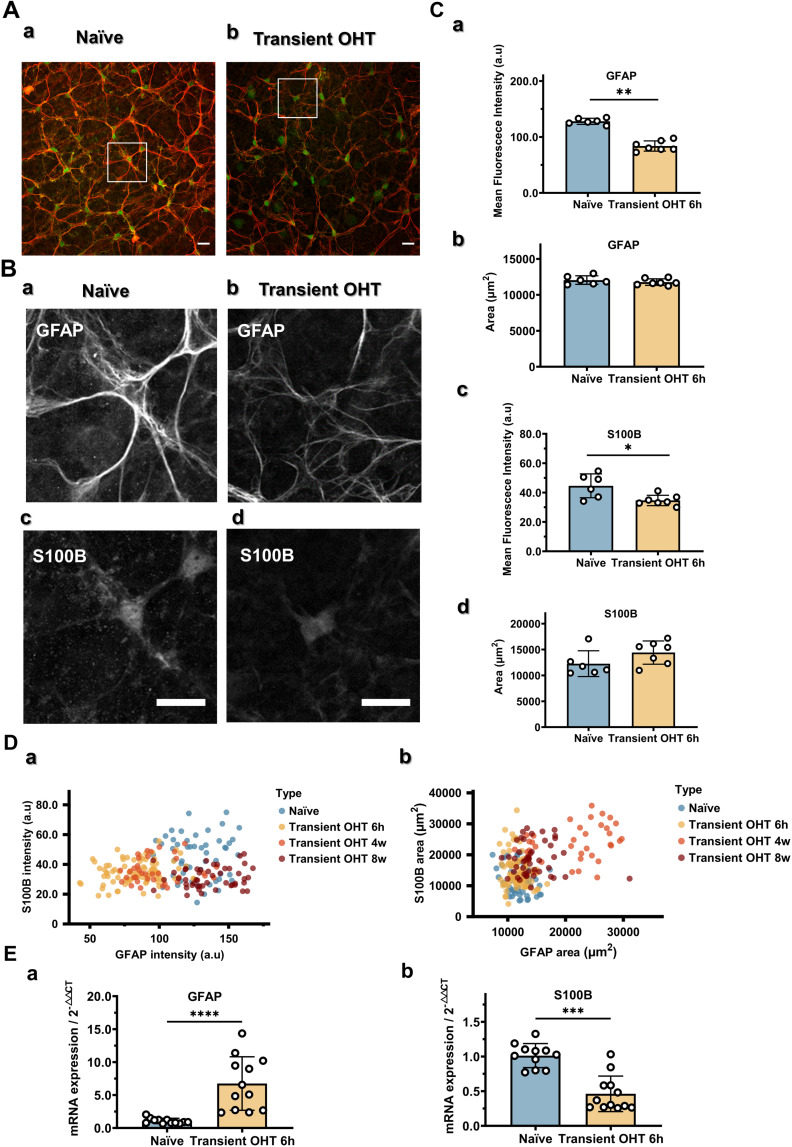
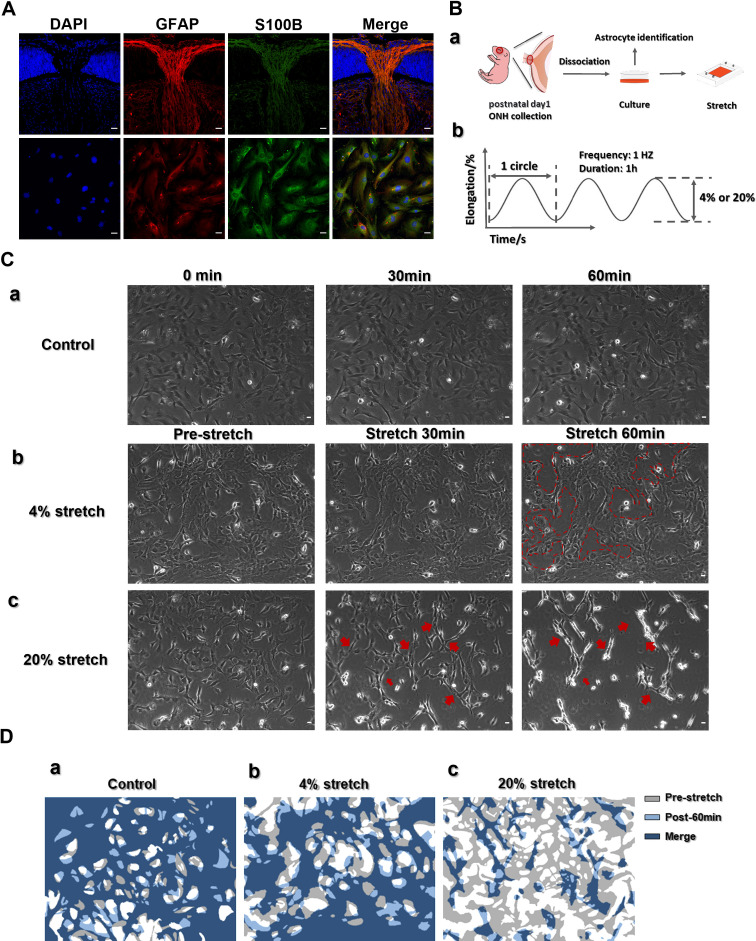
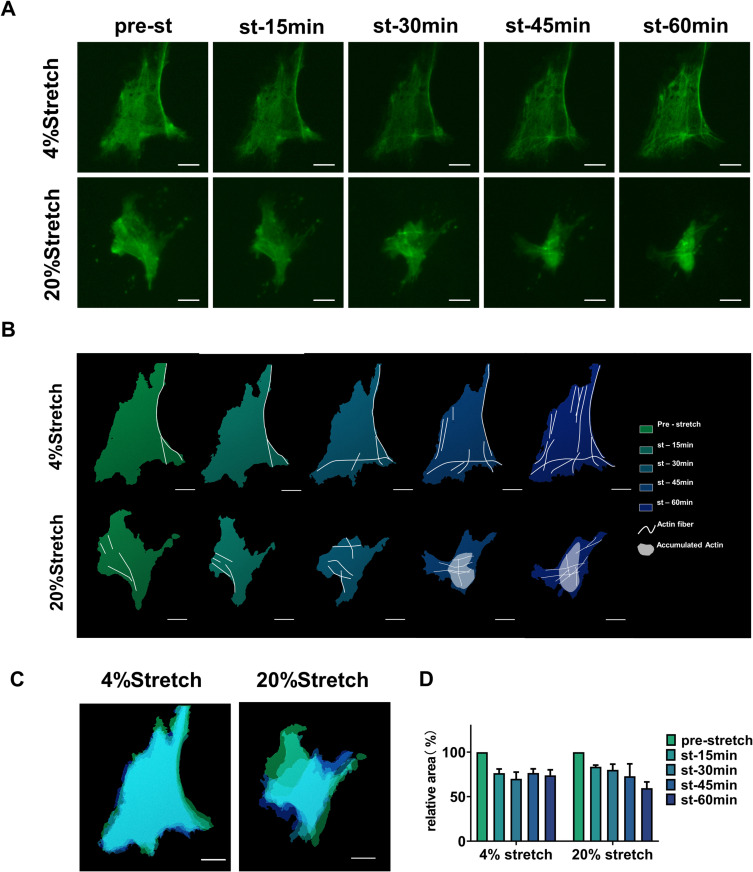
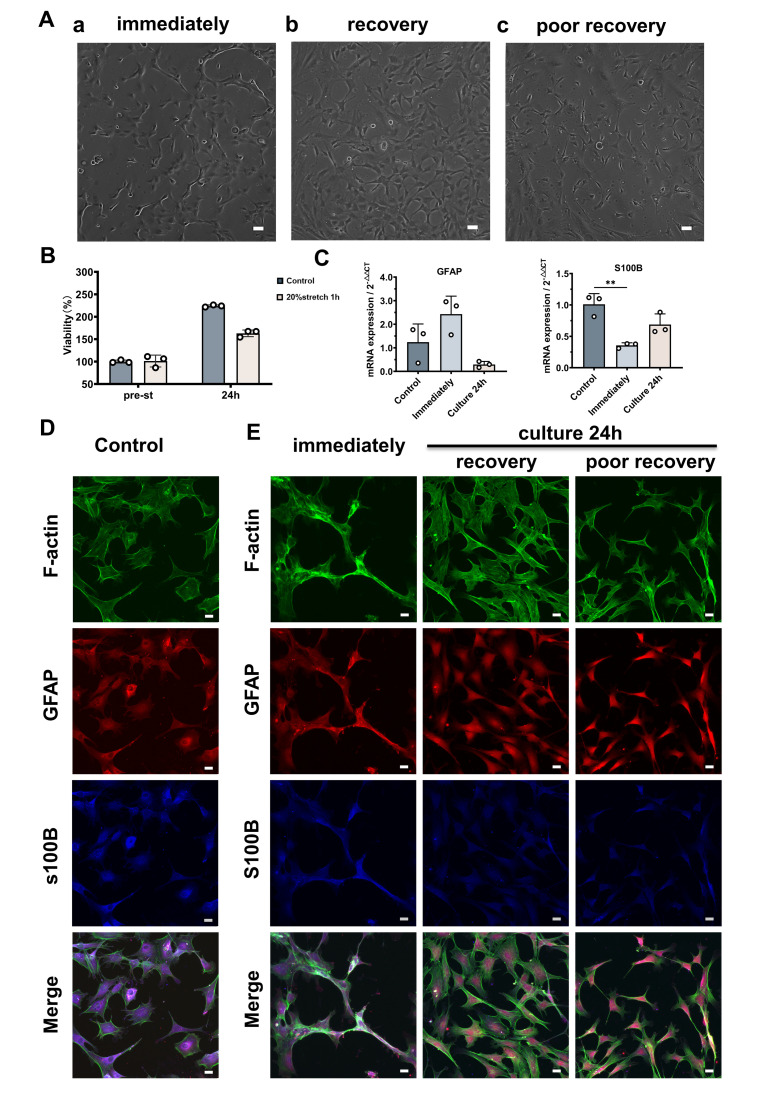
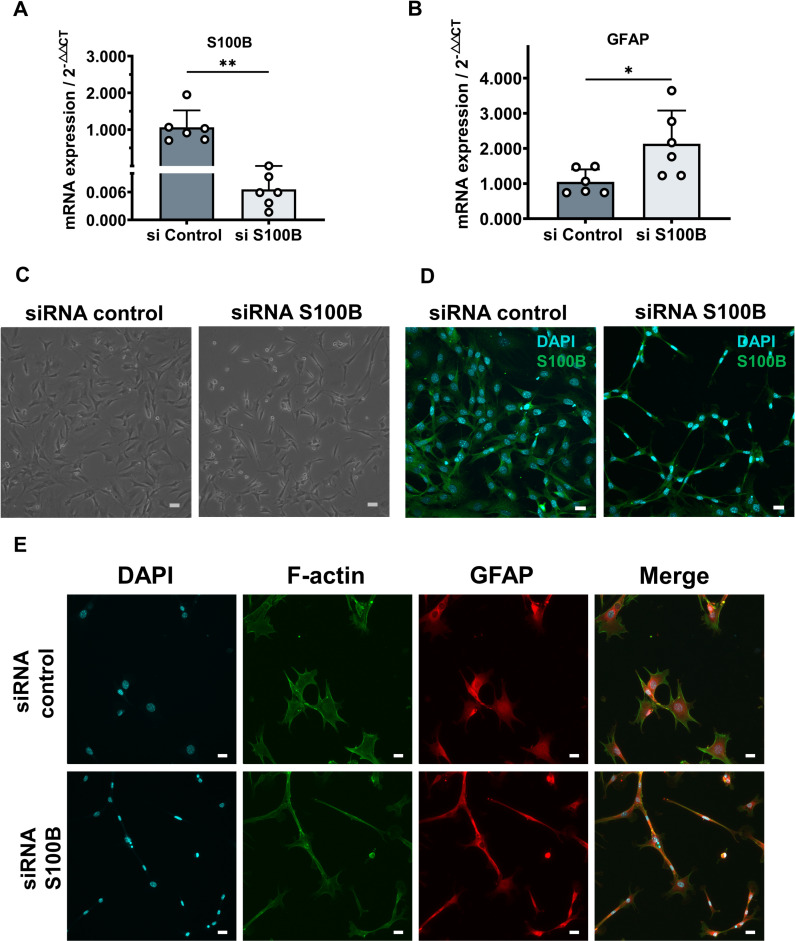
Glaucoma is a series of irreversible and progressive optic nerve degenerations, often accompanied by astrocyte remodeling as the disease progresses, a process that is insufficiently understood. Here, we investigated the morphology of retinal and optic nerve head (ONH) astrocytes under mechanical stress, and explored whether a specific phase is present that precedes astrocyte remodeling. A mouse model of transient ocular hypertension (OHT) and an in vitro cell stretch model were established to mimic the pathological conditions of increased intraocular pressure and mechanical stress on cultured cells. Glial fibrillary acidic protein (GFAP), S100B, and actin staining were used to characterize astrocyte morphology and cytoskeleton, with qPCR used to measure mRNA expression. We also silenced S100B expression and conduct RNA sequencing on ONH astrocytes. Astrocytes displayed weaker GFAP intensity (p < 0.0001) in the early-stage OHT mouse model, prior to the onset of hypertrophy, which was accompanied by an increase in GFAP mRNA expression (p < 0.0001) and a decrease in S100B mRNA expression (p < 0.001). In vitro-stretched astrocytes tended to contract and had fewer cellular processes and more elongated cell bodies. Downregulation of S100B expression occurred in in both the in vivo (p = 0.0001) and in vitro (p = 0.0023) models. S100B-silenced ONH astrocytes were similarly characterized by a slender morphology. In the RNA-seq analysis, genes downregulated by more than fivefold were predominantly enriched in terms related to nutrient metabolism, motor proteins and morphogenesis. Meanwhile, genes upregulated by more than fivefold were primarily associated with terms related to histone modification and visual perception. As an early response to mechanical stress, S100B expression is downregulated in astrocytes, which assume a slender morphology, reminiscent of cell "weakening." Silencing intracellular S100B expression induced similar morphology changes and altered the transcriptome. Stress-induced changes were reversible, with evidence of enhanced late-stage reactivation that is likely related to S100B.


Conflict of interest statement

The authors have declared that no competing interests exist.

Figures

Fig 1
Fig 1. OVD-induced transient OHT in mice leads to RGC loss and astrocyte reactivity.
(A) OVD injections led to IOP increase, with values presented as means ± SD. IOP decreased 6 hours post-injection and by day 1 had returned to near baseline levels. For the OHT group IOP, n = 110 mice; for the naïve group IOP, n = 6 mice. Within 6 hours, the difference was highly significant with a p-value < 0.0001. Later, at 7–9 hours, the OHT groups continued to show significant differences compared to controls, with a p-value of 0.0004. Unpaired t-test, parametric test, * p < 0.05, ** p < 0.01, *** p < 0.001, and **** p < 0.0001. (B) Schematic diagram of the imaging field distribution in the retinal wholemounts. The gray frames indicate the imaging fields. (C) RGCs were retrogradely labeled with FluoroGold (FG). Short-term IOP elevation can trigger RGC loss after 4 or 8 week. n = 3 mice per group. (D–F) Astrocyte reactivity. Astrocytes were labeled with antibodies against intermediate filaments (GFAP, red) and cytoplasm (S100B, green). GCL nuclei were stained with DAPI (cyan). Da, Ea and Fa: Retina from untreated mice; Db and Eb: Retina from OHT mice with astrocyte hypertrophy after 4 weeks; Dc and Ec: Retina from OHT mice without astrocyte hypertrophy. Fb and Fc: Hypertrophic type astrocytes at 4 weeks (hypertrophy-1) and 8 weeks (hypertrophy-2). (G) Enlarged image of naïve (a), hypertrophy-1(b), hypertrophy-2 (c) and non-hypertrophy (d) astrocytes. The white line in E represents the measurement line, starting from the cell soma and following the cell process for a distance of 30 μm. Using the “profile plot analysis” in ImageJ, the data (gray values) are shown in panels H and I. (H) Grayscale value comparison of GFAP (white line in G) in astrocytes, showing different patterning. (I) Grayscale value comparison of S100B (white line in G) in astrocytes showing different patterning. (J) Quantification of the fluorescence intensity of GFAP staining and area above the threshold. Individual data points are representative of individual mice. (K) Quantification of the fluorescence intensity of S100B staining and area above the threshold. Individual data points are representative of individual mice. n = 6 mice for the naïve group, n = 3 mice each for OHT post-4 and 8 weeks, with 12 areas imaged in each retina for each group. Unpaired t-test, Mann–Whitney test, * p < 0.05, ** p < 0.01, *** p < 0.001, and **** p < 0.0001. Scale bar: 20 μm.
Fig 2
Fig 2. Cytoskeletal hypotrophy and fluctuation of GFAP and S100B occur during the astrocyte reactive process.
(A) Representative images showing the astrocyte cytoskeleton in an untreated (a) and transient OHT eye (b), stained with GFAP (red) and S100B (green). Astrocytes in the OHT eyes were thinner and possessed a more disordered network of intermediate filaments than those in untreated eyes. (B) Magnified grayscale images showing the intensity in the areas indicated in A. (a) GFAP in untreated astrocytes. (b) GFAP in transient OHT astrocytes. (c) S100B in untreated astrocytes. (d) S100B in transient OHT astrocytes. (C) Quantification of GFAP (a and b) and S100B (c and d) fluorescence intensity and area above threshold. n = 6 mice for the naïve group, n = 7 mice for OHT post-6 h, with 12 areas imaged in each retina for each group. (D) Fluctuation in GFAP and S100B signals during the reactive process. Individual data points representative of individual filed images are plotted. (E) GFAP (a) and S100B (b) mRNA expression levels measured using qPCR. n = 12 mice each for the naïve and OHT post-6 hour groups. Unpaired t-test, Mann–Whitney test, * p < 0.05, ** p < 0.01, *** p < 0.001, and **** p < 0.0001. Scale bar: 20 μm.
Fig 3
Fig 3. Mechanical stretch and astrocyte morphology.
(A) Astrocytes from 1-day old mice in ONH sections (upper image) and shown as isolated cells (lower image) stained with GFAP (red) and S100B (green). Nuclei stained with DAPI (blue). (B) Schematic illustrating ONH astrocyte isolation/culture procedures (a) and the stretch protocol (b). (C) The astrocytes were stretched using a sinusoidal stretch–release wave: (a) control no-stretch group; (b) 4% stretch; (c) 20% stretch. (D) Schematic of changes in cell occupancy under different stretching conditions. Gray and light blue indicate the cell-occupied area before and 1 hour after stretching. Dark blue indicates overlapping areas: (a) control group; (b) 4% stretch; (c) 20% stretch. The experiments were repeated at least three times. Scale bar: 20 μm.
Fig 4
Fig 4. Stretched ONH astrocytes display cytoskeletal reorganization.
(A) Changes in astrocyte morphology and cytoskeleton under different stretch loads, with intracellular actin visualized via infection with CellLight™ Actin-GFP, BacMam 2.0. (B) Schematic of (A). White lines represent actin fibers, white patches indicate aggregated actin protein, and the color gradient from green to blue-violet represents stretch time. (C and D) Color-coded merger of cell shapes (C) and areas (D) at each time point. ONH, optic nerve head.
Fig 5
Fig 5. Astrocyte morphology is altered by stretch-induced downregulation of S100B expression.
(A) Astrocyte cell morphology after exposure to 20%/1-Hz mechanical stretch for 1 hour. Immediately after applying the stretch stimulus, cells tended to assume a cord-like morphology (a), but most recovered their polygonal shape after 24 hours in culture (b). On occasion, cells were small in shape and poorly extended (c). Scale bar: 100 μm. (B) Viability of the stretched cells was slightly lower than that of the control group cells. (C) GFAP and S100B mRNA expression of unstretched astrocytes and of astrocytes immediately and 24 hours after stretching. One-way ANOVA, * p < 0.05, ** p < 0.01, *** p < 0.001, and **** p < 0.0001. (D and E) Astrocytes immediately after stretching lose their polygonal shape and show actin aggregation. After 24 h of culture, although most cells recovered their shape, more stress fibers were formed and the concentration of intracellular S100B decreased. The processes of poorly recovering cells were slender, and no further formation of stress fibers was observed. F-actin (green), GFAP (red), S100B (blue). Scale bar: 20 μm. Cellular experiments were repeated 3–4 times for each group.
Fig 6
Fig 6. S100B silencing leads to atrophy in ONH astrocytes.
(A and B) qPCR expression of S100B (A) and GFAP (B) in S100B siRNA-treated cells 24 h after transfection relative to control cells. (C) Cell morphology of the control siRNA-treated group and the S100B siRNA-treated group 24 hours post-transfection. Scale bar: 100 μm. (D) Merged images of S100B (green) and DAPI (cyan) staining of control siRNA-treated and S100B siRNA-treated cells 24 hours post-transfection. Scale bar: 20 μm. (E) Typical images of stained astrocytes with and without S100B silencing. S100B-silenced astrocytes developed linear atrophy. GFAP protein, but not actin protein, appeared to accumulate, but no significant stress fiber formation was observed. F-actin (green), GFAP (red), DAPI (cyan). Scale bar: 20 μm. Cellular experiments were repeated 3–4 times for each group.

Similar articles

References

    1. Weinreb RN, Aung T, Medeiros FA. The pathophysiology and treatment of glaucoma: a review. JAMA. 2014;311(18):1901–11. doi: 10.1001/jama.2014.3192 - DOI - PMC - PubMed
    1. Shalaby WS, Ahmed OM, Waisbourd M, Katz LJ. A review of potential novel glaucoma therapeutic options independent of intraocular pressure. Surv Ophthalmol. 2022;67(4):1062–80. doi: 10.1016/j.survophthal.2021.12.003 - DOI - PubMed
    1. Nemesure B, Honkanen R, Hennis A, Wu SY, Leske MC, Barbados Eye Studies Group. Incident open-angle glaucoma and intraocular pressure. Ophthalmology. 2007;114(10):1810–5. doi: 10.1016/j.ophtha.2007.04.003 - DOI - PubMed
    1. Quigley HA. 21st century glaucoma care. Eye (Lond). 2019;33(2):254–60. doi: 10.1038/s41433-018-0227-8 - DOI - PMC - PubMed
    1. Alqawlaq S, Flanagan JG, Sivak JM. All roads lead to glaucoma: induced retinal injury cascades contribute to a common neurodegenerative outcome. Exp Eye Res. 2019;183:88–97. doi: 10.1016/j.exer.2018.11.005 - DOI - PubMed

MeSH terms

Substances