. 2025 Feb 7;11(6):eads0643.
doi: 10.1126/sciadv.ads0643. Epub 2025 Feb 5.

Succinylation enables IDE to act as a hub of larval tissue destruction and adult tissue reconstruction during insect metamorphosis

Affiliations

Succinylation enables IDE to act as a hub of larval tissue destruction and adult tissue reconstruction during insect metamorphosis

Yan-Xue Li et al. Sci Adv. .

Abstract

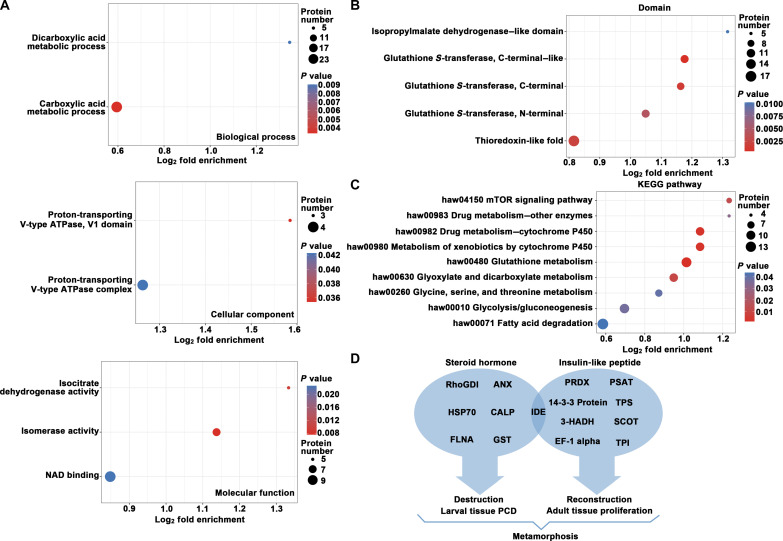
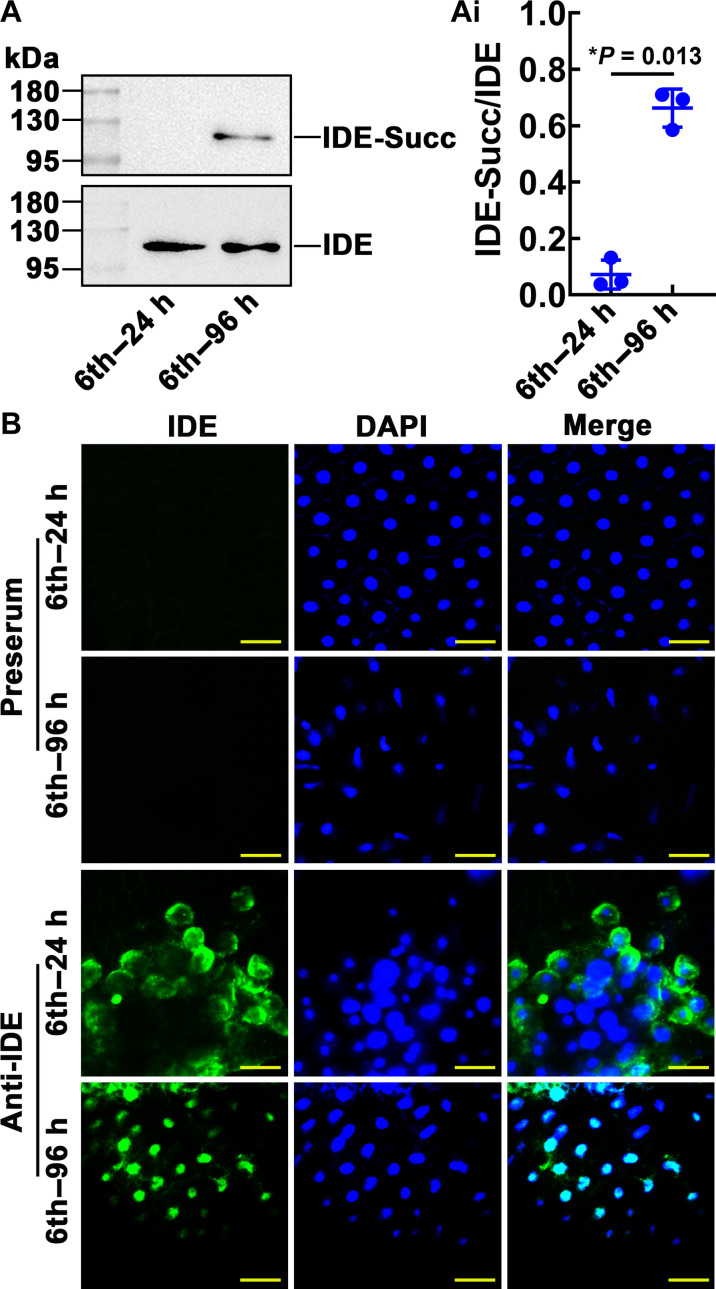
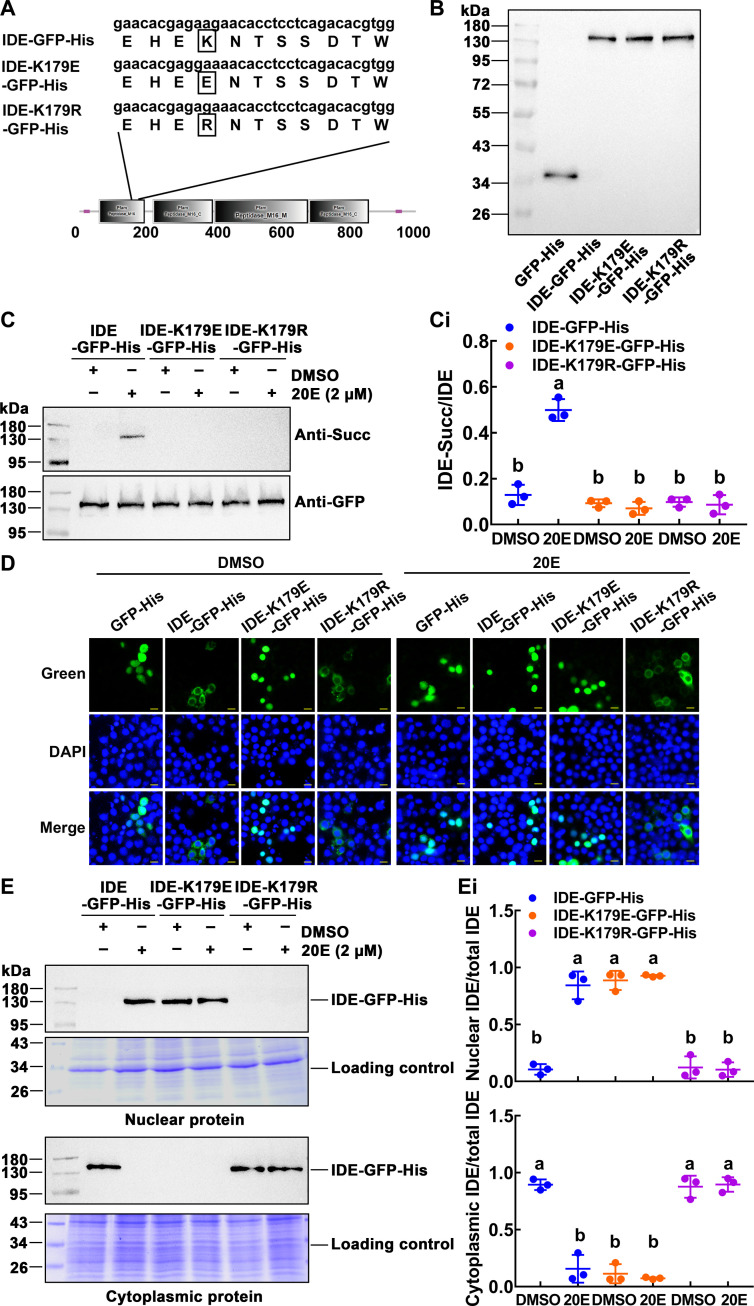
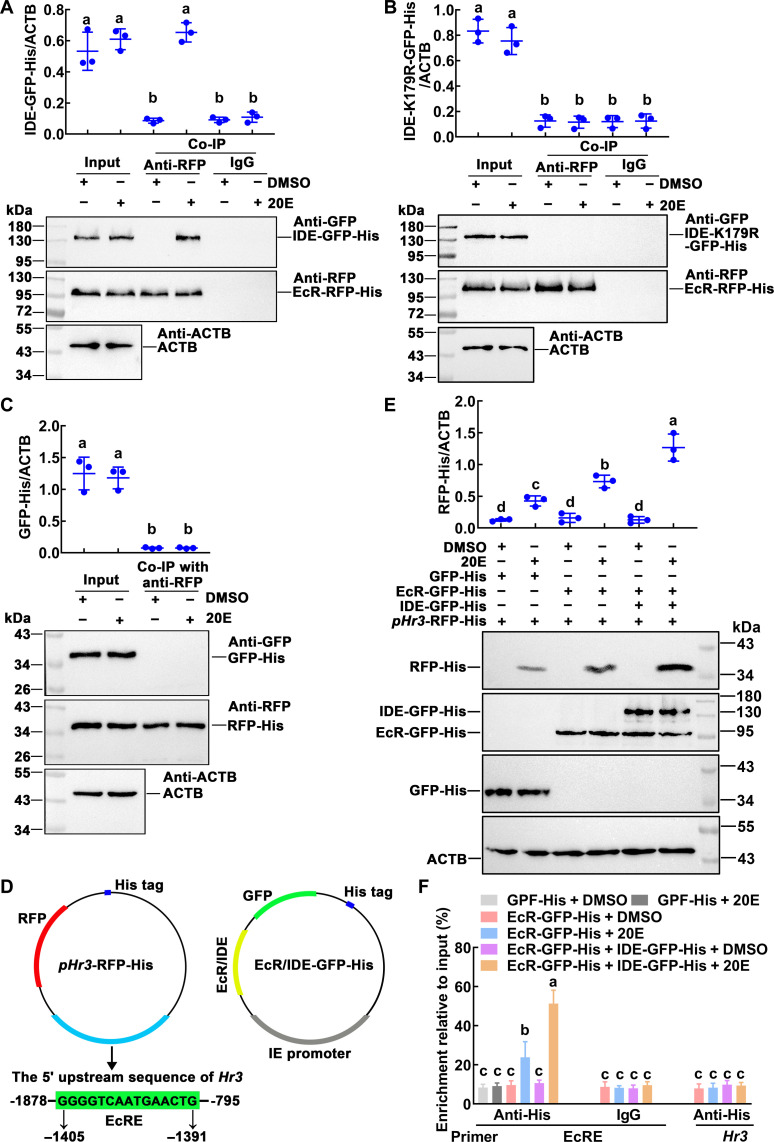
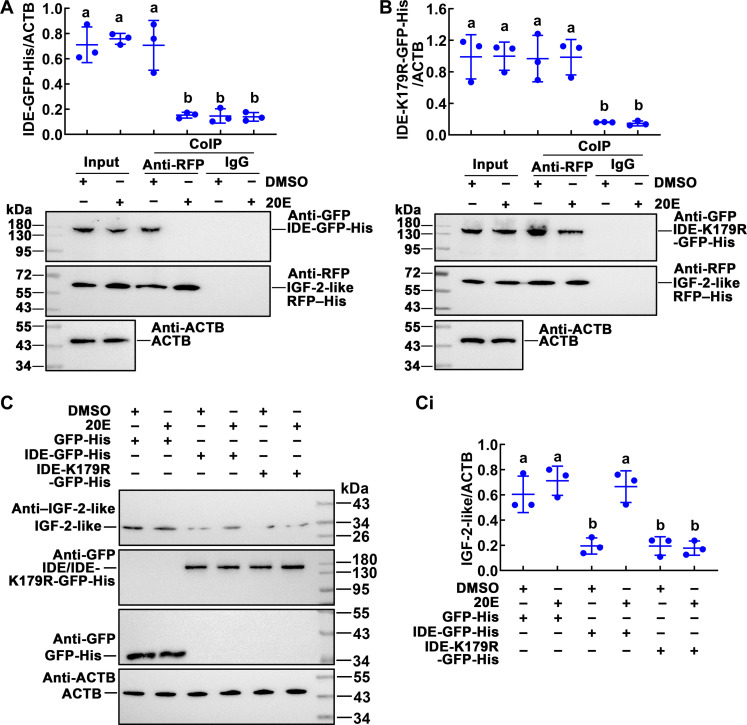
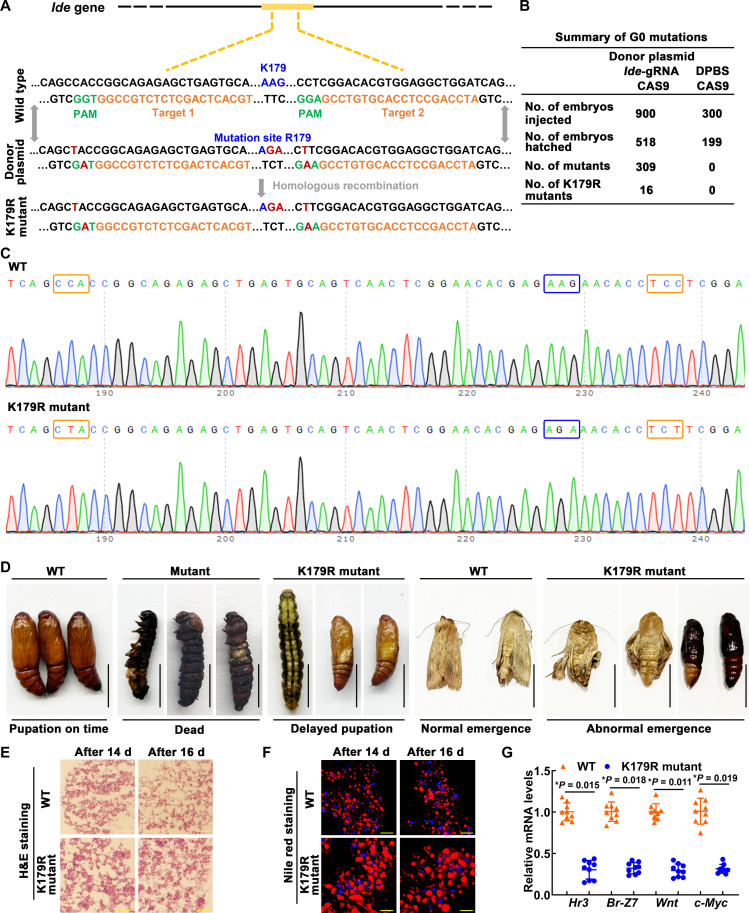
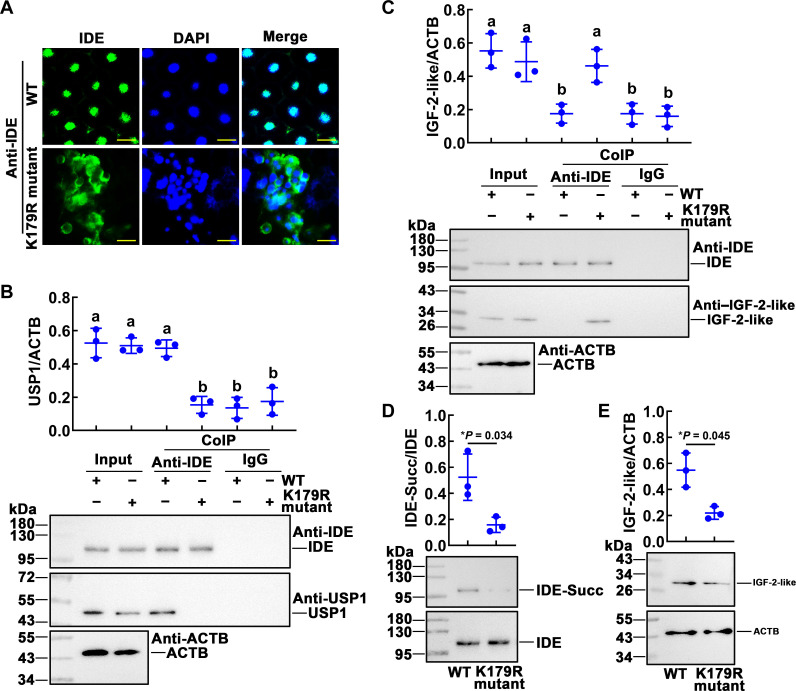
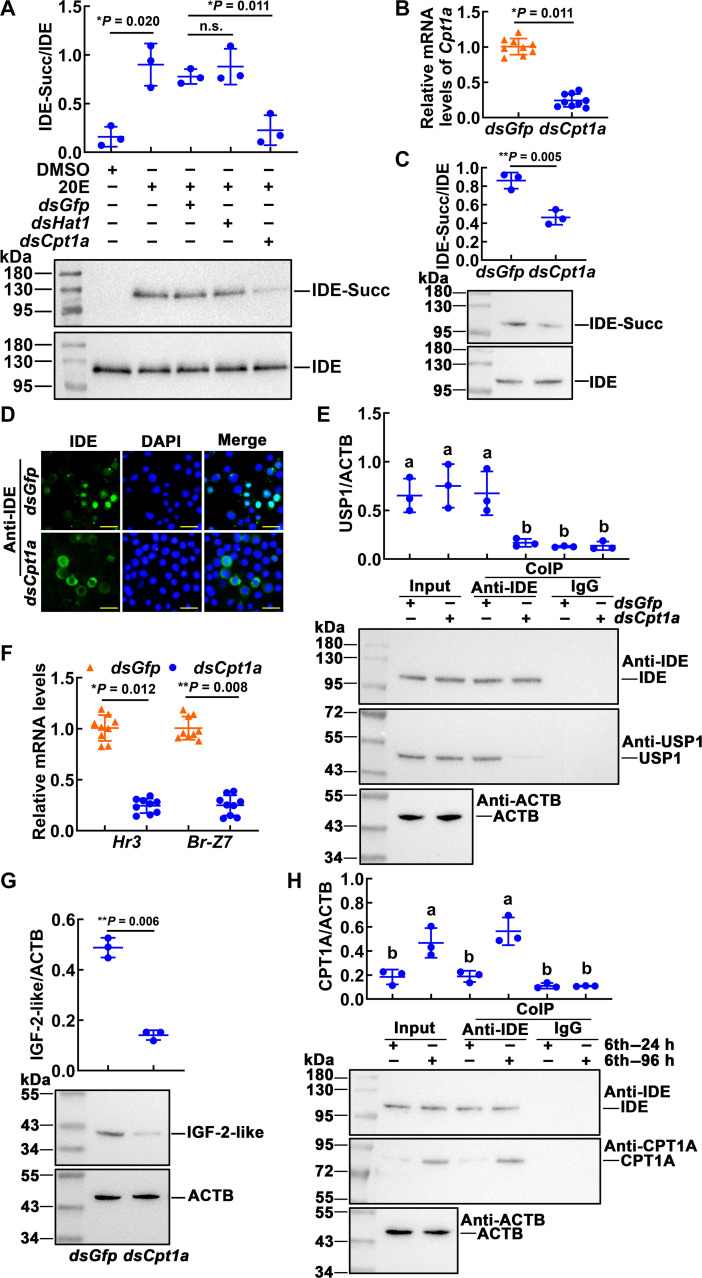
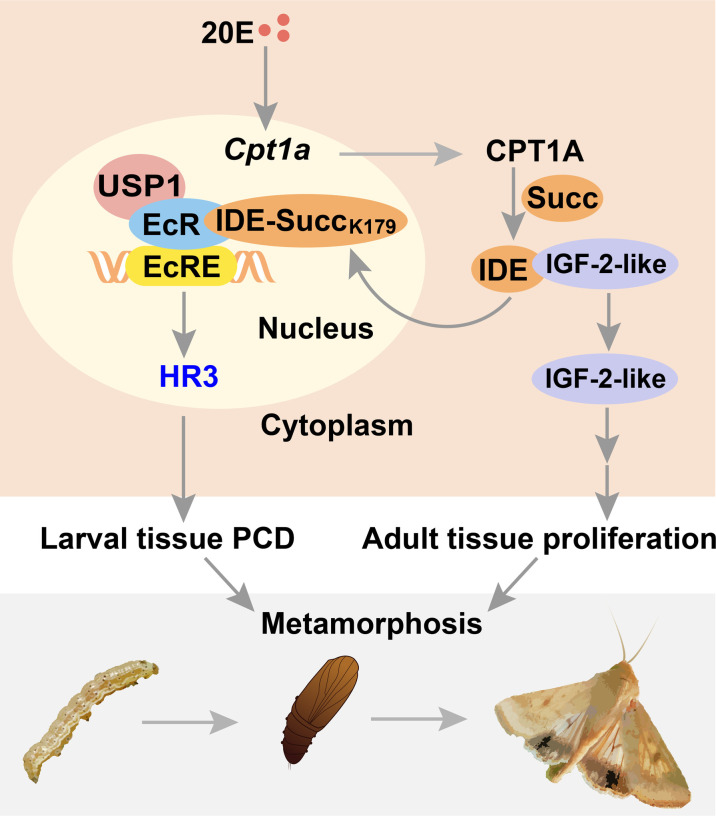
Metamorphosis is an important way for insects to adapt to the environment. In this process, larval tissue destruction regulated by 20-hydroxyecdysone (20E) and adult tissue reconstruction regulated by insulin-like peptides (ILPs) occur simultaneously, but the detailed mechanism is still unclear. Here, the results of succinylome, subcellular localization, and protein interaction analysis show that non-succinylated insulin-degrading enzyme (IDE) localizes in the cytoplasm, binds to insulin-like growth factor 2 (IGF-2-like), and degrades it. When the metamorphosis is initiated, 20E up-regulated carnitine palmitoyltransferase 1A (Cpt1a) through transcription factor Krüppel-like factor 15 (KLF15), thus increasing the level of IDE succinylation on K179. Succinylated IDE translocated from cytoplasm to nucleus, combined with ecdysone receptor to promote 20E signaling pathway, causing larval tissue destruction, while IGF-2-like was released to promote adult tissue proliferation. That is, succinylation alters subcellular localization of IDE so that it can bind to different target proteins and act as a hub of metamorphosis.


Figures

Fig. 1.
Fig. 1.. Succinylome profiling analysis identified differentially succinylated proteins during metamorphosis.
(A) Representative images of cotton worm (H. armigera) during feeding and metamorphosis stages. 6F, sixth-instar feeding (12 to 60 hours after ecdysis into sixth instar) stage; 6M, metamorphic commitment stages (72 to 120 hours after ecdysis into sixth instar). Scale bar, 1 cm. (B) Overlap of the identified, quantified, and differentially modified succinylated proteins (fold change > 1.3). (C) Up-regulated and down-regulated succinylated proteins or sites during 6M compared with 6F. (D) Percentage of subcellular localization of differentially succinylated proteins during metamorphosis. (E) Motif analyses of flanking sequence preferences for succinylation sites with 1.3-fold difference, and letter size correlates to the frequency of that amino acid residue occurring in that position. (F) Heatmap shows the frequency of amino acids near modification sites. Red and green indicate that this amino acid is more and less abundant close to the modification site, respectively. h, hours.
Fig. 2.
Fig. 2.. Enrichment analysis of succinylated protein during metamorphosis of H. armigera.
(A) The bubble diagram shows GO-based enrichment analysis of differentially succinylated proteins. ATPase, adenosine triphosphatase; NAD, nitric acid dihydrate. (B) The bubble diagram shows KEGG pathway enrichment analysis of differentially succinylated proteins. (C) Protein domain enrichment of hypersuccinylated proteins. The vertical axis is the enrichment category, and the horizontal axis is the log2 transformation value of the enrichment factor. The bubble size represents the number of enriched proteins, and the bubble color represents the significance analysis. (D) Summary of different succinylated proteins involved in ILP or steroid hormone signaling pathways.
Fig. 3.
Fig. 3.. Expression profile of succinylated IDE and IDE location.
(A) The variation of IDE succinylation levels in the fat body during larval development was detected by antibodies against succinylation. IDE-Succ was the succinylated form of IDE. The amount of IDE was affinity enriched using the antibody of IDE. [(A), i] Quantitative analysis of the IDE succinylation using ImageJ software. (B) IDE was localized in the fat body. Green fluorescence: IDE detected by anti-IDE rabbit polyclonal antibodies and Alexa Fluor 488–conjugated goat antirabbit IgG antibodies. Blue fluorescence: Nuclei stained with 4′,6-diamidino-2-phenylindole (DAPI) dihydrochloride. Preserum was used as IDE antibody control. Merge: Merging of different fluorescent signals. Scale bars, 50 μm. The error bar indicates the means ± SD of three biological replicates. The Student’s t test was used to show significant differences (*P < 0.05 and **P < 0.01). h, hours.
Fig. 4.
Fig. 4.. 20E induced the succinylation of IDE and nuclear localization.
(A) The diagram of the mutant plasmid. The IDE succinylation modification sites predicted by the succinylation proteomics, IDE-K179E-GFP-His– and IDE-K179R-GFP-His–mutated plasmids, were designed to simulate succinylation and desuccinylation. (B) Western blotting detection of overexpressed IDE and IDE mutants in HaEpi cell lines. The target protein was detected by antibody against GFP. (C) Changes of IDE succinylation by 20E stimulation. Cells were incubated in 2 μM 20E for 1 hour. [(C), i] Statistical analysis of IDE succinylation in (C). (D) The subcellular localization of IDE-GFP-His, IDE-K179E-GFP-His, and IDE-K179R-GFP-His in the cells. The cell was induced by 2 μM 20E for 1 hour. Green: Green fluorescence protein. DAPI: Nuclei stained as blue fluorescence. Scale bars, 20 μm. (E) Western blotting demonstrated the subcellular distribution of IDE-GFP-His and mutants. Coomassie Brilliant Blue staining was used as a loading control for nuclear or cytoplasmic protein quantity and quality. [(E), i] Quantitative analysis of the distribution of IDE-GFP-His and mutants in nucleus and cytoplasm. ImageJ was used to calculate the value of the band’s gray level in (E). All the experiments were repeated in triplicate, and statistical analysis was conducted using analysis of variance (ANOVA). The different lowercase letters show significant differences (P < 0.05). The bars indicate means ± SD.
Fig. 5.
Fig. 5.. 20E induced the interaction of IDE with EcR to promote the expression of Hr3.
(A and B) IDE-GFP-His coupling with EcR-RFP-His under 20E induction (2 μM for 1 hour). DMSO was used as solvent control. Input: The levels of IDE-GFP-His, IDE-K179R-GFP-His, and EcR-RFP-His in the cells detected by an antibody against GFP or RFP. ACTB was a loading control. Co-IP: Anti-RFP antibody co-immunoprecipitated EcR-RFP-His. Nonspecific mouse IgG was a negative control. Ten percent gel in SDS–polyacrylamide gel electrophoresis (SDS-PAGE). (C) Co-immunoprecipitation (Co-IP) detected the interaction of GFP-His and RFP-His. Input: The levels of GFP-His and RFP-His in the cells detected by an antibody against GFP or RFP. ACTB was a loading control. Co-IP: Anti-RFP antibody co-immunoprecipitated RFP-His. Ten percent gel in SDS-PAGE. (D) The report plasmid diagram of pHr3-RFP-His. (E) Western blotting showed the expression of the pHr3-RFP-His reporter plasmid (RFP-His) when EcR-GFP-His, IDE-GFP-His, or GFP-His was overexpressed under 20E or DMSO treatment. ACTB was a loading control. (F) Chromatin immunoprecipitation (ChIP) assays confirmed that overexpressed IDE-GFP-His enriched more fragments of EcRE motif under 20E induction. The primers EcRE are the sequences containing EcRE in the Hr3 promoter region. Primer Hr3 targeting the Hr3 coding DNA sequence (CDS) was used as a control. The data were performed by analysis of ANOVA. The different lowercase letters show significant differences (P < 0.05). Data are the means ± SD of three replicates.
Fig. 6.
Fig. 6.. Non-succinylated IDE interacted with IGF-2-like to reduce the IGF-2-like levels.
(A and B) IDE-GFP-His interacted with IGF-2-like–RFP–His under DMSO treatment. IDE-K179R-GFP-His interacted with IGF-2-like–RFP–His under 20E (2 μM for 1 hour) or DMSO treatment. Input: The levels of IDE-GFP-His, IDE-K179R-GFP-His, and IGF-2-like–RFP–His in the cells detected by an antibody against GFP or RFP. ACTB was a loading control. Co-IP: Anti-RFP antibody co-immunoprecipitated IGF-2-like–RFP–His. Nonspecific mouse IgG was a negative control. Ten percent gel in SDS-PAGE. (C) Western blotting analysis of the IGF-2-like level, after overexpression of IDE-GFP-His, IDE-K179R-GFP-His, or GFP-His. Cells were incubated in 2 μM 20E for 1 hour, and DMSO was used as solvent control. [(C), i] Quantification of the data in (C) using ImageJ software. Statistical analysis was performed using three independent replicates by ANOVA; different letters represented significant differences (P < 0.05). The bars indicate the means ± SD of three replicates.
Fig. 7.
Fig. 7.. The roles of IDE in metamorphosis were determined by CRISPR-Cas9 system.
(A) Schematic showing CRISPR-Cas9 system–mediated mutants. The black line refers to the genome of H. armigera; the yellow block represents the exon. Orange sequence, an ~20-nucleotide guide sequence; green sequence, 5′-NGG-3′ adjacent motif (PAM); blue sequence, wild sequence; red sequence, mutant sequence. (B) Summary of G0 generation. (C) Mutation sequence was identified by TA cloning and Sanger sequencing. The PAMs were marked with an orange box. The mutation site was marked with a blue box. (D) Images demonstrating WT and mutant H. armigera phenotypes. Scale bars, 1 cm. (E) The fat-body morphology was assessed by H&E staining. Scale bars, 50 μm. (F) The lipid droplet (LD) changes of the fat body were assessed by Nile red staining. Scale bars, 50 μm. d, days. (G) qRT-PCR analysis of the mRNA levels of genes in WT and mutant H. armigera. Statistical analysis was performed using Student’s t test. The bars indicate the means ± SD of three replicates.
Fig. 8.
Fig. 8.. K179 mutation blocked the 20E signaling pathway.
(A) IDE localization in the fat body of wild-type and K179R mutant larvae by immunohistochemical analysis. Green fluorescence indicates IDE, and nuclei were stained with DAPI (blue). Scale bars, 20 μm. (B) Co-IP detected the interaction of IDE and USP1. Input: The levels of IDE and USP1 in the fat body detected by an antibody against IDE or USP1. ACTB was a loading control. Co-IP: Anti-IDE antibody co-immunoprecipitated IDE. Nonspecific rabbit IgG was a negative control. Ten percent gel in SDS-PAGE. (C) K179R-IDE interacted with IGF-2-like. Input: The levels of IDE and IGF-2-like in the fat body detected by an antibody against IDE or IGF-2-like. ACTB was a loading control. Co-IP: Anti-IDE antibody co-immunoprecipitated IDE. Nonspecific rabbit IgG was a negative control. Ten percent gel in SDS-PAGE. (D) The levels of succinylated IDE in the fat body of WT and K179R mutant. IDE-Succ was the succinylated form of IDE. The amount of IDE was affinity enriched using the antibody of IDE. (E) Western blotting analysis of the IGF-2-like levels in the fat body of WT and K179R mutant. Statistical analysis was performed using ANOVA or Student’s t test; different letters represented significant differences (P < 0.05). The bars indicate the means ± SD of three replicates.
Fig. 9.
Fig. 9.. CPT1A regulated the succinylation level of IDE.
(A) Cpt1a involved in 20E-induced succinylation of IDE. The cells were transfected with 2 μg of dsRNA for 48 hours. 20E (2 μM) was added to the cells for 1 hour. dsGfp was used as the control. (B) The expression of Cpt1a in the fat body of dsRNA (1 μg per larva, 24 intervals, four times) injection. (C) Western blotting analysis of IDE succinylation levels in the fat body. The amount of IDE was affinity enriched using the antibody of IDE. (D) IDE localization in the fat body of dsRNA injection by immunohistochemical analysis. Green fluorescence indicates IDE, and nuclei were stained with DAPI (blue). Scale bars, 20 μm. Samples were taken 96 hours after the first dsRNA injection. (E) Co-IP detected the interaction of IDE and USP1. Input: The levels of IDE and USP1 in the fat body detected by an antibody against IDE or USP1. ACTB was a loading control. Co-IP: Anti-IDE antibody co-immunoprecipitated IDE. Nonspecific rabbit IgG was used as a negative control. Ten percent gel in SDS-PAGE. (F) The expression of Hr3 and Br-Z7 after knockdown of Cpt1a in the fat body. (G) Western blotting analysis of the IGF-2-like levels in the fat body of dsRNA injection. (H) Co-IP detected the interaction of IDE and CPT1A. Input: The levels of IDE and CPT1A in the fat body detected by an antibody against IDE or CPT1A. ACTB was a loading control. Co-IP: Anti-IDE antibody co-immunoprecipitated IDE. Nonspecific rabbit IgG was a negative control. Ten percent gel in SDS-PAGE. The data were analyzed by Student’s t test or ANOVA. The bars represent the means ± SD for three independent biological experiments.
Fig. 10.
Fig. 10.. A diagram illustrating succinylation of IDE hubs destruction and reconstruction to regulate metamorphosis.
Non-succinylated IDE localizes in the cytoplasm and binds to IGF-2-like. When the metamorphosis is initiated, 20E up-regulates Cpt1a expression, thus increasing the level of IDE succinylation on K179. Succinylated IDE translocates from cytoplasm to nucleus, combined with EcR complex to promote PCD of larval tissues; meanwhile, IGF-2-like is released to promote adult tissue proliferation. Therefore, succinylation alters subcellular localization of IDE, so that it can bind to different target proteins and act as a hub mediating the coordination of 20E and ILPs in insect metamorphosis.

Similar articles

References

    1. Franzetti E., Huang Z. J., Shi Y. X., Xie K., Deng X. J., Li J. P., Li Q. R., Yang W. Y., Zeng W. N., Casartelli M., Deng H. M., Cappellozza S., Grimaldi A., Xia Q., Feng Q., Cao Y., Tettamanti G., Autophagy precedes apoptosis during the remodeling of silkworm larval midgut. Apoptosis 17, 305–324 (2012). - PubMed
    1. Zhou X., Riddiford L. M., Broad specifies pupal development and mediates the ‘status quo’ action of juvenile hormone on the pupal-adult transformation in Drosophila and Manduca. Development 129, 2259–2269 (2002). - PubMed
    1. Chen C. H., Pan J., Di Y. Q., Liu W., Hou L., Wang J. X., Zhao X. F., Protein kinase C delta phosphorylates ecdysone receptor B1 to promote gene expression and apoptosis under 20-hydroxyecdysone regulation. Proc. Natl. Acad. Sci. U.S.A. 114, E7121–E7130 (2017). - PMC - PubMed
    1. Wang X. P., Huang Z., Li Y. L., Jin K. Y., Dong D. J., Wang J. X., Zhao X. F., Krüppel-like factor 15 integrated autophagy and gluconeogenesis to maintain glucose homeostasis under 20-hydroxyecdysone regulation. PLOS Genet. 18, e1010229 (2022). - PMC - PubMed
    1. Truman J. W., Riddiford L. M., The evolution of insect metamorphosis: A developmental and endocrine view. Philos. Trans. R. Soc. Lond. B Biol. Sci. 374, 20190070 (2019). - PMC - PubMed

MeSH terms

LinkOut - more resources