

Dynamics of influenza transmission in vampire bats revealed by longitudinal monitoring and a large-scale anthropogenic perturbation
- PMID: 39908385
- PMCID: PMC11797540
- DOI: 10.1126/sciadv.ads1267
Dynamics of influenza transmission in vampire bats revealed by longitudinal monitoring and a large-scale anthropogenic perturbation
Abstract
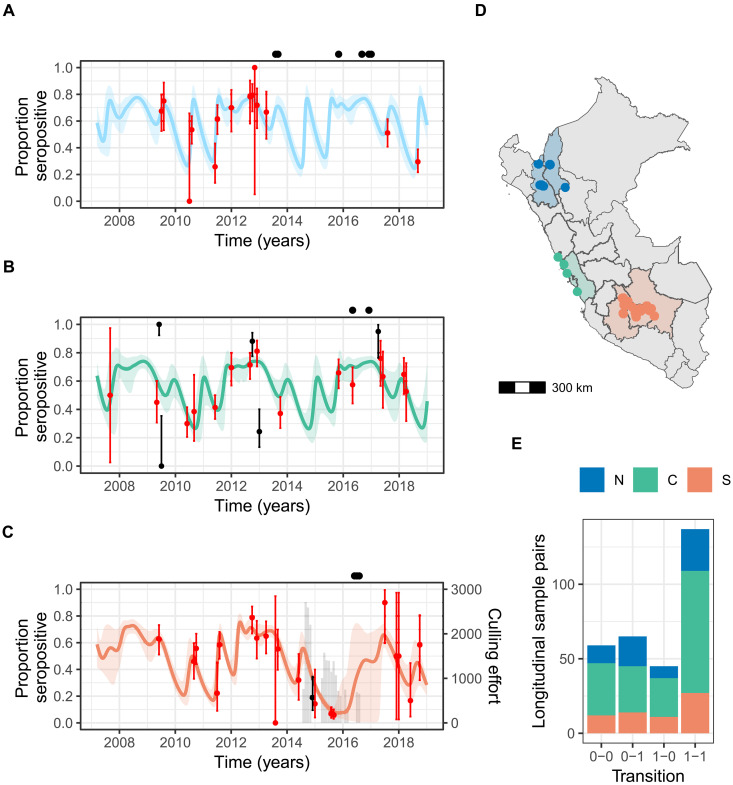
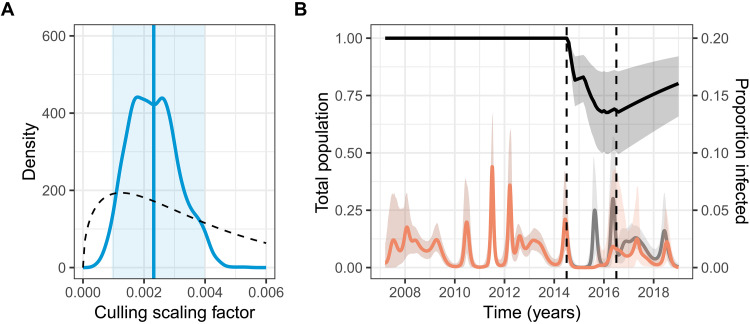
Interrupting pathogen transmission between species is a priority strategy to mitigate zoonotic threats. However, avoiding counterproductive interventions requires knowing animal reservoirs of infection and the dynamics of transmission within them, neither of which are easily ascertained from the cross-sectional surveys that now dominate investigations into newly discovered viruses. We used biobanked sera and metagenomic data to reconstruct the transmission of recently discovered bat-associated influenza virus (BIV; H18N11) over 12 years in three zones of Peru. Mechanistic models fit under a Bayesian framework, which enabled joint inference from serological and molecular data, showed that common vampire bats maintain BIV independently of the now assumed fruit bat reservoir through immune waning and seasonal transmission pulses. A large-scale vampire bat cull targeting rabies incidentally halved BIV transmission, confirming vampire bats as maintenance hosts. Our results show how combining field studies, perturbation responses, and multi-data-type models can elucidate pathogen dynamics in nature and reveal pathogen-dependent effects of interventions.
Figures
Similar articles
-
Enzootic and epizootic rabies associated with vampire bats, peru.Emerg Infect Dis. 2013;19(9):1463-69. doi: 10.3201/eid1809.130083. Emerg Infect Dis. 2013. PMID: 23969087 Free PMC article.
-
Resolving the roles of immunity, pathogenesis, and immigration for rabies persistence in vampire bats.Proc Natl Acad Sci U S A. 2013 Dec 17;110(51):20837-42. doi: 10.1073/pnas.1308817110. Epub 2013 Dec 2. Proc Natl Acad Sci U S A. 2013. PMID: 24297874 Free PMC article.
-
Effects of culling vampire bats on the spatial spread and spillover of rabies virus.Sci Adv. 2023 Mar 10;9(10):eadd7437. doi: 10.1126/sciadv.add7437. Epub 2023 Mar 10. Sci Adv. 2023. PMID: 36897949 Free PMC article.
-
Chiropteran influenza viruses: flu from bats or a relic from the past?Curr Opin Virol. 2016 Feb;16:114-119. doi: 10.1016/j.coviro.2016.02.003. Epub 2016 Mar 3. Curr Opin Virol. 2016. PMID: 26947779 Review.
-
Bat Influenza Viruses: Current Status and Perspective.Viruses. 2021 Mar 25;13(4):547. doi: 10.3390/v13040547. Viruses. 2021. PMID: 33805956 Free PMC article. Review.
References
-
- Viana M., Cleaveland S., Matthiopoulos J., Halliday J., Packer C., Craft M. E., Hampson K., Czupryna A., Dobson A. P., Dubovi E. J., Ernest E., Fyumagwa R., Hoare R., Hopcraft J. G. C., Horton D. L., Kaare M. T., Kanellos T., Lankester F., Mentzel C., Mlengeya T., Mzimbiri I., Takahashi E., Willett B., Haydon D. T., Lembo T., Dynamics of a morbillivirus at the domestic–wildlife interface: Canine distemper virus in domestic dogs and lions. Proc. Natl. Acad. Sci. U.S.A. 112, 1464–1469 (2015). - PMC - PubMed
-
- Berguido F. J., Burbelo P. D., Bortolami A., Bonfante F., Wernike K., Hoffmann D., Balkema-Buschmann A., Beer M., Dundon W. G., Lamien C. E., Cattoli G., Serological detection of SARS-CoV-2 antibodies in naturally-infected mink and other experimentally-infected animals. Viruses 13, 1649 (2021). - PMC - PubMed
-
- Palmer M. V., Martins M., Falkenberg S., Buckley A., Caserta L. C., Mitchell P. K., Cassmann E. D., Rollins A., Zylich N. C., Renshaw R. W., Guarino C., Wagner B., Lager K., Diel D. G., Susceptibility of white-tailed deer (Odocoileus virginianus) to SARS-CoV-2. J. Virol. 95, e00083-21 (2021). - PMC - PubMed
MeSH terms
Grants and funding
LinkOut - more resources
Full Text Sources
Medical
