

Case Reports
doi: 10.1056/NEJMoa2411507.
CD4+ T-Cell Lymphoma Harboring a Chimeric Antigen Receptor Integration in TP53
Affiliations
- PMID: 39908432
- PMCID: PMC11801235
- DOI: 10.1056/NEJMoa2411507
Item in Clipboard
Case Reports
CD4+ T-Cell Lymphoma Harboring a Chimeric Antigen Receptor Integration in TP53
N Engl J Med.
.
Abstract
Malignant T-cell transformation after chimeric antigen receptor (CAR) T-cell therapy has been described, but the contribution of CAR integration to oncogenesis is not clear. Here we report a case of a T-cell lymphoma harboring a lentiviral integration in a known tumor suppressor, TP53, which developed in a patient with multiple myeloma after B-cell maturation antigen (BCMA) CAR T-cell therapy.
Copyright © 2025 Massachusetts Medical Society.
Figures
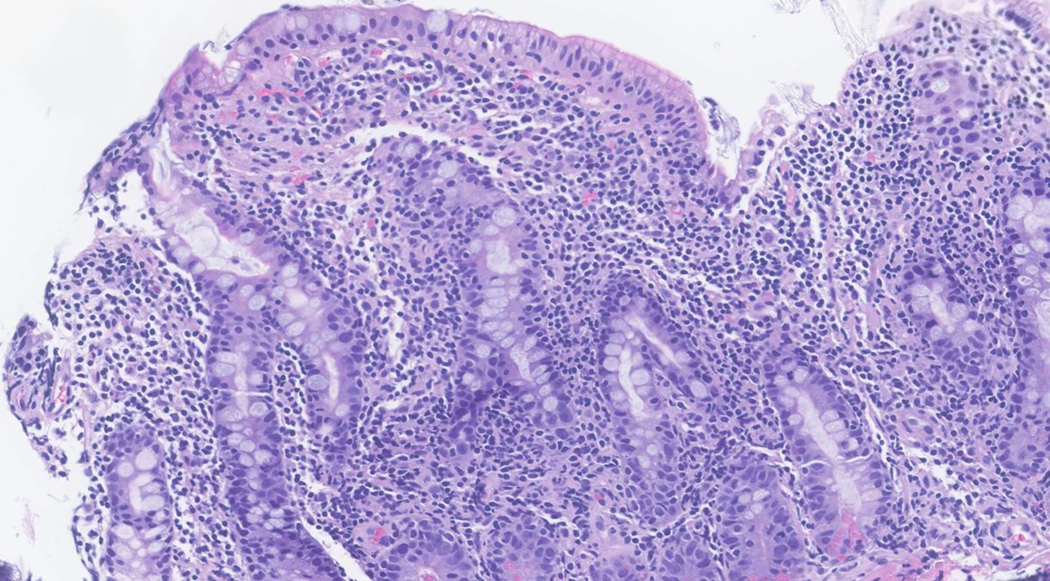
A) Dense lymphocytic infiltrate that is B) CD4 positive by immunohistochemistry. C) p53 staining shows dim or absent expression in T cell infiltrate; low power with inset. E-F) Phosphorylated STAT3 (pSTAT3) IHC showed positive staining.

A) Dense lymphocytic infiltrate that is B) CD4 positive by immunohistochemistry. C) p53 staining shows dim or absent expression in T cell infiltrate; low power with inset. E-F) Phosphorylated STAT3 (pSTAT3) IHC showed positive staining.

A) Dense lymphocytic infiltrate that is B) CD4 positive by immunohistochemistry. C) p53 staining shows dim or absent expression in T cell infiltrate; low power with inset. E-F) Phosphorylated STAT3 (pSTAT3) IHC showed positive staining.

A) Dense lymphocytic infiltrate that is B) CD4 positive by immunohistochemistry. C) p53 staining shows dim or absent expression in T cell infiltrate; low power with inset. E-F) Phosphorylated STAT3 (pSTAT3) IHC showed positive staining.

A) Dense lymphocytic infiltrate that is B) CD4 positive by immunohistochemistry. C) p53 staining shows dim or absent expression in T cell infiltrate; low power with inset. E-F) Phosphorylated STAT3 (pSTAT3) IHC showed positive staining.

A. Frequency TCR clones by VDJ immunosequencing in peripheral blood and duodenal biopsy at indicated days post CAR T cell infusion. Selected clones are among the ten most abundant in at least one timepoint. The most abundant clonotype in the duodenal biopsy is highlighted in red. 2B. Frequency of CAR integration sites in the duodenal biopsy sample. Cell clone sizes associated with unique integration sites are quantified using the SonicAbundance method. * Indicates an integration site within a gene; ~ indicates an annotated cancer-associated gene. Numbers below gene names indicate chromosome and chromosomal positions. LowAbund indicates pooled low abundance integration sites. C. Variant allele frequency (VAF) of indicated DNTM3a and SOCS1 mutations in peripheral blood and duodenal biopsy at indicated days post CAR T cell infusion; peripheral blood sample results are from whole genome sequencing and the duodenal biopsy from whole exome sequencing. D. Single cell RNA expression dot plots of mean expression and frequency of indicated genes (x axis) by leiden cluster (y axis).

A. Frequency TCR clones by VDJ immunosequencing in peripheral blood and duodenal biopsy at indicated days post CAR T cell infusion. Selected clones are among the ten most abundant in at least one timepoint. The most abundant clonotype in the duodenal biopsy is highlighted in red. 2B. Frequency of CAR integration sites in the duodenal biopsy sample. Cell clone sizes associated with unique integration sites are quantified using the SonicAbundance method. * Indicates an integration site within a gene; ~ indicates an annotated cancer-associated gene. Numbers below gene names indicate chromosome and chromosomal positions. LowAbund indicates pooled low abundance integration sites. C. Variant allele frequency (VAF) of indicated DNTM3a and SOCS1 mutations in peripheral blood and duodenal biopsy at indicated days post CAR T cell infusion; peripheral blood sample results are from whole genome sequencing and the duodenal biopsy from whole exome sequencing. D. Single cell RNA expression dot plots of mean expression and frequency of indicated genes (x axis) by leiden cluster (y axis).

A. Frequency TCR clones by VDJ immunosequencing in peripheral blood and duodenal biopsy at indicated days post CAR T cell infusion. Selected clones are among the ten most abundant in at least one timepoint. The most abundant clonotype in the duodenal biopsy is highlighted in red. 2B. Frequency of CAR integration sites in the duodenal biopsy sample. Cell clone sizes associated with unique integration sites are quantified using the SonicAbundance method. * Indicates an integration site within a gene; ~ indicates an annotated cancer-associated gene. Numbers below gene names indicate chromosome and chromosomal positions. LowAbund indicates pooled low abundance integration sites. C. Variant allele frequency (VAF) of indicated DNTM3a and SOCS1 mutations in peripheral blood and duodenal biopsy at indicated days post CAR T cell infusion; peripheral blood sample results are from whole genome sequencing and the duodenal biopsy from whole exome sequencing. D. Single cell RNA expression dot plots of mean expression and frequency of indicated genes (x axis) by leiden cluster (y axis).

A. Frequency TCR clones by VDJ immunosequencing in peripheral blood and duodenal biopsy at indicated days post CAR T cell infusion. Selected clones are among the ten most abundant in at least one timepoint. The most abundant clonotype in the duodenal biopsy is highlighted in red. 2B. Frequency of CAR integration sites in the duodenal biopsy sample. Cell clone sizes associated with unique integration sites are quantified using the SonicAbundance method. * Indicates an integration site within a gene; ~ indicates an annotated cancer-associated gene. Numbers below gene names indicate chromosome and chromosomal positions. LowAbund indicates pooled low abundance integration sites. C. Variant allele frequency (VAF) of indicated DNTM3a and SOCS1 mutations in peripheral blood and duodenal biopsy at indicated days post CAR T cell infusion; peripheral blood sample results are from whole genome sequencing and the duodenal biopsy from whole exome sequencing. D. Single cell RNA expression dot plots of mean expression and frequency of indicated genes (x axis) by leiden cluster (y axis).
References
Publication types
MeSH terms
Substances
Grants and funding
LinkOut - more resources
Full Text Sources
Medical
Research Materials
Miscellaneous