. 2025 Feb 18;19(6):6412-6425.
doi: 10.1021/acsnano.4c16562. Epub 2025 Feb 5.

Apolipoprotein Fusion Enables Spontaneous Functionalization of mRNA Lipid Nanoparticles with Antibody for Targeted Cancer Therapy

Affiliations

Apolipoprotein Fusion Enables Spontaneous Functionalization of mRNA Lipid Nanoparticles with Antibody for Targeted Cancer Therapy

Wonbeom Park et al. ACS Nano. .

Abstract

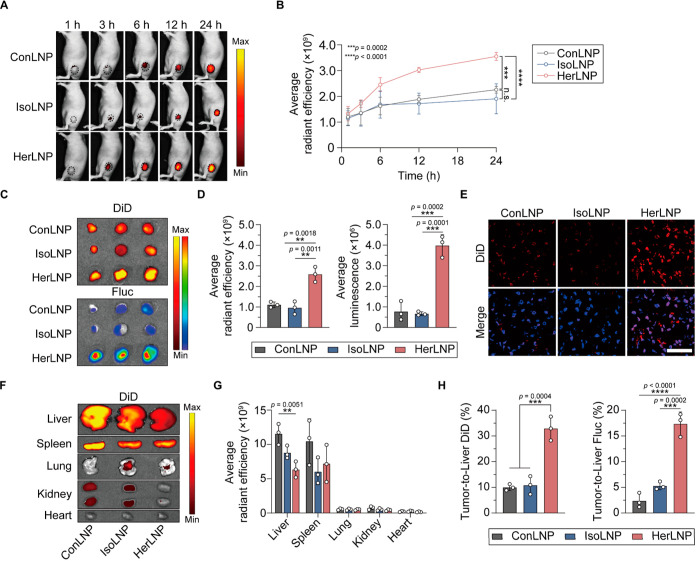
The mRNA-lipid nanoparticles (mRNA@LNPs) offer a novel opportunity to treat targets previously considered undruggable. Although antibody conjugation is crucial for enhancing the specificity, delivery efficiency, and minimizing the toxicity of mRNA therapeutics, current chemical conjugation methods are complex and produce heterogeneous particles with misoriented antibodies. In this work, we introduce a chemical-free approach to functionalize mRNA@LNPs with antibodies, mimicking protein corona formation for targeted mRNA delivery. By fusing apolipoprotein to the Fc domain of a targeting antibody, we enabled the antibody to spontaneously display on the surface of mRNA@LNPs without altering the existing LNP process or employing complex chemical conjugation techniques. We demonstrated precise protein expression using trastuzumab-bound mRNA@LNPs, facilitating specific mRNA expression in HER2-positive cancer cells. mRNA was efficiently delivered to the tumor site after intravenous administration. While the control LNPs lacking targeting antibodies caused acute liver toxicity, trastuzumab-displayed LNPs showed no systemic toxicity. The tumor-specific delivery of p53 tumor suppressor mRNA led to the complete regression of cancer cells. Thus, apolipoprotein fusion enables a straightforward and scalable production of antibody-functionalized mRNA@LNPs, offering significant therapeutic potential in gene therapy.

Keywords: antibody; apolipoprotein; cancer; gene therapy; lipid nanoparticle (LNP); mRNA; targeted delivery.


Conflict of interest statement

The authors declare no competing financial interest.

Figures

Figure 1
Figure 1
Construction and characterization of the GrAb platform. (A) Schematic illustration and (B) the expression vector of the Grab Antibody (GrAb). (C) SDS-PAGE analysis of purified GrAb stained with Coomassie blue. ApoA1 and ApoE3 lanes were cropped from different gel. (D) Schematic illustration of the GrAb-LNP formation. Incubation of mRNA@LNP with GrAb at 37 °C, 30 min, formation of GrAb-LNP via apolipoprotein. (E) Z-average size and zeta-potential of GrAb-LNPs with different LP ratios measured by DLS. (F) Encapsulation efficiency of mRNA of GrAb-LNPs with different LP ratios was assessed by the RiboGreen assay. (G) Z-average size of LNPs and GrAb-LNPs measured at different time points after storage at 4 °C. (H) SDS-PAGE analysis of proteins attached to LNPs after purification with size exclusion chromatography using Superdex 200 Increase 10/300 GL column. (F: fraction, m: marker of protein molecular weight) (I) The percentage of trastuzumab and its GrAb form incorporated into LNPs was quantified by measuring the Cy5 fluorescence remaining in protein after amicon filtering to remove unbound protein. (J) Quantification of GrAb assembled to the surface of a single LNP through NTA analysis. (K) Representative cryo-TEM image of LNPs and LP ratio 10,000:1 GrAb-LNPs. Scale bar: 100 nm. All data are means ± SD; n = 3. Statistical significance (****P < 0.0001) was determined by the Tukey–Kramer posthoc test.
Figure 2
Figure 2
Receptor-mediated cellular binding and uptake of GrAb-LNPs. (A) Schematic illustration of the interaction of HER2-positive cells with HerLNPs, in contrast to the lack of binding to the IsoLNPs control. (B) Representative flow cytometer histograms and DiD mean fluorescence intensity (MFI) of Con, Iso, and HerLNPs binding to HER2-positive SK-OV-3 cancer cells. (C) Pretreatment of SK-OV-3 with trastuzumab. (D) The cellular uptake of GrAb-LNPs following preincubation with 50% mouse serum at different time points. (E) Representative fluorescence image of Cy5-Fluc mRNA (red color) encapsulated in Con, Iso, and HerLNPs followed by uptake by SK-OV-3 cells. (F) Pretreatment of trastuzumab before Cy5-Fluc mRNA measurement. Scale bar: 50 μm. (G) Luminescence of SK-OV-3 cells after treatment with Fluc mRNA encapsulated in Con, Iso, and HerLNPs. (H) Western blot images of p53 in SK-OV-3 cells after treatment with p53 mRNA encapsulated in Con, Iso, and HerLNPs. (I) Comparison of LNPs for p53 mRNA-mediated cell death. Cells were treated with different concentrations of p53 mRNA encapsulated in Con, Iso, and HerLNPs, followed by CCK-8 cell viability assessment. All data are means ± SD; n = 3. Statistical significance (n.s.P > 0.05, *P < 0.05, **P < 0.01, ****P < 0.0001) was determined by the Tukey–Kramer posthoc test.
Figure 3
Figure 3
Evaluation of in vivo mRNA delivery by GrAb-LNPs targeting HER2-expressing tumors. (A) Noninvasive NIRF images of SK-OV-3 tumor-bearing mice treated with Fluc@ConLNPs, Fluc@IsoLNPs, or Fluc@HerLNPs (5 mg/kg based on mRNA content). (B) Quantitative analysis of radiation efficiency in tumor tissues at different time points using Living Image software. (C) Ex vivo fluorescence and luminescence images of harvested tumors 24 h after injection. (D) Quantitative analysis of the average radiant efficiency and luminescence intensity of the collected tumors. (E) Histological fluorescence images of tumor tissues. Scale bar: 100 μm. (F) Ex vivo fluorescence images of harvested organs. (G) Quantification of the average radiation efficiency in each organ. (H) Quantification of DiD and Fluc percentages in the tumor relative to those in the liver (n = 3). All data are presented as mean ± SD; n = 3. Statistical significance (n.s.P > 0.05, *P < 0.05, **P < 0.01, ***P < 0.001, ****P < 0.0001) was determined by the Tukey–Kramer posthoc test.
Figure 4
Figure 4
Therapeutic effects of p53 mRNA delivered via HER2-targeting LNP. (A) Experimental scheme to evaluate the invivo antitumor effect of p53@HerLNPs. (B) Tumor growth curves over 21 days after SK-OV-3 injection for each group (PBS: black, Fluc@HerLNPs: green, p53@ConLNPs: blue, p53@HerLNPs: red, n = 5). (C) Photographs of harvested tumor tissue on day 21 (scale bar: 500 mm, n = 5). (D) Measured weights of extracted tumor tissues on day 21. (E) Western blot analysis and corresponding quantified graph showing p53 protein levels in tumor tissues (n = 3). (F) Representative fluorescence images of p53 proteins (red) in tumor tissues (scale bar: 200 μm). (G) TUNEL, and H&E-stained tumor tissues showing apoptotic cell death and tissue damage (scale bar: 200 μm). All data are expressed as mean ± SD. Statistical significance (n.s.P > 0.05, *P < 0.05, **P < 0.01, ****P < 0.0001) was determined by the Tukey–Kramer posthoc test.
Figure 5
Figure 5
In vivo safety of GrAb-LNPs. (A) Relative body weight changes during the 21 day treatment period compared to the first day of treatment according to the schedule shown in Figure 4A,B. (B) Indicators of liver toxicity, including AST, ALT, and ALP levels. (C) Other systemic toxicity indicators from blood chemistry analysis of serum isolated from LNP-treated mice. (D) Complete blood analysis, including the concentration of red blood cells (RBC), hemoglobin (HGB), hematocrit (HCT), mean corpuscular hemoglobin concentration (MCHC), white blood cells (WBC), neutrophils (NEU), lymphocytes (LYM), and monocytes (MONO). (E) Representative H&E histological images of liver isolated from mice treated with p53@ConLNPs, Fluc@HerLNPs, and p53@HerLNPs on day 21. The yellow arrows indicate the structural abnormalities of the tissues. Scale bar: 200 μm. All data are expressed as mean ± SD; n = 5. Statistical significance (***P < 0.001, ****P < 0.0001) was determined by the Tukey–Kramer posthoc test.

References

    1. Liu C.; Shi Q.; Huang X.; Koo S.; Kong N.; Tao W. mRNA-based cancer therapeutics. Nat. Rev. Cancer 2023, 23 (8), 526–543. 10.1038/s41568-023-00586-2. - DOI - PubMed
    1. Qin S.; Tang X.; Chen Y.; Chen K.; Fan N.; Xiao W.; Zheng Q.; Li G.; Teng Y.; Wu M.; Song X. mRNA-based therapeutics: powerful and versatile tools to combat diseases. Signal Transduction Targeted Ther. 2022, 7 (1), 166.10.1038/s41392-022-01007-w. - DOI - PMC - PubMed
    1. Chehelgerdi M.; Chehelgerdi M. The use of RNA-based treatments in the field of cancer immunotherapy. Mol. Cancer 2023, 22 (1), 106.10.1186/s12943-023-01807-w. - DOI - PMC - PubMed
    1. Huang X.; Kong N.; Zhang X.; Cao Y.; Langer R.; Tao W. The landscape of mRNA nanomedicine. Nat. Med. 2022, 28 (11), 2273–2287. 10.1038/s41591-022-02061-1. - DOI - PubMed
    1. Hou X.; Zaks T.; Langer R.; Dong Y. Lipid nanoparticles for mRNA delivery. Nat. Rev. Mater. 2021, 6 (12), 1078–1094. 10.1038/s41578-021-00358-0. - DOI - PMC - PubMed

Publication types