. 2025 Mar:80:103508.
doi: 10.1016/j.redox.2025.103508. Epub 2025 Feb 1.

Hsa-miR-532-3p protects human decidual mesenchymal stem cells from oxidative stress in recurrent spontaneous abortion via targeting KEAP1

Affiliations

Hsa-miR-532-3p protects human decidual mesenchymal stem cells from oxidative stress in recurrent spontaneous abortion via targeting KEAP1

Hong Zhou et al. Redox Biol. 2025 Mar.

Abstract

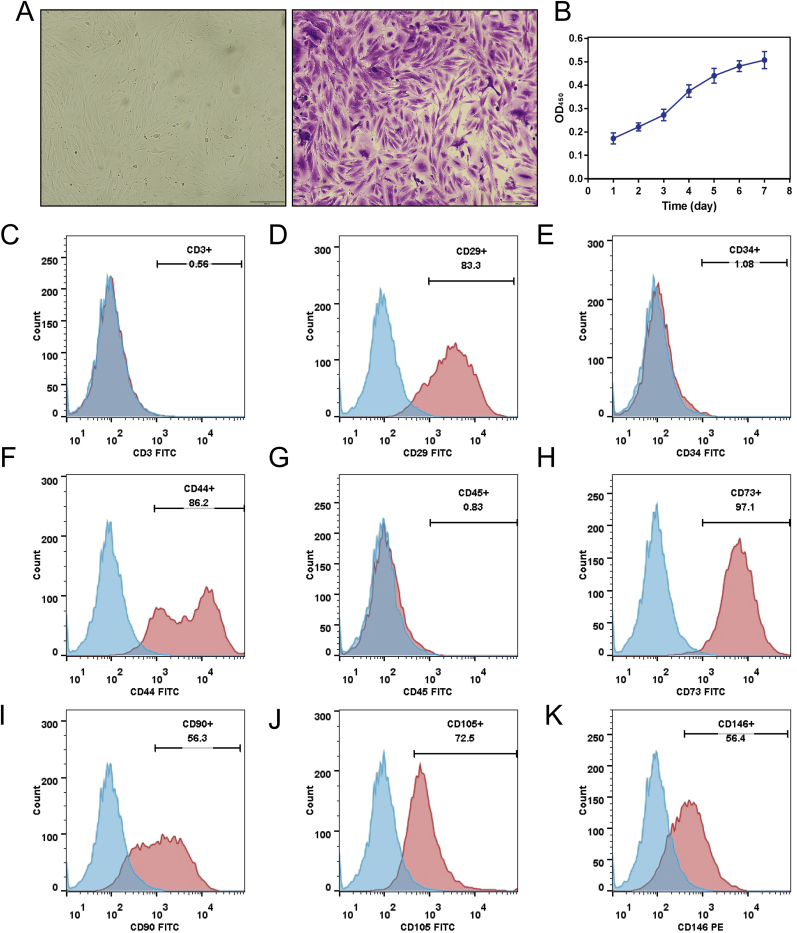
Background: Human decidual mesenchymal stem cells (hDMSCs) play crucial roles in pregnancy. The decreased resistance of hDMSCs to oxidative stress is a key factor contributing to recurrent spontaneous abortion (RSA). miRNAs have essential functions in the proliferation and apoptosis of decidual tissues. However, the miRNAs involved in regulating oxidative stress in hDMSCs remain unclear.

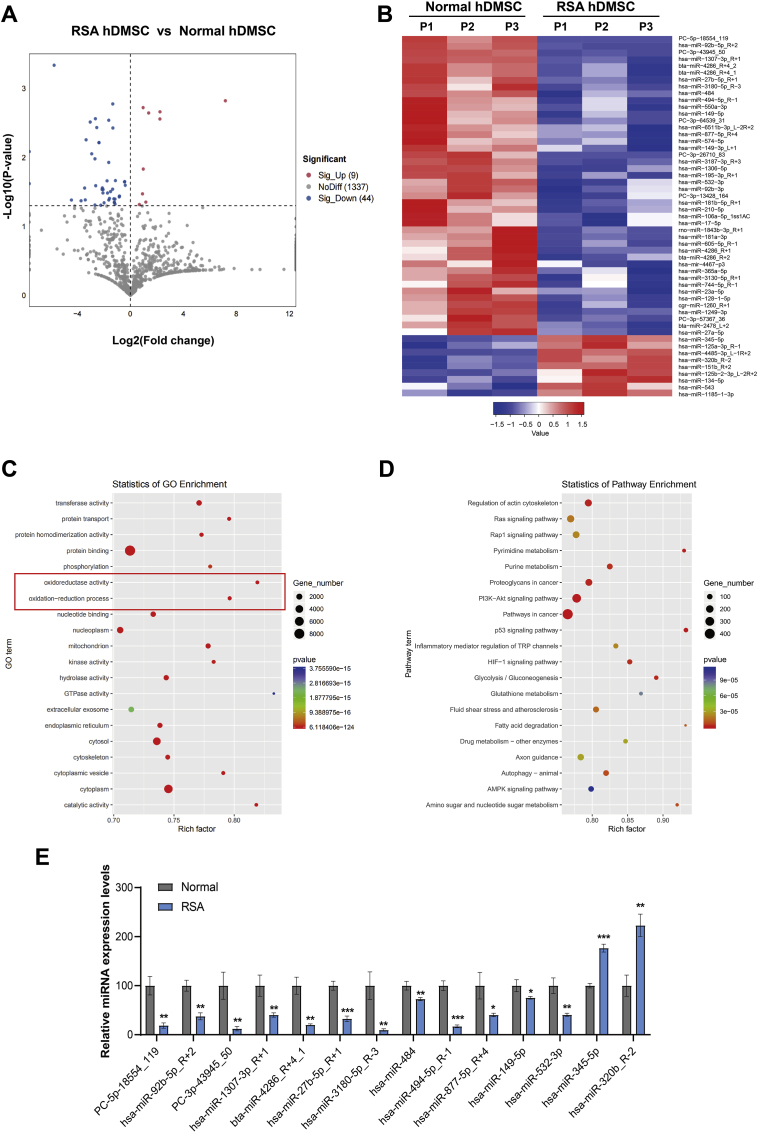
Methods: Decidual tissues and hDMSCs were collected from patients with RSA and early pregnancy miscarriages. We assessed the antioxidant capacity of hDMSCs in both groups by detecting relevant indicators. Furthermore, differentially expressed miRNAs in hDMSCs were analyzed through miRNA sequencing. We evaluated the interaction between hsa-miR-532-3p and KEAP1 using a luciferase reporter assay. A mouse model of RSA was constructed for confirmation. Finally, we analyzed the correlations between serum hsa-miR-532-3p levels and the clinical features of pregnant women with RSA.

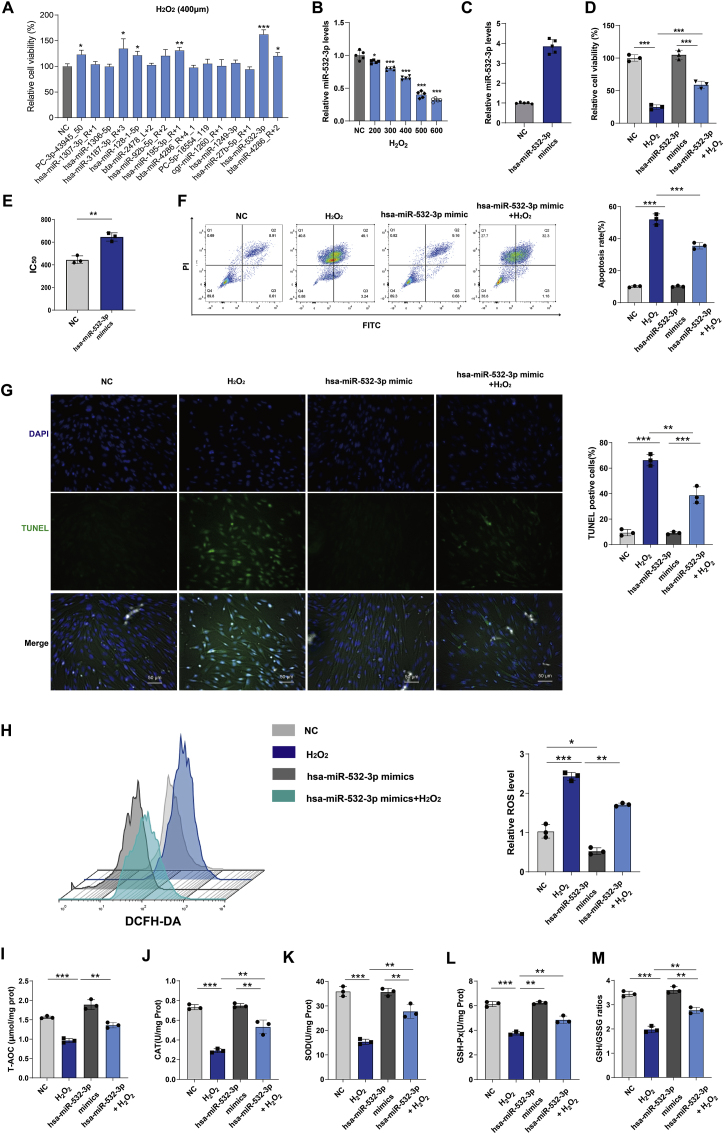
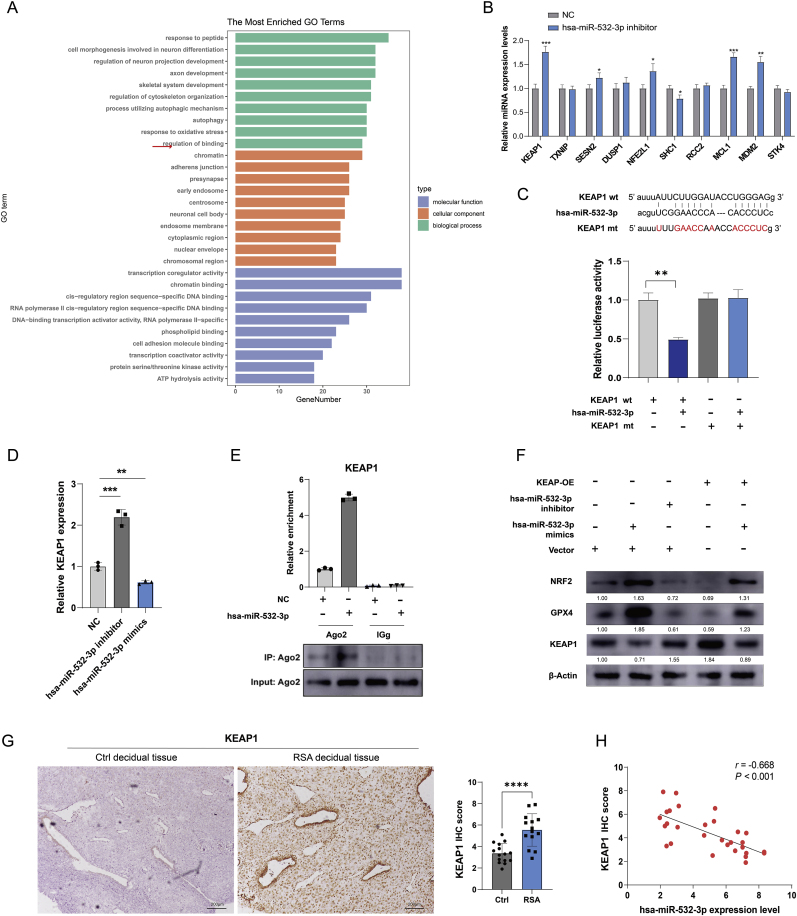
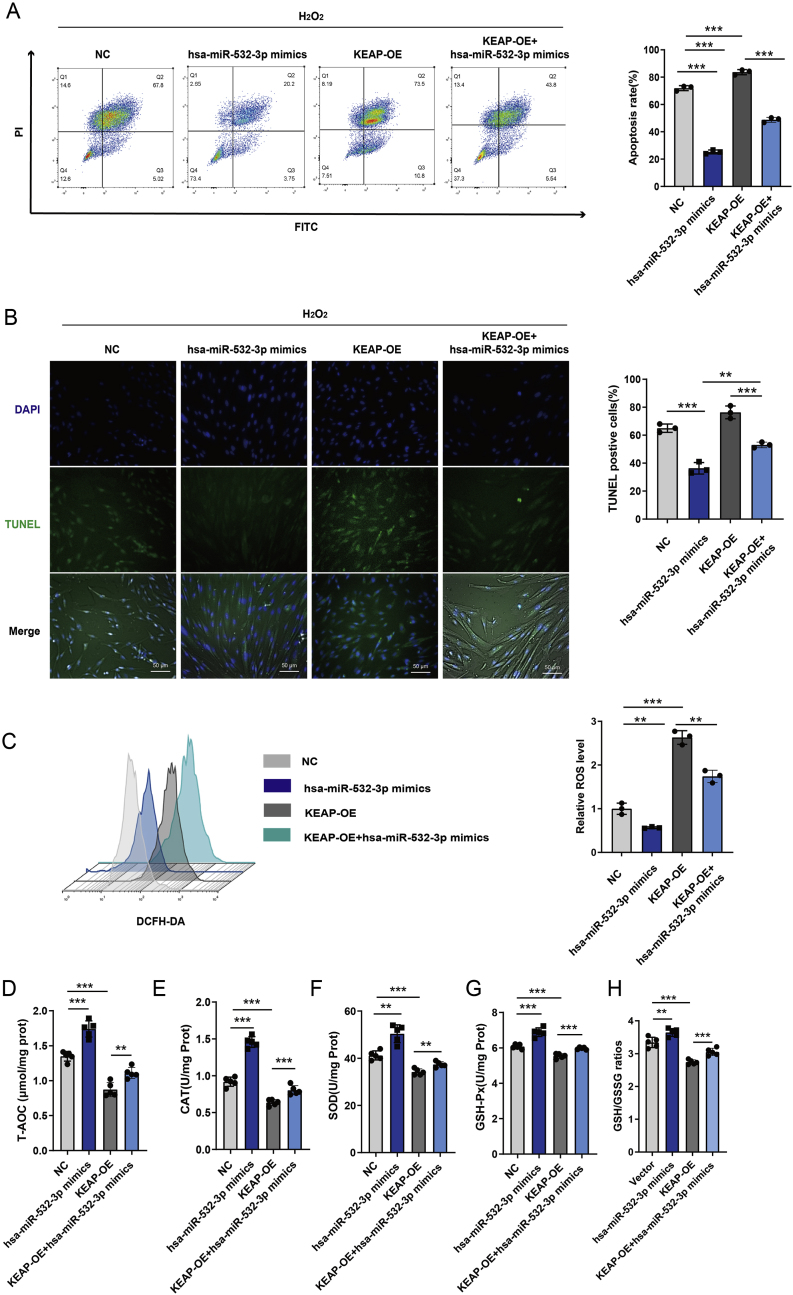
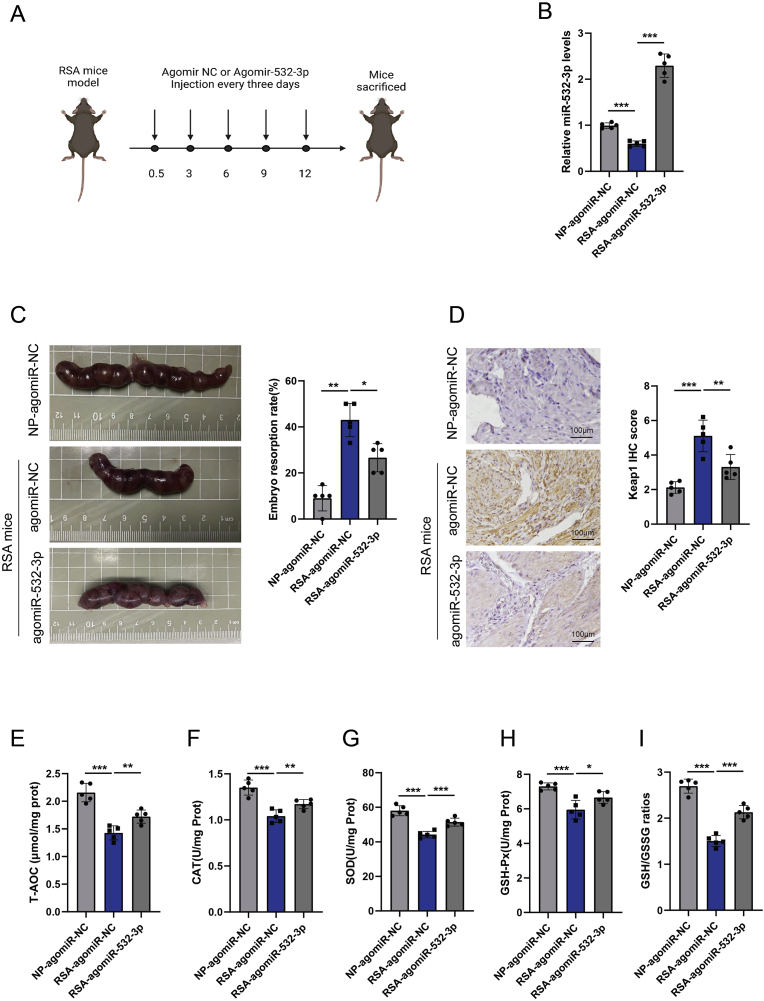
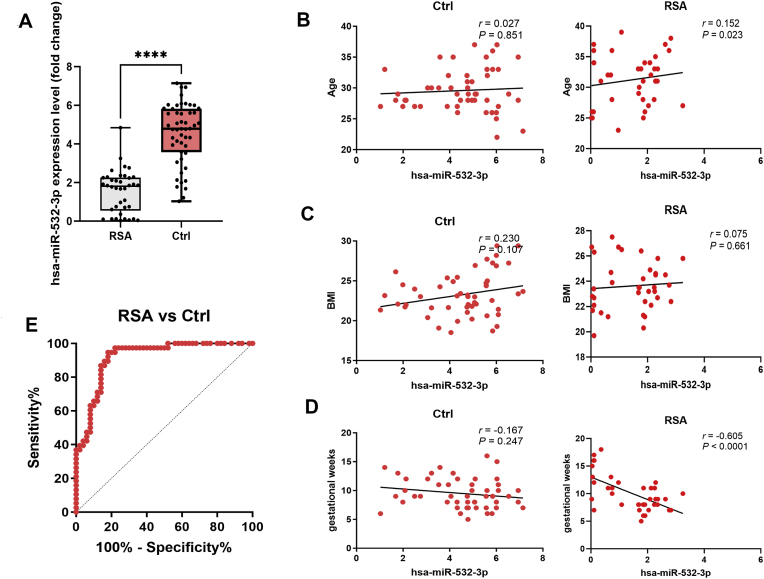
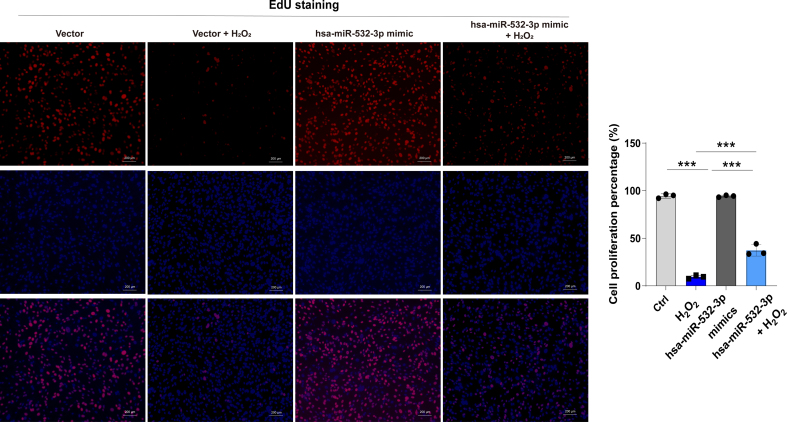
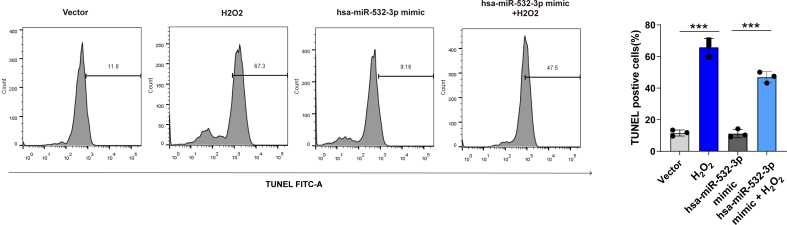
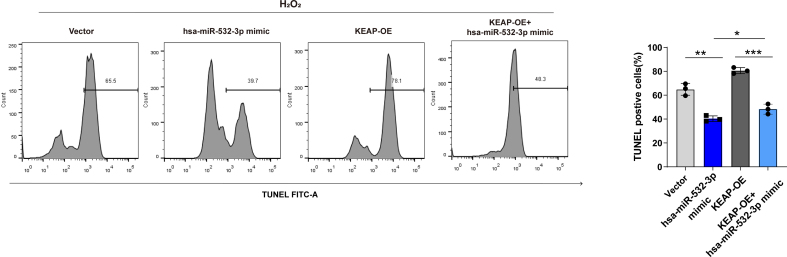
Results: miRNA sequencing revealed 44 miRNAs whose expression was downregulated and 9 miRNAs whose expression was upregulated in hDMSCs from the RSA group compared with those from the control group. The overexpression of hsa-miR-532-3p led to a significantly increased antioxidant capacity in hDMSCs. The knockdown or overexpression of hsa-miR-532-3p led to the upregulation or downregulation of KEAP1 expression, respectively. In a mouse model, the overexpression of hsa-miR-532-3p reduced embryo absorption rates in RSA mice, decreased KEAP1 expression levels in decidual tissues, and concurrently enhanced the resistance to oxidative stress. Furthermore, in patients diagnosed with RSA, serum hsa-miR-532-3p levels were significantly and negatively correlated with the gestational age.

Conclusions: Our study revealed a lower expression level of hsa-miR-532-3p in the hDMSCs of patients with RSA. Moreover, hsa-miR-532-3p protects hDMSCs from oxidative stress by targeting the Kelch-like ECH-associated protein 1/nuclear factor erythroid 2-related factor 2 (KEAP1/NRF2) pathway. Hsa-miR-532-3p is closely related to gestational age and has good predictive value for identifying RSA.

Keywords: Biomarker; Human decidual mesenchymal stem cells; Recurrent spontaneous abortion; microRNA.


Conflict of interest statement

Declaration of competing interest The authors declare that the research was conducted in the absence of any commercial or financial relationships that could be construed as a potential conflict of interest.

Figures

Fig. 1
Fig. 1
Extraction and identification of hDMSCs. A. The morphology of early pregnancy hDMSCs was observed under brightfield microscopy and crystal violet staining. B. The growth curve of early pregnancy hDMSCs was determined using CCK8 assay (n = 5), data representing mean ± SD. C–K. Flow cytometry was used to evaluate the expression of cell markers CD3, CD29, CD34, CD44, CD45, CD73, CD90, CD105, and CD146 in early pregnancy hDMSCs.
Fig. 2
Fig. 2
Assessment of antioxidant stress capacity in hDMSCs and decidua tissues. A-D. Comparison of T-AOC, SOD, GSH-PX, and CAT levels in decidua tissues between RSA group (n = 5) and control group (n = 5). E. Two representative cases of the IC50 of early pregnancy hDMSCs against H2O2 from patients with RSA and control group. F. Comparison of the IC50 of H2O2 between the RSA group (n = 5) and control group (n = 5) of hDMSCs. H–K. Comparison of T-AOC, SOD, GSH-PX, and CAT levels in hDMSCs between RSA group (n = 5) and control group (n = 5). Data representing mean ± SD, ∗∗∗P < 0.001; ∗∗P < 0.01; ∗P < 0.05.
Fig. 3
Fig. 3
Differential expression of miRNAs and functional enrichment in early pregnancy hDMSCs between patients with RSA group and control group. A. Volcano plot showing the differential expression of miRNAs in both groups (P < 0.05). B. Heatmap depicting the differential expression of miRNAs in control group (n = 3) and RSA group (n = 3). C. GO functional enrichment analysis of differentially expressed miRNAs. D. Enrichment analysis of differentially expressed miRNAs through the KEGG signaling pathways. E. Validation of different expression miRNAs in miRNA-sequencing via rt-qPCR. Data representing mean ± SD, ∗∗∗P < 0.001; ∗∗P < 0.01; ∗P < 0.05.
Fig. 4
Fig. 4
The assessment of hsa-miR-532-3p on anti-oxidative stress in hDMSCs. A. Screening of miRNAs for antagonizing oxidative stress in early pregnancy hDMSCs. The cells were transfected with different miRNA mimics and then subjected to H2O2 (400 μmol) intervention (n = 3). Cell viability was assessed using CCK8 assay after 12 h of intervention. B. Expression levels of hsa-miR-532-3p in hDMSCs after 12 h of intervention at different concentrations (n = 5). C. Expression levels of hsa-miR-532-3p in hDMSCs transfected with hsa-miR-532-3p mimic (n = 5). D. Changes in cell viability of hDMSCs transfected with hsa-miR-532-3p mimic under H2O2 intervention (n = 3). E. Comparison of IC50 values for H2O2 intervention in hDMSCs transfected with hsa-miR-532-3p mimic (n = 3). F. Changes in apoptotic cell population of hDMSCs transfected with hsa-miR-532-3p mimic under H2O2 intervention (n = 3). G. Changes in apoptotic cell population of hDMSCs transfected with hsa-miR-532-3p mimic under H2O2 intervention (n = 3). H. Measurement of intracellular ROS levels in hDMSCs after different interventions through DCFH-DA probe and flow cytometry (n = 3). I-M. Assessment of T-AOC, CAT, SOD, GSH-PX levels and GSH/GSSG ratios in hDMSCs after the overexpression of hsa-miR-532-3p (n = 3). Data representing mean ± SD, ∗∗∗P < 0.001; ∗∗P < 0.01; ∗P < 0.05.
Fig. 5
Fig. 5
Target interaction of hsa-miR-532-3p with KEAP1. A. A total of 703 mRNAs were screened and subjected to GO enrichment analysis. B. The relative miRNA expression changes of top 10 potential target after knockdown of hsa-miR-532-3p (n = 3). C. Bioinformatics prediction of the binding sites between hsa-miR-532-3p and KEAP1, followed by construction of wild-type and mutant luciferase reporter gene plasmids for KEAP1. D. Detection of KEAP1 expression levels after knockdown or overexpression of hsa-miR-532-3p in hDMSCs (n = 3). E. KEAP1 expression levels in hDMSCs overexpressing hsa-miR-532-3p. F. Western blot analysis of NRF2, GPX4, and KEAP1 expression levels in hDMSCs after knockdown or overexpression of hsa-miR-532-3p. G. Immunohistochemical detection of KEAP1 expression levels in decidua tissues from RSA group (n = 14) and control group (n = 15). H. Analysis of the correlation between hsa-miR-532-3 expression levels and immunohistochemical scoring of KEAP1 in decidua tissues. Data representing mean ± SD, ∗∗P < 0.01; ∗∗∗P < 0.001; ∗∗∗∗P < 0.0001.
Fig. 6
Fig. 6
Hsa-miR-532-3p antagonizes the decrease of antioxidant capacity via KEAP1 in hDMSCs. A. Flow cytometer was used to detect the changes in cell apoptosis in hDMSCs after transfection with hsa-miR-532-3p mimic and KEAP1 following H2O2 intervention (n = 3). B. TUNEL staining was performed to detect the changes in cell apoptosis in hDMSCs after transfection with hsa-miR-532-3p mimic and KEAP1 following H2O2 intervention (n = 3). C. DCFH-DA probe and flow cytometer were used to detect the levels of ROS in hDMSCs after different interventions (n = 3). D-H. The total antioxidant capacity (T-AOC), catalase (CAT), superoxide dismutase (SOD), and glutathione peroxidase (GSH-PX) levels and GSH/GSSG ratios were compared in hDMSCs after transfection with hsa-miR-532-3p mimic and KEAP1 (n = 5). Data representing mean ± SD, ∗∗∗P < 0.001; ∗∗P < 0.01; ∗P < 0.05.
Fig. 7
Fig. 7
The inhibitory effect of hsa-miR-532-3p on RSA in mice. A. Construction of the RSA model and tail vein injection method of agomir-532-3p. B. Expression levels of miR-532-3p in decidual tissues of different groups (n = 5). C. Comparison of embryo conditions and absorption rates in different groups (n = 5). D. Comparison of KEAP1 expression levels in decidual tissues of different groups (n = 5). E-I. Comparison of T-AOC, SOD, GSH-PX, CAT levels and GSH/GSSG ratios in different groups (n = 5). Data representing mean ± SD, ∗∗∗P < 0.001, ∗∗P < 0.01, ∗P < 0.05.
Fig. 8
Fig. 8
Hsa-miR-532-3p is potential biomarker for RSA.A. Comparison of serum hsa-miR-532-3p levels between control group (n = 50) and RSA group (n = 38), ∗∗∗∗, P < 0.0001. B. Correlation analysis between serum hsa-miR-532-3p levels and age, control group (n = 50), RSA group (n = 38). C. Correlation analysis between serum hsa-miR-532-3p levels and BMI, control group (n = 50), RSA group (n = 38). D. Correlation analysis between serum hsa-miR-532-3p levels and gestational week, control group (n = 50), RSA group (n = 38). E. Diagnostic value of serum hsa-miR-532-3p expression in RSA patients assessed by ROC curve.
Supplementary Fig. 1
The growth curve of different passage hDMSCs was determined using CCK8 assay (n = 5), data represent mean ± SD.
Supplementary Fig. 2
Changes in cell proliferation of hDMSCs transfected with hsa-miR-532-3p mimic under H2O2 intervention detected by EdU staining (n = 3). Data represent mean ± SD, ∗∗∗P < 0.001.
Supplementary Fig. 3
hDMSCs differentiation detection with hsa-miR-532-3p overexpression under H2O2 intervention. A. Alizarin Red staining for osteogenic differentiation (n = 3); B. Alcian Blue staining for chondrogenic differentiation (n = 3); C. Oil Red O staining for adipogenic differentiation (n = 3). Data represent mean ± SD, ns: no statistical difference.
Supplementary Fig. 4
Flow cytometry for TUNEL stain of hDMSCs after different treatment (n = 3). Data represent mean ± SD, ∗∗∗P < 0.001.
Supplementary Fig. 5
Flow cytometry for TUNEL stain of hDMSCs after overexpression KEAP1 and H2O2 treatment (n = 3). Data represent mean ± SD, ∗∗∗P < 0.001; ∗∗P < 0.01; ∗P < 0.05.
Supplementary Fig. 6
Original picture of western-blot result.

Similar articles

References

    1. Oliveira M.T.S., Oliveira C.N.T., Marques L.M., Souza C.L., Oliveira M.V. Factors associated with spontaneous abortion: a systematic review. Rev. Bras. Saúde Materno Infant. 2020;20:361–372.
    1. Pandey M.K., Rani R., Agrawal S. An update in recurrent spontaneous abortion. Arch. Gynecol. Obstet. 2005;272:95–108. - PubMed
    1. Branch D.W., Heuser C. Reproductive Endocrinology and Infertility: Integrating Modern Clinical and Laboratory Practice. 2010. Recurrent miscarriage; pp. 281–296.
    1. Regan L., Braude P.R., Trembath P.L. Influence of past reproductive performance on risk of spontaneous abortion. Br. Med. J. 1989;299(6698):541–545. - PMC - PubMed
    1. Rai R., Regan L. Recurrent miscarriage. The lancet. 2006;368(9535):601–611. - PubMed

LinkOut - more resources