. 2025 Feb 18;6(2):101934.
doi: 10.1016/j.xcrm.2025.101934. Epub 2025 Feb 4.

Spatially resolved transcriptomics reveal the determinants of primary resistance to immunotherapy in NSCLC with mature tertiary lymphoid structures

Affiliations

Spatially resolved transcriptomics reveal the determinants of primary resistance to immunotherapy in NSCLC with mature tertiary lymphoid structures

Florent Peyraud et al. Cell Rep Med. .

Abstract

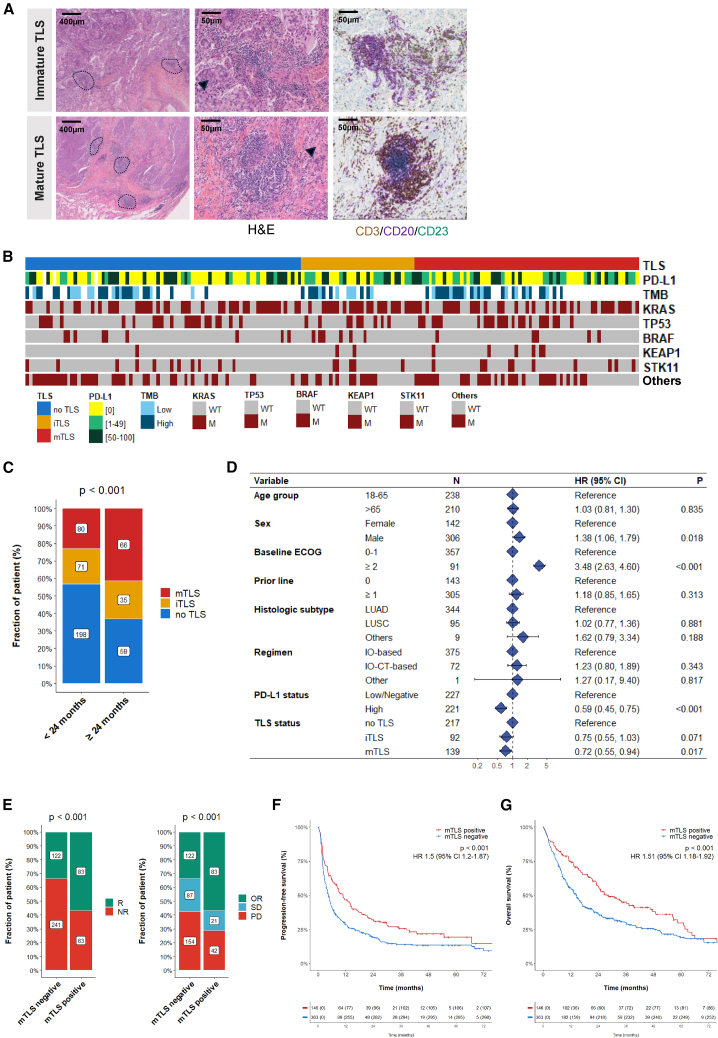
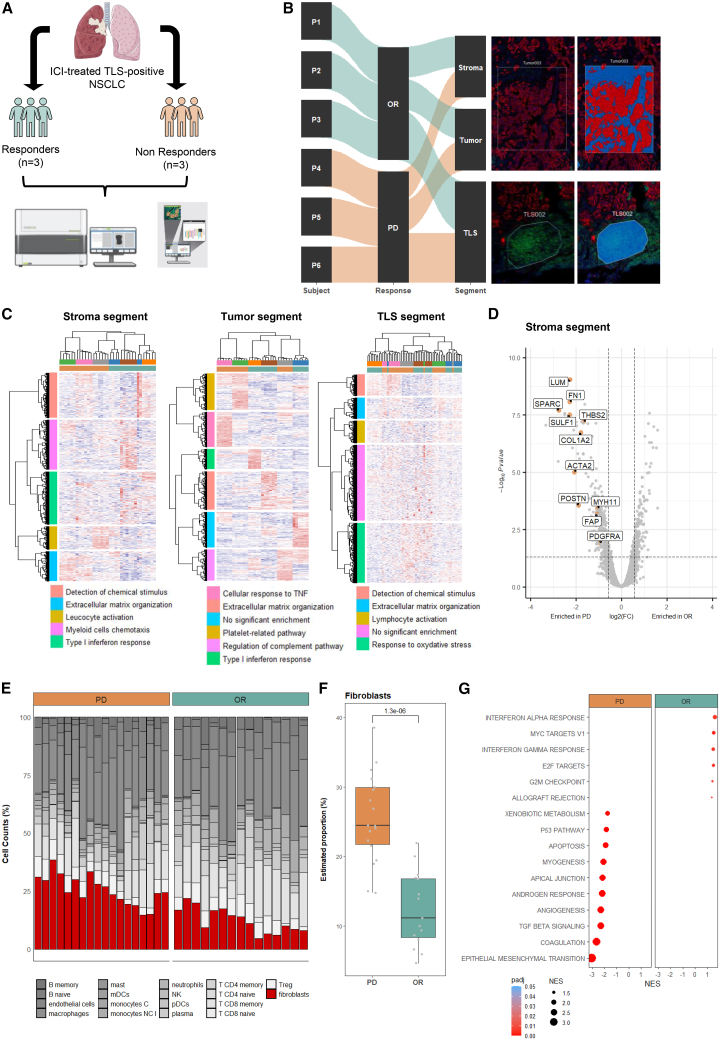
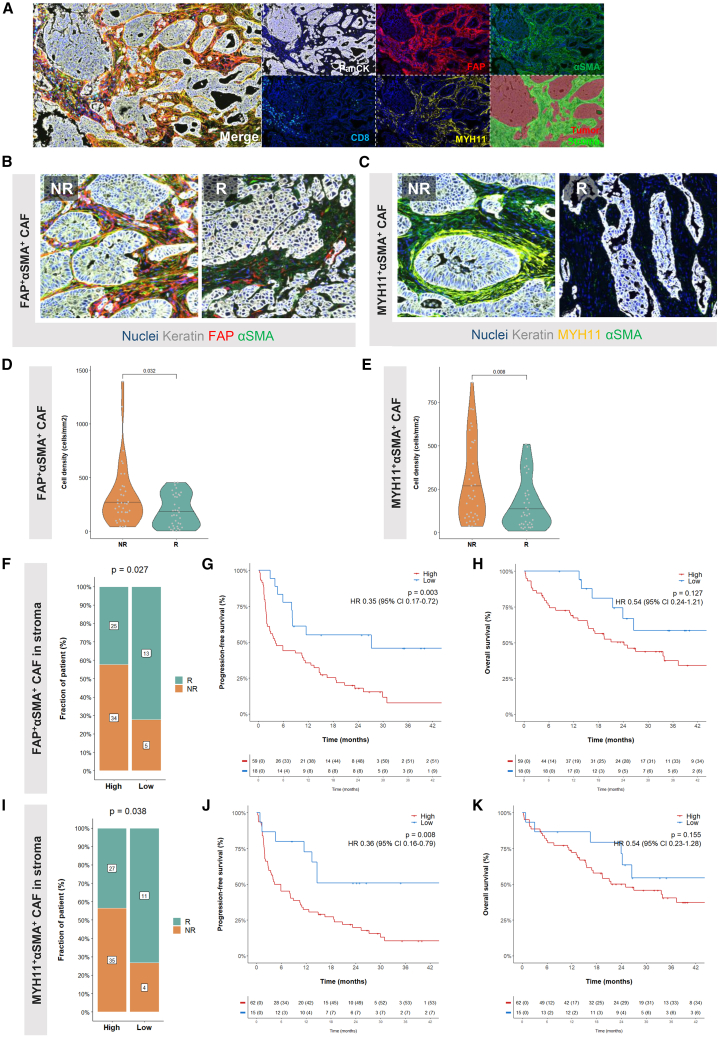
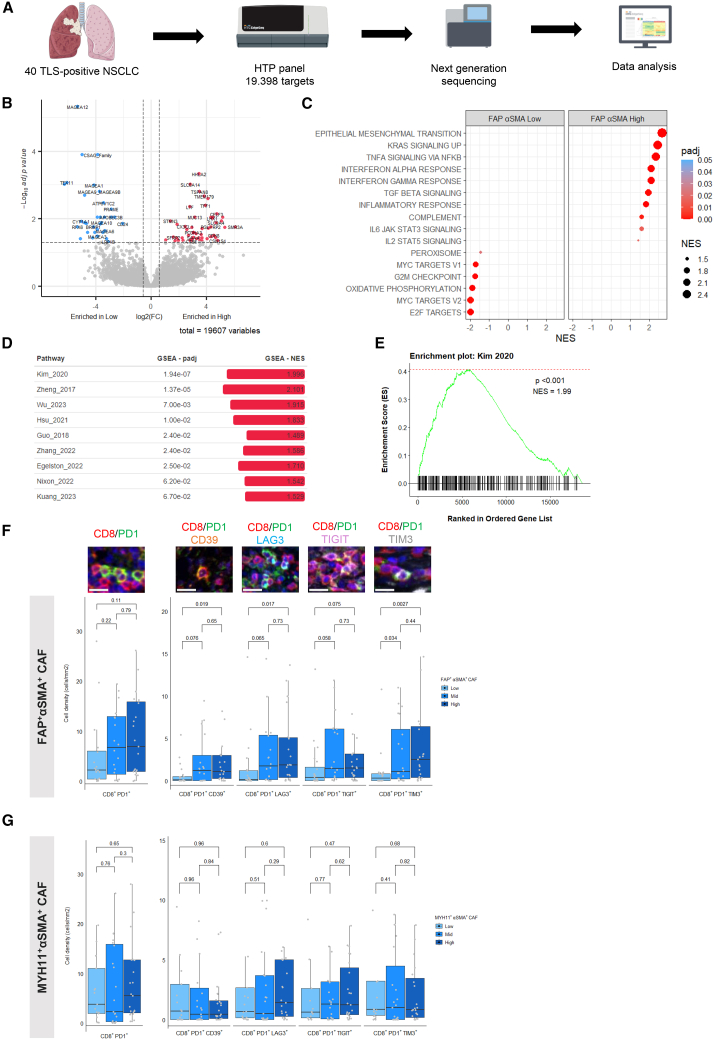
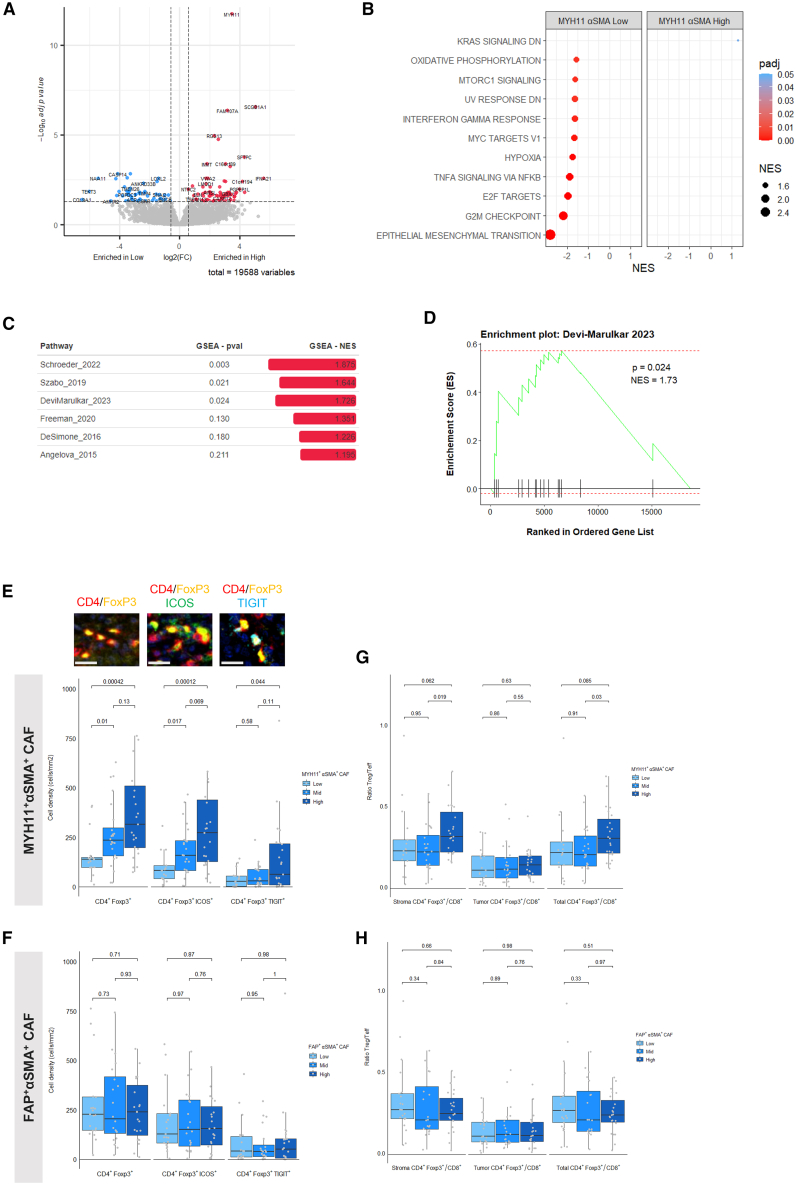
Effectiveness of immune checkpoint inhibitors (ICIs) in non-small cell lung cancer (NSCLC) has been linked to the presence of mature tertiary lymphoid structures (mTLSs) within the tumor microenvironment (TME). However, only a subset of mTLS-positive NSCLC derives benefit, thus highlighting the need to unravel ICI response determinants. The comprehensive analysis of ICI-treated patients with NSCLC (n = 509) from the Bergonié Institute Profiling (BIP) study (NCT02534649) reveals that the presence of mTLSs correlates with improved clinical outcomes, independently of programmed death ligand 1 (PD-L1) expression and genomic features. Employing spatial transcriptomics alongside multiplex immunofluorescence (mIF), we show that two distinct subsets of cancer-associated fibroblasts (CAFs) are essential factors in mediating primary resistance to ICIs in mTLS-positive NSCLC. These CAFs are associated with immune exclusion, CD8+ T cell exhaustion, and increased regulatory CD4+ T cell infiltration, underscoring an immunosuppressive TME. Our study highlights the pivotal role of specific CAF subsets in thwarting ICIs, proposing new therapeutic targets to enhance immunotherapy efficacy.

Keywords: cancer-associated fibroblasts; fibroblasts; immune checkpoint blockade; immune exclusion; immunotherapy; non-small cell lung cancer; regulatory T cells; tertiary lymphoid structures.


Conflict of interest statement

Declaration of interests F.P., J.-P.G., C.R., O.L., O.O., and A.B. are employees of Explicyte. R.J.J. is an employee and stockholder of Roche/Genentech. A.I. received research grants from AstraZeneca, Bayer, BMS, Chugai, Merck, MSD, Pharmamar, Novartis, and Roche and personal fees from Epizyme, Bayer, Deciphera, Lilly, Parthenon, Roche, and Springworks.

Figures

None
Graphical abstract
Figure 1
Figure 1
The presence of mTLSs is associated with clinical outcomes to immune checkpoint inhibitors in NSCLC (A) Representative image field of immature and mature TLSs observed in two distinct tumor samples from an FFPE NSCLC adenocarcinoma section. Mature TLSs are defined by the presence of CD23-positive dendritic cells on IHC. The pictures correspond to H&E staining (left/middle column) and triple IHC staining of CD3/CD20/CD23 (with CD3, CD20, and CD23 stained in brown, purple, and green, respectively). The scale bars indicate 400 and 50 μm for the left and middle/right, respectively. Dashed lines delineate TLSs, and black cropped arrows highlight the tumor cells in the samples. (B) Tissue-based genomic profiling landscape of NSCLC tumors according to TLS status (N = 182). (C) Proportion of patients characterized by the absence or presence of either iTLSs or mTLSs according to the OS endpoint (OS < 24 months versus OS ≥ 24 months from treatment initiation). Statistical significance was determined by chi-squared test. (D) Forest plot of multivariate Cox analysis of OS including baseline clinical and pathological features. (E) Response rate, as defined per objective response (left) or RECIST 1.1 criteria (right), according to mTLS status: absence (negative, no TLSs or iTLSs) or presence (positive). Statistical significance was determined by chi-squared test. (F) Kaplan-Meier analysis of the PFS of patients according to TLS status (n = 509; red curve: mTLS-enriched tumors; blue curve: mTLS-negative tumors). Numbers below each x axis indicate the number of patients at risk and those in parentheses are the number of events. Statistical significance was determined by log rank test. (G) Kaplan-Meier analysis of the OS of patients according to TLS status (n = 509; red curve: mTLS-enriched tumors; blue curve: mTLS-negative tumors). Numbers below each x axis indicate the number of patients at risk and those in parentheses are the number of events. Statistical significance was determined by log rank test. IHC, immunohistochemistry; H&E, hematoxylin and eosin; NSCLC, non-small cell lung carcinoma; NR, non-responder; OR, objective response; OS, overall survival; PFS, progression-free survival; PD, progressive disease; R, responder; SD, stable disease; TMB, tumor mutational burden. See also Figures S1 and S2; Tables 1 and S1.
Figure 2
Figure 2
The presence of fibroblasts in stroma of mTLS-positive NSCLC correlated with poor response to immune checkpoint inhibitors (A) Tissue processing workflow for spatial transcriptomic of FFPE samples of TLS-positive NSCLC. (B) Sankey plot and illustration of the distribution of selected AOIs. All scale bars, 50 μm. (C) Unsupervised clustering heatmap of upregulated Gene Ontology (GO) pathways in stroma segment, tumor segment, and TLS segment, respectively. (D) Volcano plot of differential gene expression between responders (PD, N = 3) and non-responders (OR, N = 3) in stroma segment. (E) Stromal cell composition between non-responders (PD, N = 3) and responders (OR, N = 3) in stroma segment. A total of 18 AOIs in the PD group and 15 AOIs in the OR group are represented, respectively. (F) Boxplot of estimated proportion of fibroblast population using SpatialDecon algorithm. p value was calculated using Wilcoxon test. Data are represented as median ± IQR. (G) Bubble plot of Hallmark pathways analysis of the gene differentially expressed between responders (PD, N = 3) and non-responders (OR, N = 3) in stroma segment. AOIs, areas of interest; FFPE, formalin-fixed, paraffin-embedded; ICIs, immune checkpoint inhibitors; IQR, interquartile range; NSCLC, non-small cell lung cancer; mTLSs, mature tertiary lymphoid structures. See also Figure S3; Tables S2, S3, and S4.
Figure 3
Figure 3
Stromal FAP+αSMA+ CAF and MYH11+αSMA+ CAF correlate with clinical outcome in patients treated with immune checkpoint inhibitors (A) Representative image field of PanCK/CD8/FAP/MYH11/αSMA/DAPI multiplexed immunohistofluorescence panel on an FFPE NSCLC adenocarcinoma section. Illustration of the segmentation strategy of the tissue in “stroma” and “tumor” areas is shown at the bottom right. All scale bars, 200 μm. (B) Representative image field of FAP+αSMA+ CAF infiltration in the tumor microenvironment of non-responders (NR, left) and responders (R, right) to ICI. All scale bars, 50 μm. (C) Representative image field of MYH11+αSMA+ CAF infiltration in the tumor microenvironment of non-responders (NR, left) and responders (R, right) to ICI. All scale bars, 50 μm. (D) Density of FAP+αSMA+ CAF in the stroma areas of non-responders and responders to ICI. The p values were calculated using Wilcoxon tests. Data are represented as median. (E) Density of MYH11+αSMA+ CAF in the stroma areas of non-responders and responders to ICI. The p values were calculated using Wilcoxon tests. Data are represented as median. (F) Proportion of patients with high and low density of FAP+αSMA+ CAF according to response. The p value was calculated using an χ2 test. (G) Kaplan-Meier curves of the PFS of patients classified as high or low based on levels of stromal FAP+αSMA+ CAF. (H) Kaplan-Meier curves of the OS of patients classified as high or low based on levels of stromal FAP+αSMA+ CAF. (I) Proportion of patients with high and low density of FAP+αSMA+ CAF according to response. The p value was calculated using an χ2 test. (J) Kaplan-Meier curves of the PFS of patients classified as high or low based on levels of stromal MYH11+αSMA+ CAF. (K) Kaplan-Meier curves of the OS of patients classified as high or low based on levels of stromal MYH11+αSMA+ CAF. CAF, cancer-associated fibroblast; ICI, immune checkpoint inhibitors; NR, non-responder; OS, overall survival; PFS, progression-free survival; R, responder; TLSs, tertiary lymphoid structures. See also Figures S4 and S5; Table S5.
Figure 4
Figure 4
FAP+αSMA+ CAF correlates with inflammatory response and exhaustion of CD8 T cells in the tumor microenvironment (A) Tissue processing workflow for regional transcriptomic of FFPE samples of TLS-positive NSCLC (n = 40). (B) Volcano plot of the differentially expressed gene between FAP+αSMA+ CAF-high (N = 28) and FAP+αSMA+ CAF-low (N = 12) patients. (C) Bubble plot of Hallmark pathway analysis of the differentially expressed genes between FAP+αSMA+ CAF-high (N = 28) and FAP+αSMA+ CAF-low (N = 12) patients. (D) GSEA analysis of exhaustion T cell gene signatures. (E) GSEA plot of exhaustion T cell pathway using Kim et al. signature. (F) Representative image field and corresponding density of intratumoral CD8+PD1+, CD8+PD1+CD39+, CD8+PD1+LAG3+, CD8+PD1+TIGIT+, and CD8+PD1+TIM3+ T cells according to stromal FAP+αSMA+ CAF category. The p values were calculated using Wilcoxon tests. All scale bars, 20 μm. Data are represented as median ± IQR. (G) Density of intratumoral CD8+PD1+, CD8+PD1+CD39+, CD8+PD1+LAG3+, CD8+PD1+TIGIT+, and CD8+PD1+TIM3+ T cells according to stromal MYH11+αSMA+ CAF category. The p values were calculated using Wilcoxon tests. Data are represented as median ± IQR. CAF, cancer-associated fibroblast; GSEA, gene set enrichment analysis; IQR, interquartile range; NES, normalized enrichment score. See also Figure S6; Tables S6 and S8.
Figure 5
Figure 5
MYH11+αSMA+ CAF correlates with regulatory CD4 T cell infiltration and immunosuppressive tumor microenvironment (A) Volcano plot of the differentially expressed gene between MYH11+αSMA+ CAF-high (N = 31) and MYH11+αSMA+ CAF-low (N = 9) patients. (B) Hallmark pathway analysis of the differentially expressed genes between MYH11+αSMA+ CAF-high (N = 31) and MYH11+αSMA+ CAF-low (N = 9) patients. (C) GSEA analysis of regulatory T cell gene signatures. (D) GSEA plot of regulatory T cell pathway using Devi-Marulkar et al. signature. (E) Representative image field and corresponding density of stromal CD4+Foxp3+, CD4+Foxp3+ICOS+, and CD4+Foxp3+TIGIT+ T cells according to stromal MYH11+αSMA+ CAF category. The p values were calculated using Wilcoxon tests. All scale bars, 20 μm. Data are represented as median ± IQR. (F) Density of stromal CD4+Foxp3+, CD4+Foxp3+ICOS+, and CD4+Foxp3+TIGIT+ T cells according to stromal FAP+αSMA+ CAF category. The p values were calculated using Wilcoxon tests. Data are represented as median ± IQR. (G) Stromal CD4+Foxp3+/CD8+ T cell ratio, intratumoral CD4+Foxp3+/CD8+ T cell ratio, and total CD4+Foxp3+/CD8+ T cell ratio according to stromal MYH11+αSMA+ CAF category. The p values were calculated using Wilcoxon tests. Data are represented as median ± IQR. (H) Stromal CD4+Foxp3+/CD8+ T cell ratio, intratumoral CD4+Foxp3+/CD8+ T cell ratio, and total CD4+Foxp3+/CD8+ T cell ratio according to stromal FAP+αSMA+ CAF category. The p values were calculated using Wilcoxon tests. Data are represented as median ± IQR. CAF, cancer-associated fibroblast; IQR, interquartile range. See also Figure S6; Tables S7 and S8.

Similar articles

Cited by

References

    1. Siegel R.L., Giaquinto A.N., Jemal A. Cancer statistics, 2024. CA. Cancer J. Clin. 2024;74:12–49. - PubMed
    1. Wang M., Herbst R.S., Boshoff C. Toward personalized treatment approaches for non-small-cell lung cancer. Nat. Med. 2021;27:1345–1356. - PubMed
    1. Reck M., Rodríguez-Abreu D., Robinson A.G., Hui R., Csőszi T., Fülöp A., Gottfried M., Peled N., Tafreshi A., Cuffe S., et al. Pembrolizumab versus Chemotherapy for PD-L1–Positive Non–Small-Cell Lung Cancer. N. Engl. J. Med. 2016;375:1823–1833. - PubMed
    1. Gettinger S., Horn L., Jackman D., Spigel D., Antonia S., Hellmann M., Powderly J., Heist R., Sequist L.V., Smith D.C., et al. Five-Year Follow-Up of Nivolumab in Previously Treated Advanced Non-Small-Cell Lung Cancer: Results From the CA209-003 Study. J. Clin. Oncol. 2018;36:1675–1684. - PubMed
    1. Gandhi L., Rodríguez-Abreu D., Gadgeel S., Esteban E., Felip E., De Angelis F., Domine M., Clingan P., Hochmair M.J., Powell S.F., et al. Pembrolizumab plus Chemotherapy in Metastatic Non-Small-Cell Lung Cancer. N. Engl. J. Med. 2018;378:2078–2092. - PubMed

Publication types

MeSH terms