. 2025 Feb 5;8(4):e202402956.
doi: 10.26508/lsa.202402956. Print 2025 Apr.

Impaired primitive erythropoiesis and defective vascular development in Trim71-KO embryos

Affiliations

Impaired primitive erythropoiesis and defective vascular development in Trim71-KO embryos

Tobias Beckröge et al. Life Sci Alliance. .

Abstract

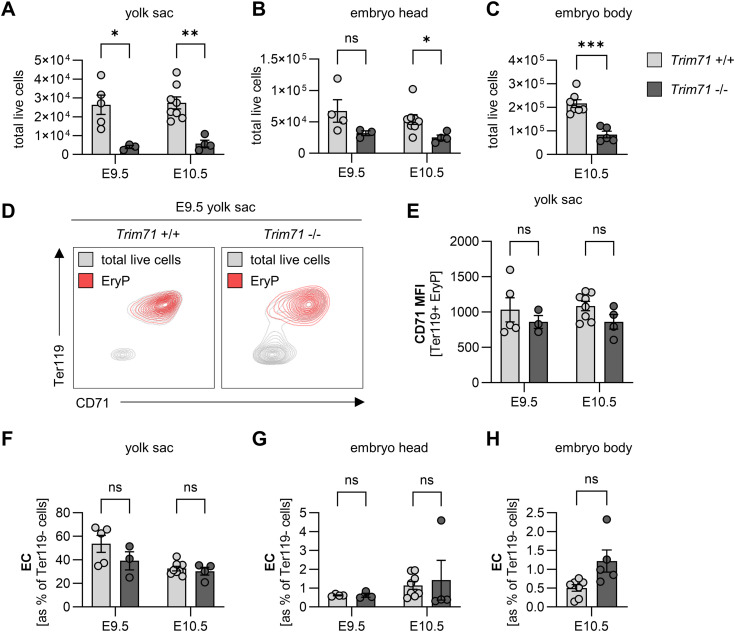
The transition of an embryo from gastrulation to organogenesis requires precisely coordinated changes in gene expression, but the underlying mechanisms remain unclear. The RNA-binding protein Trim71 is essential for development and serves as a potent regulator of post-transcriptional gene expression. Here, we show that global deficiency of Trim71 induces severe defects in mesoderm-derived cells at the onset of organogenesis. Murine Trim71-KO embryos displayed impaired primitive erythropoiesis, yolk sac vasculature, heart function, and circulation, explaining the embryonic lethality of these mice. Tie2 Cre Trim71 conditional knockout did not induce strong defects, showing that Trim71 expression in endothelial cells and their immediate progenitors is dispensable for embryonic survival. scRNA-seq of E7.5 global Trim71-KO embryos revealed that transcriptomic changes arise already at gastrulation, showing a strong up-regulation of the mesodermal pioneer transcription factor Eomes. We identify Eomes as a direct target of Trim71-mediated mRNA repression via the NHL domain, demonstrating a functional link between these important regulatory genes. Taken together, our data suggest that Trim71-dependent control of gene expression at gastrulation establishes a framework for proper development during organogenesis.


Conflict of interest statement

The authors declare that they have no conflict of interest.

Figures

Figure 1.
Figure 1.. Trim71-KO embryos show developmental retardation and decreased primitive erythropoiesis at early organogenesis.
(A) Morphology of WT and Trim71-KO embryos at indicated developmental stages E7.5–E10.5. E, embryo; ExE, extraembryonic region; DA, dorsal aorta; H, heart; YS, yolk sac. Stars indicate the presence of a neural tube closure defect. (B) Morphology of WT and Trim71-KO yolk sacs at E9.5 and E10.5. Dashed boxes show the magnification of vitelline vessels. (C) Representative flow cytometry gating of Ter119+ CD45 EryP in E10.5 WT and Trim71-KO yolk sacs. Red boxes indicate gates for EryP. (D, E, F) Relative quantification of EryP in the (D) yolk sac and (E) embryo head at E9.5 and E10.5, and (F) the embryo body at E10.5 by flow cytometry (n = 3–8 embryos from 2 to 3 experiments; data are depicted as the mean ± SEM, unpaired t test, *P < 0.05, **P < 0.01).
Figure S1.
Figure S1.. Flow cytometric analysis of Trim71-KO embryos.
(A, B, C) Flow cytometric quantification of total live cells in the (A) yolk sac and (B) embryo head at E9.5 and (C) the embryo body at E10.5. (D) Representative flow cytometry plot of Ter119 and CD71 in E9.5 yolk sac EryP (red) and total live cells (gray) from Trim71 +/+ and Trim71 −/− embryos. (E) Quantification of the CD71 median fluorescence intensity on E9.5 and E10.5 yolk sac EryP. (F, G, H) Flow cytometric quantification of relative EC numbers in the (D) yolk sac and (E) embryo head at E9.5 and E10.5 and (F) the embryo body at E10.5 (n = 3–8 embryos from 2 to 3 experiments; data are depicted as the mean ± SEM, unpaired t test, ns, not significant, *P < 0.05, **P < 0.01, ***P < 0.001).
Figure 2.
Figure 2.. Cardiovascular defects in Trim71-KO embryos.
(A) Representative overview images of E10.5 yolk sacs stained with the EC marker CD31. Dashed boxes show the magnification of vitelline vessels in the Trim71-WT yolk sac, whereas a representative region devoid of vitelline vessels is shown in the Trim71-KO yolk sac. (B) Representative images of the yolk sac microvasculature at E10.5 stained with CD31. Dashed boxes show the magnification of individual vessels with indicated endothelial extensions and branching points. BP, branching point; Ex, endothelial extension. (C, D) Quantification of (C) endothelial extensions and (D) branching points in the yolk sac microvasculature at E9.5 and E10.5 (n = 4–6 yolk sacs from three experiments per stage; data are depicted as the mean ± SEM, unpaired t test, **P < 0.01, ***P < 0.001, ****P < 0.0001). (E) Percentage of embryos with present or absent heartbeat at E9.5 and E10.5 (n = 8–25 embryos from 5 to 14 experiments). (F) Heart rate of E10.5 WT and Trim71-KO embryos in which a heartbeat was detectable (n = 4 embryos from 3 experiments; data are depicted as the mean ± SEM, unpaired t test, *P < 0.05).
Figure 3.
Figure 3.. Effect of global or erythro-myeloid progenitor (EMP)–specific Trim71 deletion on EMP-derived myeloid cell numbers in the yolk sac and the embryo.
(A, B, C) Quantification of cell numbers in WT and Trim71-KO embryos. (A) Relative numbers of EMP, pMac, and macrophages in the yolk sac at E9.5 and E10.5. (B, C) Relative numbers of pMac and macrophages in the embryo body at E10.5 and (C) in the embryo head at E9.5 and E10.5 (n = 3–8 embryos from 2 to 3 experiments; data are depicted as the mean ± SEM, unpaired t test, ns, not significant, *P < 0.05, **P < 0.01). (D) Quantification of Trim71 mRNA expression by qRT–PCR in EMP, pMac, and macrophages isolated from WT E10.5 yolk sacs (n = 3 from 3 experiments; data are depicted as the mean ± SEM, ordinary one-way ANOVA, ns, not significant, **P < 0.01). (E, F) Quantification of cell numbers in control and Csf1riCre Trim71 cKO (Csf1riCre/+ Trim71fl/fl) embryos. Ctrl indicates Csf1r+/+ Trim71fl/fl. (E) Relative numbers of pMac and macrophages in the embryo head at E9.5 and E10.5. (F) Relative numbers of EMP, pMac, and macrophages in the yolk sac at E9.5 and E10.5 (n = 9–15 embryos from 4 to 5 experiments; data are depicted as the mean ± SEM, unpaired t test, ns, not significant).
Figure S2.
Figure S2.. Csf1riCre Trim71 cKO does not influence Cx3cr1 expression in pMac and macrophages and does not lead to embryonic lethality.
(A) Representative flow cytometry histograms of Cx3cr1 fluorescence intensity in E9.5 yolk sac erythro-myeloid progenitors, pMac, and macrophages. (B, C) Median fluorescence intensity of Cx3cr1 in (B) erythro-myeloid progenitors, pMac, and macrophages of the yolk sac at E9.5 and E10.5 and (C) pMac and macrophages of the embryo head at E9.5 and E10.5 (n = 9–15 embryos from 4 to 5 experiments; data are depicted as the geometric mean). (D) Morphology of control or Csf1riCre Trim71 cKO embryos and yolk sacs at E10.5. (E) Quantification of genotype percentages in E9.5, E10.5, and E12.5 embryos and 3-wk-old pups from mating of Csf1riCre/+ Trim71fl/fl with Csf1r+/+ Trim71fl/fl mice (n = 44–114 embryos or pups from 6 to 25 litters).
Figure 4.
Figure 4.. ScRNA-seq of E9.5 yolk sacs reveals the decreased endothelial expression of angiogenic genes upon Trim71-KO.
(A) Uniform Manifold Approximation and Projection plot of all cells with color-coded cell-type annotations. (B) Uniform Manifold Approximation and Projection plot with color-coded genotypes (blue = Trim71 +/+, red = Trim71 −/−). (C) Enriched GO terms among down-regulated differentially expressed genes (DEG) in Trim71 −/− EC. (D) Volcano plot of DEG in Trim71 −/− EC with genes included in the GO-term regulation of angiogenesis highlighted in red. (E) Expression score of the MSigDB gene set sprouting angiogenesis (data are depicted as a violin plot with median and quartiles indicated as dashed lines, unpaired t test, ***P < 0.001). (F) Category network plot of GO terms from DEG down-regulated in Trim71 −/− EC with color-coded expression fold changes of genes included in the processes. The circle size denotes the number of DEG contained in each process.
Figure S3.
Figure S3.. Cell-type marker genes and cell numbers as determined by scRNA-seq of E9.5 yolk sacs.
(A) Expression heatmap of top marker genes across all cell types from scRNA-seq of Trim71-WT or Trim71-KO E9.5 yolk sacs. (B) Percentage contribution of cell types to total cells by genotype. (C) Absolute cell counts of each cell type by genotype. (D) Expression heatmap of up-regulated and down-regulated differentially expressed genes in Trim71 +/+ and Trim71 −/− EC. (E, F) Volcano plots of differentially expressed genes in (E) Trim71 −/− EryP and (F) Trim71 −/− ExE endoderm.
Figure S4.
Figure S4.. Expression of Trim71 at gastrulation and early organogenesis in the hematoendothelial lineage.
(A) Analysis of data from the WT E6.5–E8.5 mouse cell atlas from Pijuan-Sala et al (2019). Trim71 expression in selected cell types from E7.5 or E8.5 embryos after pseudo-bulk aggregation of gene expression data by cell types from biological replicates (n = 3–4) is shown. (B) Immunofluorescence staining of Trim71 (green), Flk1 (red), and DAPI (blue) in a sagittal section of an E7.5 WT embryo. The dashed box shows the magnification of Flk1+ cells. The right image shows a secondary antibody control staining of E7.5 WT embryos without the addition of primary antibodies, indicating slightly unspecific secondary antibody binding to the extraembryonic endoderm tissue (indicated with stars in both images). (C) Immunofluorescence staining of Trim71 (green), CD31 (red), and DAPI (blue) in an E9.5 WT yolk sac. The dashed box shows the magnification of a CD31+ EC. (D) Immunofluorescence staining of Trim71 (green), CD31 (red), and DAPI (blue) in a transversal section of an E10.5 WT embryo. The dashed box shows the magnification of the dorsal aorta.
Figure 5.
Figure 5.. Tie2Cre Trim71 cKO does not result in embryonic lethality and does not induce strong defects in cardiovascular development or primitive erythropoiesis.
(A) Morphology of control or Tie2Cre Trim71 cKO (Tie2Cre/+ Trim71fl/fl) embryos and yolk sacs at E10.5. Ctrl indicates Tie2+/+ Trim71fl/fl or Tie2+/+ Trim71fl/+. Dashed boxes show the magnification of vitelline vessels. (B) Quantification of genotype percentages in E9.5, E10.5, and E12.5 embryos and 3-wk-old pups from mating of Tie2Cre/+ Trim71fl/+ with Tie2+/+ Trim71fl/fl mice (n = 9–34 embryos or pups from 2 to 5 litters). (C, D, E) Whole-mount staining of yolk sacs with CD31. (C) Representative images of vitelline vessels and microvascular areas of E9.5 yolk sacs. (D, E) Quantification of (D) endothelial extensions and (E) branching points in the microvasculature of E9.5 and E12.5 yolk sacs (n = 5–6 yolk sacs from 3 to 5 experiments; data are depicted as the mean ± SEM, unpaired t test, ns, not significant, *P < 0.05, **P < 0.01, ***P < 0.001). (F) Percentage of embryos with present or absent heartbeat at E9.5 and E10.5 (n = 3–12 embryos from 2 to 4 experiments). (G) Relative quantification of EryP in the yolk sac at E9.5 and E10.5 by flow cytometry (n = 3–11 embryos from 1 to 2 experiments; data are depicted as the mean ± SEM, unpaired t test, ns, not significant).
Figure 6.
Figure 6.. scRNA-seq of E7.5 embryos reveals extensive transcriptional changes in the mesoderm upon Trim71-KO.
(A) Uniform Manifold Approximation and Projection plot of all cells with color-coded cell-type annotations. (B) Uniform Manifold Approximation and Projection plot with color-coded genotypes (blue = Trim71 +/+, red = Trim71 −/−). (C) Expression heatmap of up-regulated and down-regulated differentially expressed genes (DEG) in Trim71 +/+ and Trim71 −/− mesodermal cells. (D) Enriched GO terms among down-regulated DEG in Trim71 −/− mesodermal cells. (E) Category network plot of GO terms from DEG down-regulated in Trim71 −/− mesodermal cells with color-coded expression fold changes of genes included in the processes. The circle size denotes the number of DEG contained in each process. (F) Volcano plot of DEG in Trim71 −/− mesodermal cells with DEG included in the GO-term RNA splicing highlighted in turquoise and mesendoderm development in purple. (G) Enriched GO terms among up-regulated DEG in Trim71 −/− mesodermal cells. (H, I) Expression of (H) Eomes and (I) Lhx1 in cells of the primitive streak, mesoderm, and definitive endoderm separated by genotype.
Figure S5.
Figure S5.. Cell-type marker genes and cell numbers as determined by scRNA-seq of E7.5 whole embryos.
(A) Expression heatmap of top marker genes across all cell types from scRNA-seq of Trim71-WT or Trim71-KO E7.5 whole embryos. (B) Percentage contribution of cell types to total cells by genotype. (C) Absolute cell counts of each cell type by genotype. (D) Expression of Trim71 in all cell types in Trim71+/+ cells. (E) Volcano plot of differentially expressed genes in Trim71 −/− ExE endoderm.
Figure S6.
Figure S6.. Gene expression of Trim71 mutant mESC upon differentiation.
(A, B) Expression of (A) Flk1 and (B) Pdgfra in Trim71-flox and Trim71-KO mESC at day 0, day 2, and day 4 of differentiation as determined by qRT–PCR (n = 3; data are depicted as the mean ± SEM, two-way ANOVA, ns, not significant, *P < 0.05). (C) Relative Eomes expression in Trim71-flox and Trim71-R595H mESC at day 4 of differentiation as determined by qRT–PCR (n = 3; data are depicted as the mean ± SEM, unpaired t test).
Figure 7.
Figure 7.. Trim71 antagonizes Eomes expression by binding its mRNA via the NHL domain.
(A, B) Expression of (A) Eomes and (B) Lhx1 in Trim71-flox and Trim71-KO mESC at day 0, day 2, and day 4 of differentiation as determined by qRT–PCR (n = 3; data are depicted as the mean ± SEM, two-way ANOVA, ns, not significant, ***P < 0.001). (C) RNAfold secondary structure prediction of the 801- to 900-bp region of the murine Eomes mRNA 3′ UTR. The identified TRE is highlighted by a dashed box. (D) Representation of the identified TRE in the Eomes mRNA 3′ UTR. Critical bases for the interaction with the Trim71 NHL domain are highlighted in orange. (E) Depiction of Trim71-mNeon-FLAG-WT, mNeon-FLAG-KO, or mNeon-FLAG-R595H mESC differentiation in embryoid bodies, followed by cross-linking immunoprecipitation (CLIP) at day 4. Created with BioRender.com. (F) Representation of the Trim71-mNeon-FLAG protein with indicated domains and position of the R595H mutation. (G, H) Representative histogram and (H) quantification of the median fluorescence intensity of the Trim71-mNeon signal in undifferentiated Trim71-mNeon-FLAG-WT, Trim71-mNeon-FLAG-KO, or Trim71-mNeon-FLAG-R595H mESC (n = 3; data are depicted as the mean ± SEM, ordinary one-way ANOVA, ****P < 0.0001). (I) Quantification of Eomes and Lhx1 fold enrichment in FLAG-CLIP of Trim71-mNeon-FLAG-WT, Trim71-mNeon-FLAG-KO, or Trim71-mNeon-FLAG-R595H mESC at day 4 of differentiation (n = 3; data are depicted as the mean ± SEM, one-way ANOVA, ns, not significant, ***P < 0.001). (J) Western blot of input and immunoprecipitated protein lysates after FLAG-CLIP detected with Trim71 and vinculin antibodies.

Similar articles

References

    1. Arnold SJ, Hofmann UK, Bikoff EK, Robertson EJ (2008) Pivotal roles for eomesodermin during axis formation, epithelium-to-mesenchyme transition and endoderm specification in the mouse. Development 135: 501–511. 10.1242/dev.014357 - DOI - PMC - PubMed
    1. Bardot ES, Hadjantonakis A-K (2020) Mouse gastrulation: Coordination of tissue patterning, specification and diversification of cell fate. Mech Dev 163: 103617. 10.1016/j.mod.2020.103617 - DOI - PMC - PubMed
    1. Bautch VL, Caron KM (2015) Blood and lymphatic vessel formation. Cold Spring Harbor Perspect Biol 7: a008268. 10.1101/cshperspect.a008268 - DOI - PMC - PubMed
    1. Bazzoni G, Dejana E (2004) Endothelial cell-to-cell junctions: Molecular organization and role in vascular homeostasis. Physiol Rev 84: 869–901. 10.1152/physrev.00035.2003 - DOI - PubMed
    1. Bentley K, Franco CA, Philippides A, Blanco R, Dierkes M, Gebala V, Stanchi F, Jones M, Aspalter IM, Cagna G, et al. (2014) The role of differential VE-cadherin dynamics in cell rearrangement during angiogenesis. Nat Cell Biol 16: 309–321. 10.1038/ncb2926 - DOI - PubMed

MeSH terms

LinkOut - more resources