. 2025 Feb 5;16(1):1089.
doi: 10.1038/s41467-025-56052-0.

Transmembrane voltage-gated nanopores controlled by electrically tunable in-pore chemistry

Affiliations

Transmembrane voltage-gated nanopores controlled by electrically tunable in-pore chemistry

Makusu Tsutsui et al. Nat Commun. .

Abstract

Gating is a fundamental process in ion channels configured to open and close in response to specific stimuli such as voltage across cell membranes thereby enabling the excitability of neurons. Here we report on voltage-gated solid-state nanopores by electrically tunable chemical reactions. We demonstrate repetitive precipitation and dissolution of metal phosphates in a pore through manipulations of cation flow by transmembrane voltage. Under negative voltages, precipitates grow to reduce ionic current by occluding the nanopore, while inverting the voltage polarity dissolves the phosphate compounds reopening the pore to ionic flux. Reversible actuation of these physicochemical processes creates a nanofluidic diode of rectification ratio exceeding 40000. The dynamic nature of the in-pore reactions also facilitates a memristor of sub-nanowatt power consumption. Leveraging chemical degrees of freedom, the present method may be useful for creating iontronic circuits of tunable characteristics toward neuromorphic systems.


Conflict of interest statement

Competing interests: The authors declare no competing interests.

Figures
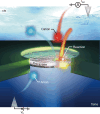
Fig. 1
Fig. 1. Transmembrane voltage-controlled precipitation reactions inside a nanopore.
A Schematic illustration depicting ion transport-triggered precipitation reaction inside a nanopore. The transmembrane voltage Vb induces the electromigration of ions. The resulting cation flow causes chemical reactions to form or dissolve a metal phosphate compound in a voltage-controllable fashion. The associated dynamic change in the effective pore size is measured by the ionic current Iion.
Fig. 2
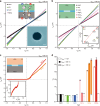
Fig. 2. Ionic current rectifications in nanopores under salt difference.
a Iion versus Vb characteristics obtained for a 300 nm diameter pore with the cis side filled with 1.37 M NaCl (black), 2 M KCl (green), 2 M CsCl (blue), and 2 M MgCl2 (pink) while the trans side always with 1.37 M NaCl (pH 7.4). Red and dark yellow dashed lines are linear fitting to the plots at the negative and positive Vb regimes, respectively, which give the slopes α and β. Inset sketch depicts the difference in the electromigration of cations and anions under negative (left) and positive Vb (right). The scanning electron micrograph displays a 300 nm nanopore. Scale bar denotes 100 nm. b The ion transport properties under no salt difference (NaCl (black), KCl (green), CsCl (blue), MgCl2 (pink), MnCl2 (magenta), and CaCl2 (orange)). The salinity was also the same at cis and trans (1.37 M for NaCl and 2 M for the rest of the salts). The inset plots α (red) and β (dark yellow) in a as a function of the nanopore conductance Gpore with no salt difference. c Ionic current rectifications were observed for 2 M CaCl2 (orange) and MnCl2 (red) at the cis with the trans filled with 1.37 M NaCl (pH 7.4). Inset is a magnified view of the suppressed ionic current at Vb < 0 V. d The rectification ratio rrec at Vb = ±1 V obtained from the ionic current characteristics measured in pores of three different diameter dpore and various salts at the cis (with the trans filled with 1.37 M NaCl at pH 7.4). rrec tends to be close to 1 when the IionVb characteristics show ohmic behaviors. On the other hand, rrec > 1 denotes Iion suppression at negative transmembrane voltage. The high rrec for the 3 μm micropore with CaCl2 is a result obtained at a low Vb scan rate of 6.5 mV s−1 (marked by an asterisk), while the other data are of 65 mV s−1. Note that the rectification ratio attains over 40,000 for the case of a 300 nm-sized nanopore with a MnCl2/NaCl configuration. Each error bar denotes the standard deviation of three independent IionVb measurements performed on a nanopore. (The results in Supplementary Figs. 3 and 6 are not included.) Source data are provided as a Source Data file.
Fig. 3
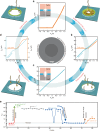
Fig. 3. Cation flow-mediated precipitation/dissolution reactions of metal phosphates in nanopores.
a Change in the nanopore temperature Tpore during voltage scans for a 60 nm nanopore with the CaCl2/NaCl configuration. Red and blue plots were recorded during negative and positive Vb scans, respectively. Inset electron micrograph at the upper left shows the device used for the measurement, where the Au/Pt thermocouple was used to probe the temperature at the point of contact in the vicinity of the pore. The plots at the lower right are the transmembrane ionic current simultaneously recorded with the thermovoltage Vt at the thermocouple representing rectifying behavior. b TporeVb characteristics acquired for a MgCl2/NaCl system. Arrows denote the voltage scan directions (positive (blue) and negative (red)). No notable change in the nanopore temperature was observed reflecting the small reaction heat generated in the precipitation/dissolution of magnesium phosphates. c Simultaneously recorded IionVb characteristics demonstrating ionic current rectification similar to the case in the MgCl2/NaCl system (pink open circles). The result for the CaCl2/NaCl configuration is also shown (orange solid circles). Voltage scan rate is 1 mV s−1 in (df).
Fig. 4
Fig. 4. In-pore reaction-mediated memory effect in micropore ionic conductance.
a Originally, a 3 μm micropore with a CaCl2/NaCl arrangement behaved as an ohmic resistor at a voltage scan rate higher than 65 mV s−1. However, the lower scan rate of 6.5 mV s−1 led to the emergence of extreme rectification suggestive of precipitation/dissolution reactions of calcium phosphates in the pore. b and c Meanwhile, repetitively scanning Vb at a faster rate (650 mV s−1), the micropore gradually returned to exhibit a resistor-like behavior. d Subsequent scanning at 65 mV s−1 can further make the micropore a diode. The image at the center is a scanning electron micrograph of the micropore of 3 μm diameter. e Changes of the rectification behaviors upon the repetitive voltage scanning. Dotted line denotes rrec = 1.
Fig. 5
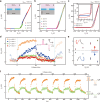
Fig. 5. In-pore chemical reaction-driven nanofluidic memristor.
a and b IionVb characteristics of a 300 nm-sized nanopore with an MnCl2/NaCl configuration measured under various ranges of transmembrane voltages (±0.1 V (purple), ±0.2 V (pink), ±0.3 V (sky blue), ±0.4 V (dark yellow), ±0.5 V (green), ±1.0 V (blue), ±1.5 V (red)). The insets display the solution configuration around the nanopore membrane in skyblue, where the cis (pink) and trans (gray) compartments are filled with the MnCl2 and NaCl solutions, respectively. Note the Iion remains suppressed when scanning Vb between −0.1 and 0.1 V (b). c Scan rate dependence of IionVb displaying pinched hysteresis loops at 6.5 mV s−1 (blue) and 325 mV s−1 (red). Inset shows a magnified view of the suppressed Iion states. d Memristive characteristics under the applications of 50 ms transmembrane voltage pulses of ±0.2 V (red), ±0.4 V (green), ±0.6 V (blue), and ±0.8 V (orange) amplitudes. ΔIion is the ionic current recorded at +0.1 V after each voltage pulsing (the baseline current was subtracted). The positive and negative pulses drive the potentiation and depression processes of the nanopore memristor via the induced in-pore dissolution/precipitation reactions. Skyblue and purple dashed lines denote the timing when the sign of the voltage pulses were switched from negative to positive and positive to negative, respectively. e The ionic current change Ip (defined as Iion at the point when the sign of Vp was inverted) by the positive (red) and negative (blue) voltage pulses of amplitudes Vp. Error bars denote the standard deviations within four independent cycles of potentiation/depression processes on a nanopore. Source data are provided as a Source Data file. f Potentiation/depression of the nanopore memristors under the voltage pulses of Vp = ±0.8 V (orange solid circles) and ±0.4 V (green open circles). Read voltage was +0.1 V.
Fig. 6
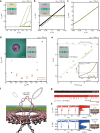
Fig. 6. Single-molecule sensing using a precipitated nanopore.
a IionVb characteristics of a 300 nm-sized nanopore with an AlCl3/NaCl configuration. The ionic conductance decreased steadily when repeating the voltage scans. b The ionic current curves in 1.37 M NaCl solution at pH 7.4 before (black) and after (dark yellow) the measurements with AlCl3. c Magnified view of (b) depicting the lowered nanopore conductance after the aluminum phosphate precipitation. d The conductance Gpore of the aluminum phosphate-precipitated nanopore in NaCl solutions of various salt concentrations cion (dark yellow solid circles). Schematic illustration displays the solution configuration around the nanopore membrane, where the SiNx membrane and the precipitated layer are shown in skyblue and green, respectively. Simulation using the theoretical model in ref. under the assumed fully dissolved CO2 is shown by pink open circles. Inset is a false-colored scanning electron micrograph taken after the precipitation reaction. Scale bar denotes 100 nm. e Diffusion voltage Vdif obtained for the nanoprecipitated nanopore under salinity difference applied by changing the NaCl concentration at the cis (ccis) while keeping the trans at ctrans = 1.37 M. Dark yellow dashed line is a Nernst equation fit to the Vdif–ln(ccis/ctrans) plots. Results of a pristine nanopore were also shown for comparison as gray open circles. Gray dashed line points at zero diffusion voltage. Inset shows the IionVb curve at 106 salinity difference displaying open circuit voltage comprised of the redox potential Vred and Vdif. f Single-molecule detections of polynucleotides by ionic current. The sketch describes the electrophoretic translocation of ColE1 DNA. g The ionic current traces without (black) and with DNA (red) added in 1.37 M NaCl solution. Resistive pulses denote the translocation of DNA through the nanopore. h Resistive pulse signal waveforms. When linear DNA was detected, the ionic signals tended to exhibit stepwise changes attributed to their folding conformations (red). Two peaks were found, accordingly, in the ionic current histogram. White curves are Gaussian fittings denoting ionic current blockade by non-folded and single-folded linear DNA in the nanopore, respectively. Meanwhile, single pulses of larger amplitudes were also found, which denote the translocation of DNA in circular cyclic forms.

Similar articles

References

    1. Wu, C., Xing, Z., Yang, S., Li, Z. & Zhou, W. Nanoreactors for photocatalysis. Coord. Chem. Rev.477, 214939 (2023).
    1. Wang, X. et al. A closed-loop catalytic nanoreactor system on a transistor. Sci. Adv.9, adj0839 (2023). - PMC - PubMed
    1. Swisher, J. H., Jibril, L., Petrosko, S. H. & Mirkin, C. A. Nanoreactors for particle synthesis. Nat. Rev. Mater.7, 428–448 (2022).
    1. Venta, K., Wanunu, M. & Drndic, M. Electrically controlled nanoparticle synthesis inside nanopores. Nano Lett.13, 423–429 (2013). - PMC - PubMed
    1. Wood, M. & Zhang, B. Bipolar electrochemical method for dynamic in situ control of single metal nanowire growth. ACS Nano9, 2454–2464 (2015). - PubMed

LinkOut - more resources