. 2025 Feb 5;16(1):1378.
doi: 10.1038/s41467-025-56347-2.

Brd7 loss reawakens dormant metastasis initiating cells in lung by forging an immunosuppressive niche

Affiliations

Brd7 loss reawakens dormant metastasis initiating cells in lung by forging an immunosuppressive niche

Jayanta Mondal et al. Nat Commun. .

Abstract

Metastasis in cancer is influenced by epigenetic factors. Using an in vivo screen, we demonstrate that several subunits of the polybromo-associated BAF (PBAF) chromatin remodeling complex, particularly Brd7, are required for maintaining breast cancer metastatic dormancy in the lungs of female mice. Brd7 loss induces metastatic reawakening, along with modifications in epigenomic landscapes and upregulated oncogenic signaling. Breast cancer cells harboring Brd7 inactivation also reprogram the surrounding immune microenvironment by downregulating MHC-1 expression and promoting a pro-metastatic cytokine profile. Flow cytometric and single-cell analyses reveal increased levels of pro-tumorigenic inflammatory and transitional neutrophils, CD8+ exhausted T cells, and CD4+ stress response T cells in lungs from female mice harboring Brd7-deficient metastases. Finally, attenuating this immunosuppressive milieu by neutrophil depletion, neutrophil extracellular trap (NET) inhibition, or immune checkpoint therapy abrogates metastatic outgrowth. These findings implicate Brd7 and PBAF in triggering metastatic outgrowth in cancer, pointing to targetable underlying mechanisms involving specific immune cell compartments.


Conflict of interest statement

Competing interests: All the authors declare no competing interests.

Figures
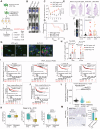
Fig. 1
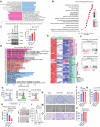
Fig. 1. In vivo epigenetic screening implicates PBAF and BRD7 in breast cancer lung metastatic dormancy.
A Design of in vivo loss of function screen. After transduction with the mouse epigenetic shRNA libraries, the 4T07-TGL cells were injected i.v. into syngeneic Balb/cJ mice. Candidate suppressors of metastasis were ascertained by sequencing analysis of lung metastatic lesions and were further validated by additional shRNA studies. B, C 4T07-TGL cells with scrambled sgRNA vector (sgCtr) or Brd7 knockout were injected i.v. into syngeneic mice. (4T07-TGL-sgctr, n = 15 mice; 4T07-TGL-Brd7 KO1, n = 15 mice; 4T07-TGL-Brd7 KO2, n = 15 mice). The extent of lung colonization was measured by bioluminescent imaging. Panels show representative images (B), and quantified normalized photon flux at the indicated time points, error bars represent SD (C). D Kaplan-Meier survival analysis for mice injected with the indicated cell lines. E Representative H&E-stained images of lungs extracted from mice injected with the indicated cell lines at the experimental endpoint. F Quantified lung metastatic lesions in control and Brd7 KO mice (mean ± SEM.; 4T07-TGL-sgctr, n = 15 mice; 4T07-TGL-Brd7 KO1, n = 15 mice; 4T07-TGL-Brd7 KO2, n = 15 mice). Error bars represent SEM. G Representative images of lung sections subjected to IF for the indicated markers. Control (sgCtr) and Brd7 knockout (KO1 and KO2) 4T07-TGL cells were inoculated i.v., and lung sections stained with anti-Ki-67, anti-GFP and DAPI (G). H Bar graph showing the percentage of tumor cells with positive Ki-67 IF at the indicated times. (4T07-TGL-sgctr, n = 5 mice; 4T07-TGL-Brd7 KO1, n = 5 mice; 4T07-TGL-Brd7 KO2, n = 5 mice) *p < 0.05, **p < 0.01. Error bars represent SEM. I, J Kaplan-Meier analysis of distant metastasis-free survival (I) and relapse-free survival (J) in publicly available breast cancer datasets of the indicated subtype (source: KM Plotter for breast cancer). Patients were divided according to BRD7 expression level with the cutoff at 50%. HR, hazard ratio. K PBAF subunit (BRD7, PBRM1, and ARID2) expression in breast cancer primary and metastatic tumors; dataset indicated. *p < 0.05, **p < 0.01. [BRD7: Primary (n = 15 patients)- Minima = 6.966, Maxima = 10.996, Median expression = 9.627, Metastasis (n = 60 patients) – Minima = 8.380, Maxima = 10.759, Median expression = 9.354; PBRM1: Primary (n = 15 patients)- Minima = 10.087, Maxima = 12.162, Median expression = 11.349, Metastasis (n = 60 patients)- Minima = 9.471, Maxima = 12.045, Median expression = 10.115; ARID2: Primary (n = 15 patients)- Minima = 8.755, Maxima = 12.656, Median expression = 11.490, Metastasis (n = 60 patients)- Minima = 8.272, Maxima = 11.718, Median expression = 9.574 (L) PBAF specific subunit expression in normal breast tissue, breast primary tumor and metastases from TCGA invasive breast cancer dataset [Normal (n = 113 patients)- Minima = 775,Maxima = 5805, Median expression = 2018; Primary (n = 1210 patients)- Minima = 110,Maxima = 10285, Median expression = 1563; and Metastasis (n = 7 patients)- Minima = 611,Maxima = 1960, Median expression = 836). M Representative immunohistochemistry (IHC) staining for paired primary tumor and lung metastasis sections in breast cancer tissue microarrays. BRD7 expression was quantified by stain intensity across n = 3 independent tumor regions obtained from n = 1 female breast cancer patient. ****p < 0.0001. Statistical analysis by unpaired two-tailed t test, in all panels, error bars represent SD. 95% CI was used to analyze the results. Source data are provided as a Source Data file.
Fig. 2
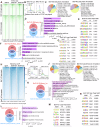
Fig. 2. Brd7 loss modulates cell autonomous and immune microenvironmental functionalities.
A Gene Set Enrichment Analysis (GSEA) of transcriptional profiles from Control (sgCtr) and Brd7 KO (KO1 and KO2) 4T07-TGL cells. The top 10 enriched pathways in control or Brd7 KO cells were ranked by normalized enrichment score (NES) with FDR < 0.25, p < 0.05. B Gene Ontology (GO) analysis of upregulated genes in Brd7 knockout 4T07-TGL cells. p < 0.05. C Control (sgCtr) and Brd7 knockout (KO1 and KO2) 4T07-TGL cells were subjected to immunoblotting for AKT phosphorylation at Ser473, along with total AKT, Brd7, and GAPDH (loading control). Quantification of the Western Blot results obtained from N = 3 independent experiments. The samples were derived from the same experiment, but different gels for Brd7, GAPDH, another for pAKT, AKT were processed in parallel. For Brd7 and GAPDH, the membrane was incubated overnight with Rabbit anti-Brd7 and Mouse anti-GAPDH antibody at same time, and then incubated with anti-rabbit IGg and anti-mouse IGg antibody at same time. D Gene Ontology (GO) analysis of downregulated genes in Brd7 KO 4T07-TGL cells. p < 0.05. E Heat map of top differentially expressed genes related to antigen presentation and response to interferon between control and Brd7 KO 4T07-TGL cells. F Hallmark_ALPHA_RESPONSE and HALLMARK_T_CELL_ RECEPTOR_SIGNALING gene sets were significantly enriched in control 4T07-TGL cells compared to Brd7 KO cells. G, H H-2Kd/H-2Dd expression in Control (sgCtr) and Brd7 KO (KO1 and KO2) 4T07-TGL cells as detected by flow cytometry. The mean intensity of H-2Kd/H-2Dd was quantified (H). Quantification of the FACS results was obtained from N = 3 biological replicates (I, J) Representative images of MHC-1 immunohistochemistry staining performed on lung tissue sections obtained from the indicated mice cohorts (I), and quantification of MHC−1 mean intensity is plotted (sgCtr = 3 mice; Brd7-KO = 4 mice)(J). KP In vitro colony formation (K), tumor sphere (M), and migration (O) assays for Control (sgCtr) and Brd7 KO (KO1 and KO2) 4T07-TGL cells. Bar graphs show quantification assay results obtained from N = 3 independent biological replicates obtained from indicated groups (L, N, P). Statistical analysis by unpaired two-tailed t test; in all panels, error bars represent SD. 95% CI was used to analyze the results. Source data are provided as a Source Data file.
Fig. 3
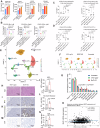
Fig. 3. Brd7 loss alters chromatin accessibility and modulates immune regulatory enhancer elements.
A ATAC-seq was performed in Control (shNTC) and Brd7-KD (Brd7-sh1 and Brd7-sh4) 4T07-TGL cells. Chromatin accessibility heat maps for gained (top panel) and lost (bottom panel) peaks in Brd7-KD 4T07-TGL cells. Peaks were rank ordered by intensity per million mapped reads (RPM). B Overall aggregated enrichment signals within 3 kb of peak centers for differentially accessible regions. C Genomic annotation of gained peaks (left panel) and lost peaks (right panel). D GO analysis of overlap between upregulated genes in Brd7-KD samples (RNAseq) and genes associated with gained ATAC-seq peaks in Brd7-KD samples. E Top 13 gained peak motifs from these overlapping loci and corresponding transcriptional factors. F GO analysis of overlap between downregulated genes in Brd7-KD samples (RNAseq) and genes associated with lost ATAC-seq peaks in Brd7-KD samples showing enrichment for immune regulation pathways. G Top 8 enriched binding motifs from these overlapping loci and predicted transcriptional factors. H Heatmap showing ChIP-Seq signals for H3K27ac peak regions, rank ordered by intensity per million mapped reads (RPM). I Overall H3K27ac peak signal between − 3 kb and 10 kb relative to peak center for gained or lost peaks in Brd7-KO cells. J Genomic annotation of gained (left panel) and lost (right panel) H3K27ac peak distribution. K, L Gene Ontology (GO) analysis of overlap between upregulated genes (RNAseq) and genes associated with gained H3K27ac peaks in Brd7-KO samples (K; N = 224)) and between downregulated genes (RNAseq) and genes associated with lost H3K27ac peaks in Brd7-KO samples (L; N = 55). M, N Top binding motifs in Brd7-KO cells associated with lost (M) and gained (N) H3K27ac and predicted transcriptional factors.
Fig. 4
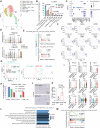
Fig. 4. BRD7 loss reprograms the tumor immune microenvironment to craft an immunosuppressive metastatic niche.
A Luminex analysis on conditioned supernatants showing significantly increased levels of 4 pro-metastatic cytokines—CXCL10, CCL5, CCL2, and CCL20—in Brd7-KO 4T07-TGL cells relative to controls (sgCtr). **p < 0.01, ***p < 0.001. Statistical analysis by unpaired two-tailed t test; in all panels, error bars represent SD. Supernatants were obtained from N = 3 independent biological replicates from each of the indicated groups. B CCL20, CCL5, and CXCL10 expression by Luminex assay in Brd7 KO and sgCtr 4T07-TGL cells treated with either vehicle (DMSO) or the PI3K inhibitor LY294002. Supernatants were obtained from N = 3 independent biological replicates from each of the indicated groups. **p < 0.01, ***p < 0.001. Statistical analysis by unpaired two-tailed t test; in all panels, error bars represent SD. C, D Immunophenotypic flow cytometry on dissociated lungs removed from naïve 8-weeks old Balb/cJ mice or similarly aged littermates 14 days after injection with either control or Brd7 KO 4T07-TGL cells. (**p < 0.01, ***p < 0.001; WT naïve mice lungs, N = 4 mice; 4T07-TGL lungs, N = 4 mice; 4T07-TGL-Brd7 KO1 lungs, N = 4 mice; 4T07-TGL-Brd7 KO2 lungs, N = 4 mice). Statistical analysis by unpaired two-tailed t test. EG Single-cell analyses of immune cell populations derived from dissociated lungs removed from naïve 8-weeks old Balb/cJ mice or similarly aged littermates 14 days after injection with either control or Brd7-KO 4T07-TGL cells (WT untreated naïve mice lungs, N = 3 mice; 4T07-TGL lungs, N = 3 mice; 4T07-TGL-Brd7 KO1 lungs, N = 3 mice). UMAP plots show clustering and transcriptional assignments for all assessed cells (E). and cells separated by murine cohort (naïve (untreated), control (4T07), and Brd7 KO) (F). Bar graph showing the composition of different immune compartments in the indicated murine cohorts. ***p < 0.001. Statistical analysis by unpaired two-tailed t test; in all panels, error bars represent SD (G). HK Represent images of the H&E-stained (H) and immunohistochemistry (IHC)-stained (MPO (I), neutrophil elastase (K), and CD8 (M)) lung sections of mice from the indicated murine cohorts. (J, L, N) Quantification of IHC staining (For MPO and NE staining:4T07-TGL-Brd7 KO, N = 4 mice, 4T07-TGL-sgCtr,N = 3 mice; For CD8 + staining: 4T07-TGL-Brd7 KO, N = 3 mice, 4T07-TGL-sgCtr,N = 3 mice). *p < 0.05, **p < 0.01. Statistical analysis by unpaired two-tailed t test; in all panels, error bars represent SD. O Spearman correlation between BRD7 expression and overall immune infiltration in breast cancer patients (BRCA_MBC patient dataset). 95% CI was used to analyze the results. Source data are provided as a Source Data file.
Fig. 5
Fig. 5. CD8 + exhausted T cells and stress response CD4 + T cells are enriched in breast cancer lung metastasis upon Brd7 loss.
A UMAP plot showing clustering and transcriptional assignments for CD3 + cell populations derived from dissociated lungs removed from naïve 8-weeks old Balb/cJ mice or similarly aged littermates 14 days after injection with either control or Brd7 KO 4T07-TGL cells. B Bar graph showing the composition of different T cells compartments in the indicated murine cohorts. (WT untreated naïve mice lungs, N = 3 mice; 4T07-TGL lungs, N = 3 mice; 4T07-TGL-Brd7 KO1 lungs, N = 3 mice). Statistical analysis by unpaired two-tailed t test; in all panels, error bars represent SD. C Dot plot showing marker gene expression levels in different T cell compartments. D Hspa1a and Hspa1b expression of different T cell compartments in the indicated murine cohorts. Statistical analysis by unpaired two-tailed Mann-Whitney test; **p < 0.01, ***p < 0.001. E Gene Set Enrichment Analysis (GSEA) of cluster T2 gene expression in response to Brd7 loss in 4T07-TGL cells; HALLMARK REACTIVE OXYGEN PATHWAY and HALLMARK APOPTOSIS gene sets were significantly enriched. F UMAP plots showing the expression of T-cell cytotoxic and exhaustion marker genes (Cd8b1, Gzma, Cd44, Gzmk, Ifng, Ctla4, Lag3, Pdcd1, and Tigit) in cluster T4 subpopulations. G UMAP plots showing CD8 + Teff, Tmem T cells, and Tex T cells in the indicated murine cohorts. H Bar graph showing the composition of CD8 + Teff, Tmem T cells, and Tex T cells in the indicated murine cohorts. I Exhaustion marker gene expression in cluster T4 cells in the indicated murine cohorts. Statistical analysis by unpaired two-tailed Mann-Whitney test; *p < 0.05, ****p < 0.0001, ns: not significant. J, K Representative images (J) and quantification (K) of CTLA4 IHC for lung sections in the indicated murine cohorts. (sgCtr = 3 mice; Brd7-KO = 4 mice) **p < 0.01; statistical analysis by unpaired two-tailed t test; in all panels, error bars represent SD. L, M Gene Set Enrichment Analysis (GSEA) of cluster T4 gene expression in Brd7 KO versus control murine cohorts. The negative regulation of the immune system process gene set was found to be significantly enriched in the Brd7 KO group (M). 95% CI was used to analyze the results. Source data are provided as a Source Data file.
Fig. 6
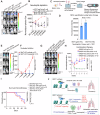
Fig. 6. Targeting the immune microenvironment abrogates Brd7-deficient breast cancer metastatic outgrowth in lung.
A, B Mice were treated with anti-Ly6G (300 µg/mice) or isotype control antibody every other day starting 5 days prior to injection with either 4T07 control or 4T07 Brd7 KO cells (Brd7 KO-Anti-Ly6G, N = 9 mice;Brd7 KO-IgG, N = 8 mice; 4T07-TGL-Anti-Ly6G,N = 8 mice; 4T07-TGL-IgG,N = 8 mice). Representative bioluminescence images for the indicated murine cohorts at 30 min, 2 weeks, and 4 weeks post tumor cell injection (A). Line graph showing normalized photon flux for the indicated murine cohorts over time (B). ****p < 0.0001. Statistical analysis by unpaired two-tailed Mann-Whitney test; error bars represent SEM. C Experiment design of neutrophil/cancer cell co-culture and NET quantification. D NET extracellular DNA quantification by Sytox Orange fluorescence for the indicated co-cultures. (**p < 0.01; N = 6) Statistical analysis by unpaired two-tailed t test; in all panels, error bars represent SEM. E, F Mice were treated with the NET inhibitor Sivelestat or vehicle every other day starting 5 days prior to injection with either 4T07 control or 4T07 Brd7 KO cells (Brd7 KO-Vehicle treatment, N = 10;Brd7 KO-Sivelestat treatment, N = 10). Represent bioluminescence images for the indicated murine cohorts at 30 min, 1 week, and 4 weeks post tumor cell injection (E). Line graph showing the normalized photon flux for the indicated murine cohorts over time (F). ****p < 0.0001. Statistical analysis by unpaired two-tailed Mann-Whitney test; error bars represent SEM. G, H Mice were treated with isotype control, Anti-LAG3, Anti-CTLA4, or both Anti-LAG3 and Anti-CTLA4 every other day starting 1 day after cancer cell injection until Week 5 (Brd7 KO-Anti-LAG3, N = 10 mice;Brd7 KO-Anti-CTLA4, N = 10 mice; 4T07-TGL-Anti-LAG3 + CTLA4, N = 10 mice; 4T07-TGL-Brd7 KO-IgG, N = 10 mice). Representative bioluminescence images for the indicated murine cohorts at 30 min, 2 weeks, and 5 weeks post tumor cell injection (G). Line graph showing the normalized photon flux for the indicated murine cohorts over time (H). ****p < 0.0001. Statistical analysis by unpaired two-tailed Mann-Whitney test; error bars represent SEM. I Kaplan-Meier survival analysis for the indicated murine cohorts. Statistical analysis by log-rank test. ***p < 0.001, ns, not significant. J Schematic of the mechanism(s) governing BRD7-deficient breast cancer lung metastatic outgrowth. 95% CI was used to analyze the results unless mentioned otherwise. Source data are provided as a Source Data file.

References

    1. Seyfried, T. N. & Huysentruyt, L. C. On the origin of cancer metastasis. Crit. Rev. Oncog.18, 43–73 (2013). - PMC - PubMed
    1. Fares, J. et al. Molecular principles of metastasis: a hallmark of cancer revisited. Signal Transduct. Target. Ther.5, 28 (2020). - PMC - PubMed
    1. Łukasiewicz, S. et al. Breast Cancer-Epidemiology, Risk Factors, Classification, Prognostic Markers, and Current Treatment Strategies-An Updated Review. Cancers13, 4287 (2021). - PMC - PubMed
    1. Jin, L. et al. Breast cancer lung metastasis: Molecular biology and therapeutic implications. Cancer Biol. Ther.19, 858–868 (2018). - PMC - PubMed
    1. Xiao, W. et al. Risk factors and survival outcomes in patients with breast cancer and lung metastasis: a population-based study. Cancer Med.7, 922–930 (2018). - PMC - PubMed

MeSH terms

Substances