. 2025 Feb 5;16(1):1373.
doi: 10.1038/s41467-025-56378-9.

An oligodendrocyte silencer element underlies the pathogenic impact of lamin B1 structural variants

Affiliations

An oligodendrocyte silencer element underlies the pathogenic impact of lamin B1 structural variants

Bruce Nmezi et al. Nat Commun. .

Abstract

The role of non-coding regulatory elements and how they might contribute to tissue type specificity of disease phenotypes is poorly understood. Autosomal Dominant Leukodystrophy (ADLD) is a fatal, adult-onset, neurological disorder that is characterized by extensive CNS demyelination. Most cases of ADLD are caused by tandem genomic duplications involving the lamin B1 gene (LMNB1) while a small subset are caused by genomic deletions upstream of the gene. Utilizing data from recently identified families that carry LMNB1 gene duplications but do not exhibit demyelination, ADLD patient tissues, CRISPR edited cell lines and mouse models, we have identified a silencer element that is lost in ADLD patients and that specifically targets expression to oligodendrocytes. This element consists of CTCF binding sites that mediate three-dimensional chromatin looping involving LMNB1 and the recruitment of the PRC2 transcriptional repressor complex. Loss of the silencer element in ADLD identifies a role for non-coding regulatory elements in tissue specificity and disease causation.


Conflict of interest statement

Competing interests: The authors declare no competing interests

Figures

Fig. 1
Fig. 1. MR image series of subjects with LMNB1 duplications.
Images I-V are axial slices of the brain and images VI parts of the middle sagittal slices. Subjects of the families F1, F2, and F3 did not exhibit leukodystrophic changes (ac), but the oldest subjects had age-related hyperintensities, best seen in F1-2 periventricularly (a.IV, arrows) and as small foci in deep white matter (a.V, one marked with an arrow). Subject F4-1 showed a pathologic high signal intensity in the pyramids of the medulla oblongata (d.I, arrow), in the pons and middle cerebellar peduncles (d.II), mesencephalon (d.III), and in all cerebral lobes (d.III-V). A less affected periventricular rim in T2w SE images (d.IV, arrows) is characteristic for LMNB1-related leukodystrophy. The corpus callosum is thin (d.VI, arrow). For comparison, images of two subjects from other families with a canonical ADLD-causing LMNB1 duplication are presented (e, f). The subject at the age 35 was still asymptomatic but had a mild T2 signal intensity increase in the pyramids (e.I, arrow), in the middle and upper cerebellar peduncles (e.II-III, white arrows), and in the corticospinal tracts both in the mesencephalic (e.III, black arrow) and uppermost parts (e.V, arrow). The other subject was 65 years old and had a clinical disease. She exhibited similar MR abnormalities to those in F4-1. A pathologic high signal intensity in the pyramids of the medulla oblongata (f.I, arrow), in the pons and cerebellar peduncles (f.II), mesencephalon (f.III), and in all cerebral lobes (f.III-V). A less affected periventricular rim is seen in T2w SE images (f.IV, arrows) and the corpus callosum is thin (f.VI, arrow). Abbreviations: T2w T2-weighted, T1w T1-weighted, SE spin echo sequence, FLAIR fluid attenuated inversion recovery sequence, GRE gradient echo sequence, TFE turbo field echo sequence.
Fig. 2
Fig. 2. LMNB1 structural variants and expression analysis.
a Schematic of duplications in LN-Dup (F1-F3, green) and F4 (yellow) families. For the canonical disease-causing duplication (blue), duplications were composites based on previous reports where precise duplication boundaries were identified. ADLD-Dup majority (dark blue) represents the maximal extent of all disease-causing duplications from multiple families, the centromeric end of which extends to chr5:126683196. In one family, A8 (dark blue), the centromeric end of the duplication extended beyond the ADLD-Dup majority (chr5:126667592) and is shown separately. ADLD-Del Min (red) is a composite of multiple patients with deletions and represents the smallest deleted region causing ADLD,. ADLD-Crit 1 and ADLD-Crit 2 represent the smallest critical regions that are included in the ADLD-Del Min and LN-Dup but not in ADLD-Dup Majority or A8, respectively. Inset box shows the orientation of the various structural variants, with LMNB1 depicted as a black arrow. Both ADLD Dup and LN-Dup (F1-F3) have duplications with a similar head-to-tail tandem configuration, but LN-Dups are larger and contain more of the LMNB1 upstream regulatory region, towards the centromeric end. The F4 duplication is inverted and inserted into the original duplicated segment as previously described. b Fibroblasts from both LN-Dup and ADLD-Dup patients show significantly increased LMNB1 expression compared to controls, as measured by real time PCR. No difference is observed in LMNB1 expression between ADLD-Del2 and controls. Control n = 5; ADLD-Dup1 n = 3; ADLD-Dup3 n = 3; LN-Dup F2 n = 5; LN-Dup F3 n = 6; ADLD-Dup F4 n = 3; ADLD-Del2 n = 3. c ADLD-Dup and Del patients show significantly higher expression of LMNB1 in white matter vs. grey matter in comparison to control brain samples, as measured by real time PCR. Note that we did not have grey matter sample for the ADLD-Del-1 patient. *p < 0.05, **p < 0.01, ***p < 0.001. WM—Control n = 6; ADLD-Dup1 n = 5; ADLD-Dup2 n = 3; ADLD-Del1 n = 3. GM—Control n = 6; ADLD-Dup1 n = 5; ADLD-Dup2 n = 3. ADLD-Dup 1-3 and ADLD-Del 1-2 have been described previously,. For (b, c), all comparisons are between controls and LN-Dup or ADLD samples using one-way ANOVA. All samples are biological replicates and error bars are S.E.M.
Fig. 3
Fig. 3. Peripheral nerve degeneration in LMNB1 overexpressing TG mice.
a Real time PCR analysis from sciatic nerve samples from PLP-LMNB1 transgenic (TG) and WT mice demonstrate expression of the exogenous human LMNB1 (hLMNB1) only in TG samples. Mouse Lmnb1 (mLmnb1) expression is not altered between WT and TG samples. n = 3 independent mice for each group, ***p < 0.001, two-tailed t-test. b Representative western blot of sciatic nerves from WT and TG mice probed for endogenous mouse LMNB1, Flag-tagged exogenous hLMNB1 (arrows), and GAPDH as a loading control. MW—molecular weight markers in kDa. c Quantification of immunoblot demonstrating that total LMNB1protein (mLMNB1 and hLMNB1) is overexpressed in sciatic nerves from TG mice. n = 3 independent mice for each group, *p < 0.05, two-tailed t-tests. d Representative brightfield images of 20μm thick longitudinal sections of sciatic nerves from 9-month-old mice stained with luxol fast blue (LFB), scale bars = 100 μm. e Quantification of the LFB staining shows less LFB staining in nerves from 9-month TG mice when compared to WT controls. n = 3 independent mice samples for each group *p < 0.05, one-way ANOVA. f Representative TEM montages of semi-thin transverse sections of sciatic nerves from 9-month-old WT and TG mice stained with toluidine blue. g Representative zoomed in images of the sections in (f), scale bars = 50 μm. h Quantification of the number of myelinated axons. Sciatic nerves from 9-month-old TG mice have fewer myelinated axons than those from WT. n = 3 independent mice for each group, *p < 0.05, two-tailed t-tests. i Representative traces of recorded compound action potential (CAP) of Aβ large diameter fibers from sciatic nerves from 9-month-old WT (black line) and TG (red line) mice. j Quantification of conduction velocity in sciatic nerves from 9-month-old mice demonstrates slower conduction velocity in Aβ fibers from TG mice. n = 6 independent mice for each group, *p < 0.05, two-tailed t-tests. All data are presented as mean values +/- SEM.
Fig. 4
Fig. 4. Silencer model for LMNB1 overexpression in ADLD and generation of CRISPR/Cas9 mediated genomic deletions.
a Model 1—A silencer element acts to maintain low LMNB1 expression in oligodendrocytes (OLs). The silencer-LMNB1 interaction is disrupted in ADLD-causing variants but not in LN-Dup cases. Model 2—Based on a previous study of an ADLD-Del patient, proposes that the upstream deletion causes loss of a TAD boundary bringing an enhancer closer to LMNB1 leading to overexpression. However, it is unclear how this would explain why there is no disease due to LN-Dups. b UCSC genome browser view showing the syntenic ADLD-Crit 1 region in the mouse genome (134kb-Del, grey bar) deleted by CRISPR/Cas9. c Dual guide RNAs (G1 and G2) were cloned into a CRISPR/Cas9 plasmid followed by transfection and FACS sorting for GFP+ single cells. Deletion positive clones were identified by PCR screening using primers that amplify across the deletion junction. Only clones with deletions (+) will show a PCR product. d Representative DNA copy number analysis from positive Oli-neu clone with deletion using real time PCR demonstrates reduced copy number compared to control clone using primers within deleted region (red). n = 3 technical replicates for each clone, ***p < 0.001, two-tailed t-tests. Primers outside deleted region (blue and green) show copy number similar to control cells. e Sequencing deletion junctions using the junction PCR primers shown in (b) reveals each Oli-neu clone has a unique sequence due to imperfect repair after CRISPR/Cas9 mediated deletions. Protospacer Adjacent Motif (PAM) sites are highlighted in blue. Note that PAM sites can be located on the reverse strand, with their orientation indicated by arrows. f Lmnb1 mRNA expression as measured by real time PCR relative to βActin (Actb) is significantly higher in Oli-neu cells with the deletion but is not significantly altered in N2A cells and reduced in 3T3 cells, compared to control cell lines. Oli-neu, control n = 3, del n = 4; N2A, control & del n = 3; 3T3, control n = 5, del n = 4, *p < 0.05, two-tailed t-tests. In all cases, independent clones were used. For all graphs, data are presented as mean values +/− SEM.
Fig. 5
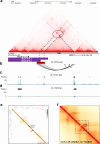
Fig. 5. Analysis of 3D chromatin interactions identify a LMNB1 regulatory element.
a Micro-C chromatin interaction map (hg38) from human Embryonic Stem Cells (hESC) reveals distinct long-range interactions between the LMNB1 promoter and upstream elements (dashed lines, oval). This 19 kb region (red bar) wholly overlaps ADLD Crit 1 and partially with ADLD Crit 2. The transcriptionally associated domain (TAD) containing LMNB1 is also depicted. b PLAC-Seq maps from human OLs confirm the interaction between the LMNB1 promoter and the 19 kb putative regulatory element. c ATAC seq data of human OLs identifies regions of open chromatin in the 19 kb region. d ChIP Seq data of human OLs reveals no enrichment of H3K27Ac in this region. Black bars above traces represent called peaks in both cases. e Single cell Hi-C data from human OLs reveals a similar interaction (oval) between LMNB1 promoter (arrow) and the 19 kb element (bar) as seen in (a). f The interaction (oval) between LMNB1 promoter (arrow) and the 19 kb regulatory element (bar) is recapitulated using the Orca simulation based on sequence data. Boxed region is the genomic segment depicted in (a). All coordinates are from the hg38 human genome build.
Fig. 6
Fig. 6. Orca simulation of 3D chromatin architecture in LMNB1 structural variants.
a Orca plot of reference human genome demonstrating interaction (horizontal oval) of the LMNB1 promoter (blue arrow) with 19 kb regulatory element (yellow bar). b Plot of ADLD-Dup majority demonstrating duplication of the LMNB1 gene but not the silencer element. ∆1 represents the strength of interaction of the 19 kb element and the non-duplicated LMNB1 promoter (horizontal oval) which is unchanged, while ∆2 represents the strength of interaction of 19 kb element with the duplicated LMNB1 gene (vertical oval) which is reduced. This reduction is represented in the Orca plots by a reduction in color intensity. The duplicated region is represented by grey and black bars on the left side of the plot. c The A8 ADLD-causing duplication contains only part of the putative silencer element. This SV also results in unchanged ∆1 (horizontal oval) and reduced ∆2 (vertical oval). In both (b, c), no other genomic regions are predicted to interact with either of the copies of the LMNB1 gene. d ADLD-Del results in loss of the putative silencer element (∆ cannot be calculated). This deletion results in the interaction (green oval) of an exogenous enhancer (green arrowhead) with LMNB1. Open arrowhead indicates the site of the junction subsequent to the deletion. e The ADLD-causing inverted duplication is inserted between the original copy of the LMNB1 gene and its cognate silencer element, resulting in the loss of interaction (reduced ∆1, horizontal oval). The interaction between the duplicated silencer and duplicated LMNB1 is unchanged (∆2, vertical oval). A detailed schematic of the Orca prediction for this SV is presented in Supplementary Fig. 7. f LN-Dup SVs duplicate both LMNB1 and the putative silencer element, and there is no alteration in the interaction between these two elements (∆1 and ∆2) in either of the duplicated copies (horizontal and vertical ovals). Note that no other potential regulatory genomic regions interact with either copy of the LMNB1 gene. g Deletion of the 19 kb putative silencer element does not result in new genomic interactions with LMNB1.
Fig. 7
Fig. 7. Deletion of the 19 kb regulatory element results in increased OL Lmnb1 expression and nuclear abnormalities.
a UCSC genome browser view of genomic segment encompassing mouse Lmnb1 showing the 134 kb and 19 kb deleted regions. b Real-time PCR analysis of Lmnb1 mRNA expression in Oli-neu, N2A and 3T3 cells with the 19 kb deletion. Lmnb1 expression is significantly higher in Oli-neu cells with the deletion but lowered in N2A and 3T3 cells, relative to their respective controls. Lmnb1 expression is normalized to β actin (Actb). Oli-neu, control n = 6, Del n = 4; N2A, control n = 6, Del n = 4; 3T3, control n = 5, Del n = 3. In all cases, independent clones were used. *p < 0.05, **p < 0.01, two-tailed t-test. c Real-time PCR analysis of Lmnb1 mRNA expression in primary oligodendrocyte progenitor cells (OPC), oligodendrocytes (OL), astrocytes (AS), and ear fibroblasts (Fib) isolated from Lmnb1-Del19 (Del-19) and control mice. For OPCs, OLs and AS, n = 3 for both control and Del-19. For Fib, n = 4 for both control and Del-19. ***p < 0.001, two-tailed t-test. Lmnb1 is significantly increased in OLs but reduced in astrocytes and unchanged in OPCs and fibroblasts. Data are presented as mean values +/− SEM for all graphs. d Representative epifluorescence images of cultured primary differentiated OLs from Del-19 mice and WT controls stained with antibodies against LMNB1 (green) and the OL-specific marker CNP (red). Scale bar = 50 μm. e LMNB1 staining of OL nuclei from WT and Del-19 mice demonstrate increased presence of misshapen nuclei in the latter (arrows). Scale bar = 50 μm. Violin plot quantifications of (f) LMNB1 intensity (n = 50 cells for both genotypes), g ratio of misshapen nuclei (n = 15 fields for both genotypes), and (h) circularity reveal (n = 77 cells for Control and 90 for Del-19) increased LMNB1 intensity and ratio of misshapen nuclei and decreased nuclear circularity in OLs from the Del19 mice relative to control cells. n. *p < 0.05. ***p < 0.001, two-tailed Mann-Whitney test.
Fig. 8
Fig. 8. Identification of CTCF & Suz12 binding in 19 kb silencer element and consequences of CTCF binding site deletion.
UCSC genome browser tracks of CUT&RUN analysis of CTCF in (a) human fibroblast, (b) mouse ES cells, (c) mouse primary oligodendrocytes (OL), and (d) SUZ12 in mouse primary OLs confirm bioinformatically predicted CTCF binding sites within 19 kb silencer element, and that SUZ12 associates with the CTCF2 region. Arrows point to the conserved CTCF 1 and CTCF 2 sites. Black bars above traces represent called peaks. e Schematic showing deletions of CTCF 1 and 2 sites. Real-time PCR analysis of Lmnb1 mRNA expression in Oli-neu, N2A and 3T3 cells with CRISPR-mediated deletions of (f) CTCF1 and (g) CTCF2. Lmnb1 expression is significantly higher in Oli-neu cells with CTCF1 deleted but lowered in N2A and 3T3 cells, relative to their respective controls. Lmnb1 expression is increased in Oli-neu and N2A cells with CTCF2 deleted but lowered in 3T3 cells. Lmnb1 is normalized to β Actin (Actb). Graphs are mean ± SEM. For CTCF1 - Oli-neu, control & del n = 3; N2A, control n = 5, del n = 3; 3T3, control n = 4, del n = 5. For CTCF2 - Oli-neu, control n = 6, del n = 4; N2A, control n = 6, del n = 4; 3T3, control n = 5, del n = 4. In all cases, independent clones were used. *p < 0.05, **p < 0.01, two-tailed tailed t-tests.
Fig. 9
Fig. 9. Epigenetic analysis and CTCF and PRC2 complex involvement in OL-specific Lmnb1 silencer element.
a Genome tracks of H3K27me3 CUT&RUN analysis of mouse OLs (upper panel). Black bars above traces represent called peaks. CUT&TAG analysis of mouse OLs, neurons and astrocytes (lower three panels). Enrichment of H3K27me3 in the 19 kb silencer (red bar and grey shaded region) element is observed specifically in OLs. CUT&TAG analysis is from previously published data. b Ctcf and Eed siRNA treatment of Oli-neu, N2A and 3T3 cell lines reveal increased Lmnb1 expression only in Oli-neu cells, relative to respective untreated cell-specific controls. Scrambled siRNA treatment has no effect on Lmnb1 expression. No increase in Lmnb1 expression is observed in Oli-neu cells with the 19 kb deletion (Oli-neu Δ19) relative to untreated D19 cells. Graphs are mean ± SEM. n = 3 biological replicates per cell type and treatment. ***p < 0.001, using two-way ANOVA and Dunnett’s multiple comparisons test.

Update of

References

    1. Raininko, R., Gosky, M.& Padiath, Q. S. LMNB1-related autosomal dominant leukodystrophy. In: GeneReviews((R)) (eds Adam MP, et al.) (2021). - PubMed
    1. Padiath, Q. S. & Fu, Y. H. Autosomal dominant leukodystrophy caused by lamin B1 duplications a clinical and molecular case study of altered nuclear function and disease. Methods Cell Biol.98, 337–357 (2010). - PubMed
    1. Padiath, Q. S. et al. Lamin B1 duplications cause autosomal dominant leukodystrophy. Nat. Genet38, 1114–1123 (2006). - PubMed
    1. Padiath, Q. S. Autosomal dominant leukodystrophy: a disease of the nuclear lamina. Front Cell Dev. Biol.7, 41 (2019). - PMC - PubMed
    1. Giorgio, E. et al. Analysis of LMNB1 duplications in autosomal dominant leukodystrophy provides insights into duplication mechanisms and allele-specific expression. Hum. Mutat.34, 1160–1171 (2013). - PMC - PubMed

Supplementary concepts

LinkOut - more resources