. 2025 Apr;5(4):691-708.
doi: 10.1038/s43587-024-00799-6. Epub 2025 Feb 5.

Sex-specific and cell-type-specific changes in chaperone-mediated autophagy across tissues during aging

Affiliations

Sex-specific and cell-type-specific changes in chaperone-mediated autophagy across tissues during aging

Rabia R Khawaja et al. Nat Aging. 2025 Apr.

Abstract

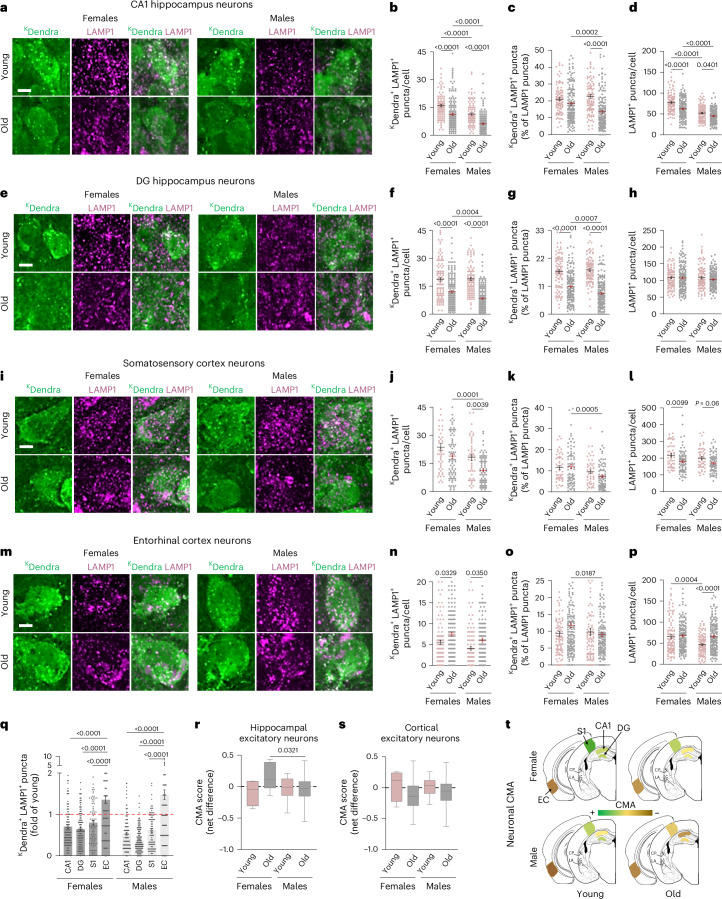
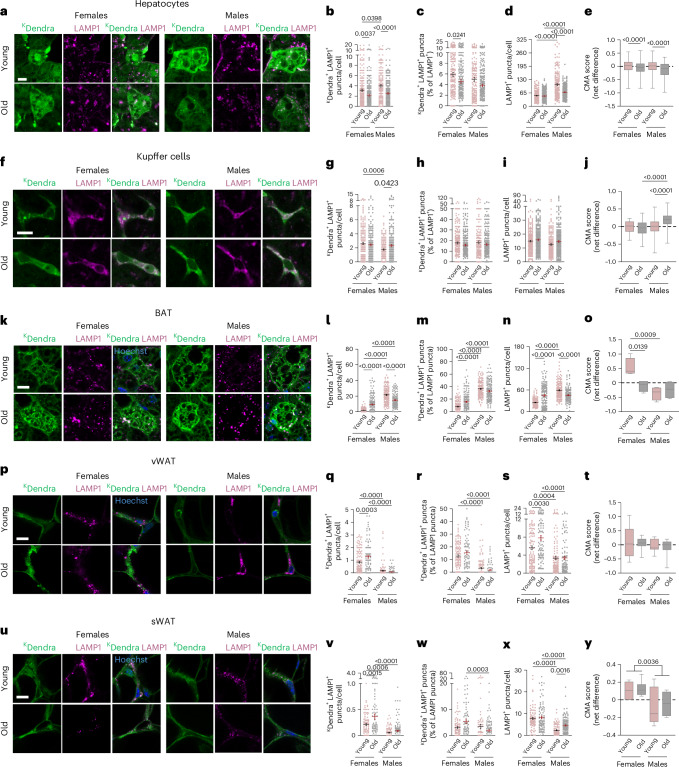
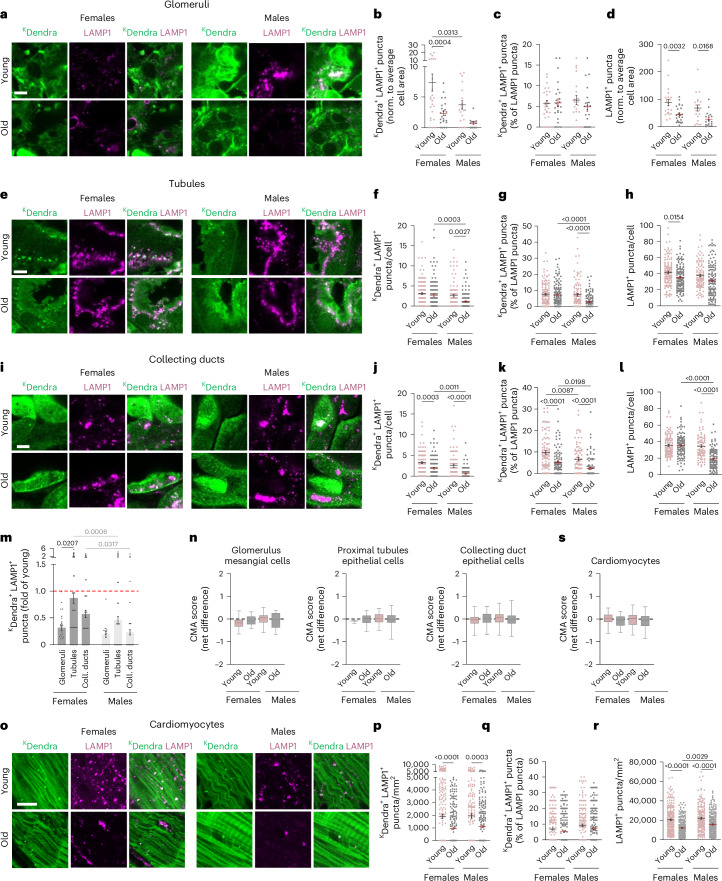
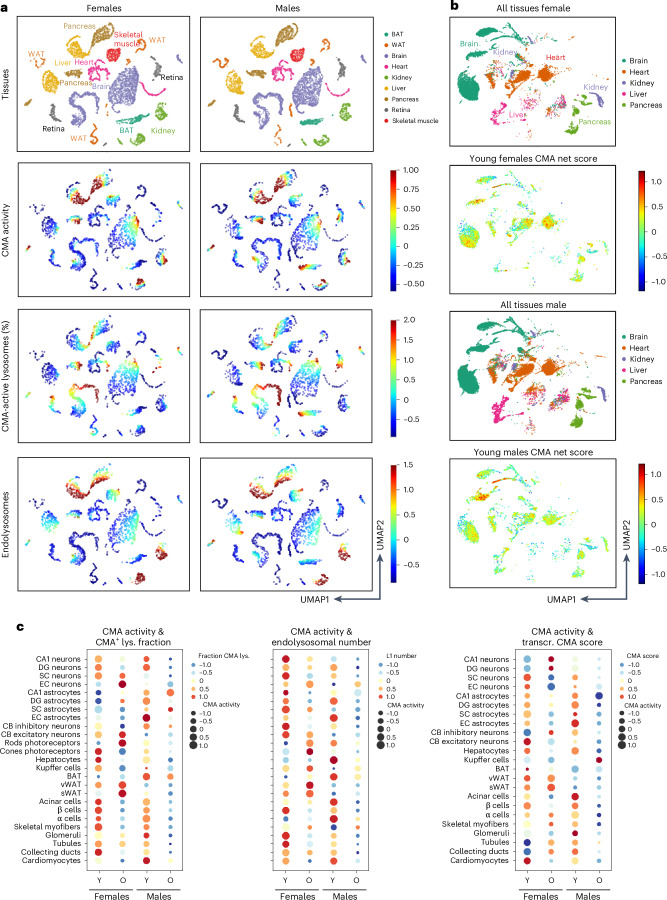
Aging leads to progressive decline in organ and tissue integrity and function, partly due to loss of proteostasis and autophagy malfunctioning. A decrease with age in chaperone-mediated autophagy (CMA), a selective type of lysosomal degradation, has been reported in various organs and cells from rodents and humans. Disruption of CMA recapitulates features of aging, whereas activating CMA in mice protects against age-related diseases such as Alzheimer's, retinal degeneration and/or atherosclerosis. However, sex-specific and cell-type-specific differences in CMA with aging remain unexplored. Here, using CMA reporter mice and single-cell transcriptomic data, we report that most organs and cell types show CMA decline with age, with males exhibiting a greater decline with aging. Reduced CMA is often associated with fewer lysosomes competent for CMA. Transcriptional downregulation of CMA genes may further contribute to CMA decline, especially in males. These findings suggest that CMA differences may influence organ vulnerability to age-related degeneration.


Conflict of interest statement

Competing interests: A.M.C. is a co-founder and scientific advisor for the autophagy program at Life Biosciences. The other authors declare no competing interests relating to this work.

Figures

Fig. 1
Fig. 1. Sex-specific and brain-region-specific changes in neuronal CMA activity with age.
ap, CMA activity and endolysosomal changes in CA1 pyramidal neurons (ad), DG granule neurons (eh), NeuN+ neurons in primary somatosensory cortex (S1, il) and NeuN+ neurons in entorhinal cortex (EC, mp) in young (4–6 m) and old (24–28 m) female and male KFERQDendra mice. Confocal images show neurons stained for KDendra and LAMP1 in the indicated regions of hippocampus (a,e) and cortex (i,m). Scale bars, 5 μm. Quantification in neurons of the number of KDendra+LAMP1+ puncta per cell (b,f,j,n), the percentage of total LAMP1+ puncta also positive for KDendra (c,g,k,o) and the number of LAMP1+ puncta per cell in neurons (d,h,l,p). Mean ± s.e.m and individual values are shown. q, Quantification of changes in KDendra+LAMP1+ puncta in neurons in the indicated brain regions of old animals of ap figures relative to sex-matched young mice. Values are mean ± s.e.m. r,s, CMA score from hippocampus (r) and cortex neurons (s) in young (3 m) and old (18–24 m) female and male mice, calculated from Tabula Muris Senis single-cell RNA-seq data. Boxes: median and 25th and 75th percentiles. Whisker ends: 25th and 75th percentiles ± 1.5 times the IQR. t, Colorimetric quantitative graphical representation of average CMA activity (KDendra+LAMP1+ puncta/cell) in neurons of hippocampus and cortex in young and old, female and male mice. Number of mice (cells) for YF, OF, YM and OM, respectively: bd, fh, np, q: 5 (100), 8 (160), 5 (100), 8 (160); jl, q: 5 (50), 8 (80), 5 (50), 8 (80); r: 3 (4), 2 (8), 4(12), 5 (71), s: 2 (4), 2 (29), 3 (38), 5 (107). P values were calculated using two-way ANOVA with Bonferroni’s multiple comparison test. Only significant comparisons are shown. Lower magnification full-field images for a, e, i and m are shown in Supplementary Fig. 1a–d, and per-animal values are shown in Supplementary Fig. 2a–d. Number of cells counted per tissue and per animal are in Source Data Fig. 1. m, months; OF, old female; OM, old male; YF, young female; YM, young male. Source data
Fig. 2
Fig. 2. Sex-specific and brain-region-specific changes in astrocytic CMA activity with age.
ap, CMA activity and endolysosomal changes in astrocytes in CA1 (ad), DG (eh), primary somatosensory cortex (S1, il) and entorhinal cortex (EC, mp) in young (4–6 m) and old (24–8 m) female and male KFERQDendra mice. Confocal images show astrocytes stained for KDendra and LAMP1 in the indicated regions of hippocampus (a,e) and cortex (i,m). Scale bars, 5 μm. Quantification in astrocytes of the number of KDendra+LAMP1+ puncta per cell (b,f,j,n), the percentage of total LAMP1+ puncta also positive for KDendra (c,g,k,o) and the number of LAMP1+ puncta per cell (d,h,l,p). Mean ± s.e.m. and individual cell values and are shown. q, Quantification of changes in KDendra+LAMP1+ puncta in astrocytes in the indicated brain regions of old animals of ap figures relative to sex-matched young mice. Values are mean ± s.e.m. r,s, CMA score from hippocampus and cortex astrocytes in young (3 m) and old (18–24 m) female and male mice, calculated from Tabula Muris Senis single-cell RNA-seq data. Boxes: median and 25th and 75th percentiles. Whisker ends: 25th and 75th percentiles ± 1.5 times the IQR. t, Colorimetric quantitative graphical representation of average CMA activity (KDendra+LAMP1+ puncta/cell) in astrocytes of hippocampus and cortex in young and old, female and male mice. Number of mice (cells) for YF, OF, YM and OM, respectively: bd,q: 5 (143), 6 (117), 5 (131), 5 (145); fh,q: 5 (114), 6 (130), 5 (90), 5 (120) cells; jl,q: 4 (56), 4 (58), 4 (56), 4 (58); np,q: 4 (79), 4 (84), 5 (109), 5 (117); r: 3 (10), 1 (4), 4 (85), 3 (5); s: 1 (52), 2 (64), 3 (221), 3 (38). P values were calculated using two-way ANOVA with Bonferroni’s multiple comparison test. Only significant comparisons are shown. Lower magnification full-field images for a, e, i and m are shown in Supplementary Fig. 1e–h, and per-animal values are shown in Supplementary Fig. 2e–h. Number of cells counted per tissue and per animal are in Source Data Fig. 2. m, months; OF, old female; OM, old male; YF, young female; YM, young male. Source data
Fig. 3
Fig. 3. Sex-specific and cell-type-specific changes in CMA activity with age in specialized neurons in cerebellum and retina.
ah and mt, CMA activity and endolysosomal changes in cerebellum inhibitory Purkinje neurons (ad) and excitatory granule neurons (eh) and in retina photoreceptors, rods (mp) and cones (qt), from young (4–6 m) and old (24–28 m) female and male KFERQDendra mice. Confocal images show Purkinje (a) and granule (e) neurons and photoreceptors rods (m) and cones (q) stained for KDendra and LAMP1. Scale bars, 5 μm. Number of KDendra+LAMP1+ puncta per cell (b,f,n,r), percentage of LAMP1+ puncta also positive for KDendra (c,g,o,s) and number of LAMP1+ puncta per cell (d,h,p,t). Individual cell values and mean ± s.e.m. are shown. i, Quantification of changes in KDendra+LAMP1+ puncta in cerebellum Purkinje and granule neurons from old mice relative to sex-matched young mice. Values are mean ± s.e.m. j,k, CMA score in inhibitory (Purkinje, j) and excitatory (granule, k) neurons from cerebellum of young (3 m) and old (18–24 m) female and male mice, calculated from Tabula Muris Senis single-cell RNA-seq data. Boxes: median and 25th and 75th percentiles. Whisker ends: 25th and 75th percentiles ± 1.5 times the IQR. l, Colorimetric quantitative graphical representation of average CMA activity (KDendra+LAMP1+ puncta/cell) in cerebellum inhibitory and excitatory neurons in young and old, female and male mice. Number of mice (cells) for YF, OF, YM and OM, respectively: bd,i: 5 (25), 8 (45), 5 (25), 8 (40); fi: 5 (100), 8 (160), 5 (100), 8 (160); j: 3 (29), 1 (18), 3 (54), 3 (76); k: 3 (11), 2 (34), 4 (81), 4 (54); np: 5 (100), 4 (80), 5 (100), 4 (80); rt: 5 (100), 5 (90), 5 (100), 5 (110). P values were calculated using two-way ANOVA with Bonferroni’s multiple comparison test. Only significant comparisons are shown. Lower magnification full-field images for a and e are shown in Supplementary Fig. 1i,j and for m and q in Supplementary Fig. 1k,l. Per-animal values are shown in Supplementary Fig. 2i,j for cerebellum cells and in Supplementary Fig. 2k,l for retinal cells. Number of cells counted per tissue and per animal are in Source Data Fig. 3. m, months; OF, old female; OM, old male; YF, young female; YM, young male. Source data
Fig. 4
Fig. 4. Sex-specific and cell-type-specific changes in CMA activity in aging liver and adipose tissues.
ay, CMA activity and endolysosomal changes in liver (aj), brown adipose tissue (BAT, ko) and visceral (v) and subcutaneous (s) white adipose tissue (WAT, py) in young (4–6 m) and old (24–28 m) female and male KFERQDendra mice. Representative confocal images show hepatocytes (a), Kupffer cells (f) and adipocytes (k,p,u) stained for KDendra and LAMP1. Hoechst is also shown to delineate adipocytes (k,p,u). Scale bars, 10 μm. Quantification of KDendra+LAMP1+ puncta per cell (b,g,l,q,v), percentage of total LAMP1+ puncta also positive for KDendra (c,h,m,r,w) and number of LAMP1+ puncta per cell (d,i,n,s,x). Means ± s.e.m. and individual values are shown. CMA score in hepatocytes (e), Kupffer cells (j) from young (3 m) and old (18–24 m) male and female mice, calculated from single-cell RNA-seq data from the Tabula Muris Senis dataset and in BAT (o), vWAT (t) and sWAT (y) from young (4–6 m) and old (24–28 m) male and female mice, calculated from RT–PCR analysis. Boxes: median and 25th and 75th percentiles. Whisker ends: 25th and 75th percentiles ± 1.5 times the IQR. Number of mice (cells (for liver and BAT) or fields (for vWAT and sWAT)) for YF, OF, YM and OM, respectively: bd: 5 (200), 6 (240), 4 (160), 6 (250); e: 2 (536), 2 (517), 3 (1,768), 4 (108); gi: 5 (200), 6 (240), 4 (170), 6 (240); j: 2 (13), 2 (246), 2 (614), 4 (1,673); ln: 5 (135), 4 (140), 5 (148), 5 (142); o: 5, 4, 4, 4; qs: 5 (121), 5 (92), 5 (126), 4 (108); t: 5, 9, 7, 9; vx: 4 (90), 4 (90), 4 (96), 5 (120); y: 5, 7, 7 8. P values were calculated using two-way ANOVA with Bonferroni’s multiple comparison test. Only significant comparisons are shown. Per-animal values are shown in Supplementary Fig. 3a–e. Number of cells counted per tissue and per animal are in Source Data Fig. 4. m, months; OF, old female; OM, old male; YF, young female; YM, young male. Source data
Fig. 5
Fig. 5. Sex-specific and cell-type-specific changes in CMA activity with age in pancreas and skeletal muscle.
am, CMA activity and endolysosomal changes in acinar cells in pancreas tissue sections (ad), β cells (eh) and α cells (il) in isolated islets of Langerhans and in myofibers of gastrocnemius skeletal muscles (or) from young (4–6 m) and old (24–28 m) female and male KFERQDendra mice. Confocal images (a,e,i,q) show the indicated cells stained for KDendra and LAMP1. Scale bars, 10 μm (a,q) and 5 μm (e,i). Number of KDendra+LAMP1+ puncta per cell (b,f,j) or normalized cell area (o), percentage of LAMP1+ puncta positive for KDendra (c,g,k,p) and number of LAMP1+ puncta per cell (d,h,l) or normalized cell area (r). m, Quantification of changes in KDendra+LAMP1+ puncta in the indicated pancreatic cells from old male and female mice relative to that in sex-matched young mice. Values are mean ± s.e.m. n,s, CMA score in pancreatic cells (n) from young (3 m) and old (18–24 m) male and female mice, calculated from single-cell RNA-seq data from the Tabula Muris Senis dataset or in skeletal muscle from young (4–6 m) and old (24–28 m) male and female mice (s) calculated by RT–PCR analysis. Boxes: median and 25th and 75th percentiles. Whisker ends: 25th and 75th percentiles ± 1.5 times the IQR. Number of mice (cells (for pancreas) or fields (for skeletal muscle)) for YF, OF, YM and OM, respectively: bd,m: 6 (90), 6 (90), 9 (120), 7 (105); fh,m: 2 (187), 2 (235), 2 (202), 3 (203); jl,m: 3 (22), 3 (45), 3 (34), 3 (43); n: 2 (100), 1 (118), 2 (91), 3 (267) (acinar cells), 2 (281), 1 (142), 2 (241), 3 (678) (β cells), 2 (181), 1 (41), 2 (183), 3 (116) (α cells); or: 7 (140), 7 (140), 7 (140), 7 (140); s: 7, 6, 7, 6. P values were calculated using two-way ANOVA with Bonferroni’s multiple comparison test. Only significant comparisons are marked. Lower magnification full-field images for a, e, i and q are shown in Supplementary Fig. 1m–p, and per-animal values are shown in Supplementary Fig. 3f–h for pancreatic cells and in Supplementary Fig. 4a for skeletal muscle fibers. Number of cells counted per tissue and per animal are in Source Data Fig. 5. m, months; OF, old female; OM, old male; YF, young female; YM, young male. Source data
Fig. 6
Fig. 6. Sex-specific and cell-type-specific changes in CMA activity with age in kidney and heart.
al and or, CMA activity and endolysosomal changes in glomeruli (ad), tubules (eh) and collecting ducts (il) in kidney and cardiomyocytes in heart (or) from young (4–6 m) and old (24–28 m) female and male KFERQDendra mice. Representative confocal images show kidney glomeruli (a), tubules (e), collecting ducts (i) and cardiomyocytes (o) stained for KDendra and LAMP1. Scale bars, 5 μm (a,e,i) and 10 μm (o). Quantification of KDendra+LAMP1+ puncta per cell (b,f,j) or per cell area (p), percentage of LAMP1+ puncta positive for KDendra (c,g,k,q) and number of LAMP1+ puncta per cell (d,h,l) or per cell area (r). Individual values and means ± s.e.m. are shown. m, Quantification of changes in KDendra+LAMP1+ puncta in the indicated kidney cells from old male and female mice relative to that in sex-matched young mice. Values are mean ± s.e.m. n,s, CMA score in kidney cells (n) and cardiomyocytes (s) from young (3 m) and old (18–24 m) male and female mice, calculated from single-cell RNA-seq data from the Tabula Muris Senis dataset. Boxes: median and 25th and 75th percentiles. Whisker ends: 25th and 75th percentiles ± 1.5 times the IQR. Number of mice (glomeruli (bd), cells (fh, jl) or fields (pr)) for YF, OF, YM and OM, respectively: bd,m: 5 (25), 5 (25), 4 (20), 5 (20); fh,m: 5 (125), 5 (125), 4 (100), 5 (125); jl,m: 5 (100), 5 (100), 4 (80), 5 (100); n: 2 (14), 1 (35), 4 (18), 6 (26) (glomerulus), 2 (3), 2 (85), 4 (43), 6 (262) (proximal tubules), 2 (69), 2 (243), 4 (110), 6 (180) (collecting ducts); pr: 5 (226), 6 (261), 4 (182), 6 (243); s: 4 (113), 2 (65), 5 (92), 5 (280). P values were calculated using two-way ANOVA with Bonferroni’s multiple comparison test. Only significant comparisons are marked. Lower magnification full-field images for a, e, i and o are shown in Supplementary Fig. 1q–t, and per-animal values are shown in Supplementary Fig. 4b–d for kidney cells and in Supplementary Fig. 4e for cardiomyocytes. Number of cells counted per tissue and per animal are in Source Data Fig. 6. m, months; OF, old female; OM, old male; YF, young female; YM, young male. Source data
Fig. 7
Fig. 7. Tissue-wide comparison of sex-specific and cell-type-specific changes in CMA activity with aging.
a, UMAPs generated using each cell quantified in Figs. 1–6 after correcting for differences in cell area (all values calculated as puncta per mm2 of cell area). The two-dimensional distribution in young female and young male KFERQDendra mice was determined based on its identity, KDendra+LAMP1+ puncta (CMA activity), KDendra+LAMP1+/LAMP1+ (% of CMA-active lysosomes) and LAMP1+ puncta (endolysosomal number) separately in females (left) and males (right). Distribution of organ type is shown in the top panels. b, UMAP distribution and comparison of transcriptional CMA score across the organs, calculated from single-cell RNA-seq data from the Tabula Muris Senis dataset. Distribution of tissues (top panel) and their respective CMA scores (bottom panel) in all the cells obtained from young female and young male mice. c, Bubble plots to illustrate changes in CMA activity z-score (KDendra+LAMP1+ puncta, balloon size) compared to fraction of CMA-active lysosome z-score (KDendra+LAMP1+ puncta as a percentage of LAMP1+ puncta, left panel, balloon color), endolysosome number z-score (LAMP1+ puncta, middle panel, balloon color) and CMA transcriptional z-score (CMA score, right panel, balloon color) in all the indicated cell types and tissues from young (Y) and old (O) male and female mice. KDendra+LAMP1+ puncta, KDendra+LAMP1+/LAMP1+ (%), LAMP1+ puncta and transcriptional CMA scores were calculated as z-score in young females and young males for each cell type separately. CB, cerebellum; EC, entorhinal cortex; SC, somatosensory cortex; lys., lysosome; transcr., transcriptional.
Extended Data Fig. 1
Extended Data Fig. 1. Region-specific changes with age in neuronal and astrocytic CMA.
a, Confocal images of the indicated brain regions from young (4-6 m) and old (24-28 m) female and male KFERQDendra mice stained for the neuronal marker NeuN+ (top) or the astrocyte markers GFAP+S100β+ (bottom). Scale bars, 25μm (top), 20μm (bottom). Boxed areas indicate the regions displayed at higher magnification in main Fig. 1 (a,e,i,m) and 2 (a,e,i,m). b,c, Confocal images of prefrontal cortex (PFC) regions stained for KDendra and the excitatory neuron marker CAMKIIα (b) or the inhibitory neuronal markers Calbindin (c). Insets: Higher magnification of neurons in the boxed areas. Scale bars, 5μm (left), 25μm (right). d, Quantification of changes in LAMP1+ puncta in neurons (left) and astrocytes (right) from the indicated brain regions of old male and female mice relative to those in sex-matched young mice. Values are mean ± s.e.m. Number mice(cells) for YF, OF, YM and OM, respectively are indicated in legends of main Figs. 1 and 2 and summarized in Source data Extended Data Fig. 1. e, Normalized expression (z scoring within each cell type and brain region) of the CMA network components (organized in functional groups) in excitatory neurons and astrocytes in hippocampal and cortical region from young (3 m) and old (18-24 m) male and female mice, calculated from single cell RNAseq data from the Tabula Muris Senis dataset. f, Correlation analysis of CMA activity (KDendra+LAMP1+ z-score) against endolysosome abundance (LAMP1+ puncta z-score) or percentage of CMA competent lysosomes (KDendra+LAMP1+ [% of LAMP1+] z-score) in neurons (left) and astrocytes (right) in brains of the young and old, females and males mice used in Figs. 1 and 2. P values were calculated using two-way ANOVA with Bonferroni’s multiple comparison test (d) or simple linear regression (e). All values were compared, but only significant comparisons are marked. A linear regression line is plotted on graphs with significant correlations with either an R2 value between 0.1-0.5 (when P-value < 0.05) or an R2 value > 0.5. Source data
Extended Data Fig. 2
Extended Data Fig. 2. Sex and cell type-specific changes in brain and retina with age.
a, Confocal images of cerebellum from young (4-6 m) and old (24-28 m) female and male KFERQDendra mice stained with Calbindin+ (left) or NeuN+ (right) to highlight Purkinje and Granule neurons, respectively. Boxed areas are displayed at higher magnification in main Fig. 3a,e. Scale bars, 50μm (left), 25μm (right). b, Changes in LAMP1+ puncta in Purkinje and Granule neurons of old mice relative to sex-matched young mice. c, Normalized expression (z scoring) of the CMA network components in excitatory and inhibitory cerebellar neurons from young (3 m) and old (18-24 m) male and female mice, calculated from single cell RNAseq data from the Tabula Muris Senis dataset. d, Confocal images of retina from same mice as in a stained with Recoverin (left) or Arrestin (right) to highlight rods and cones in retina. Scale bars, 10μm. e, f, Number of KDendra+ and LAMP1+ puncta (e) and LAMP1+ puncta (f) in retinal cells from old mice relative to sex-matched young mice. g, CMA activity (KDendra+LAMP1+ puncta, top), percentage of CMA-active LAMP1+ lysosomes (middle), and endolysosome content (LAMP1+puncta, bottom) across the neuronal subtypes analyzed in young and old, female (F) and male (M) mice. h, Bubble plots of changes in CMA activity z-score (KDendra+LAMP1+ puncta, balloon size) compared with endolysosome number (top), fraction of CMA-active lysosomes (middle), and CMA transcriptional z-score (bottom) in the indicated neuronal types and astrocytes from brain regions from young (Y) and old (O) male and female mice. Data presented as mean ± s.e.m. Number mice(cells) for YF, OF, YM and OM, respectively are indicated in legends of main Fig. 3 (for b, e and f) and 1 and 3 (for g) and summarized in Source data Extended Data Fig. 2. P values were calculated using two-way ANOVA with Bonferroni’s multiple comparison test. All values were compared, but only significant comparisons are marked. Source data
Extended Data Fig. 3
Extended Data Fig. 3. Changes with age in the CMA transcriptional network in peripheral tissues.
a, Confocal images of livers from male young (4-6 m) and old (24-28 m) KFERQDendra mice stained for KDendra and CD68 to highlight Kupffer cells. Middle and right panels: higher magnification of boxed region in left. Scale bars, 50μm (left), 10μm (right). b,c, and e,f. Quantification of changes in KDendra+LAMP1+ puncta (b,e) and in LAMP1+ puncta levels (c,f) in liver cells (b,c) and adipose tissues (e,f) of old male and female mice relative to those in sex-matched young mice. d,g. Normalized expression (z scoring within each cell type and tissue) of the CMA network components (organized in functional groups) in liver (d) and adipose tissues (g) from young (3 m) and old (18-24 m) male and female mice, calculated from single cell RNAseq data from the Tabula Muris Senis dataset. Values are mean ± s.e.m. and individual values. Number mice(cells) for YF, OF, YM and OM, respectively are indicated in legends of main Fig. 4 (for b, c) and 5 (for e and f) and summarized in Source data Extended Data Fig. 3. P values were calculated using two-way ANOVA with Bonferroni’s multiple comparison test. All values were compared, but only significant comparisons are marked. Source data
Extended Data Fig. 4
Extended Data Fig. 4. Decline of CMA in aging pancreas and skeletal muscles.
a, Confocal images of pancreas (left) and isolated Islets of Langerhans (middle and right) from young (4-6 m) and old (24-28 m) female and male KFERQDendra mice stained with KDendra and LAMP1 (exocrine pancreas, left), insulin (β-cells, middle) and glucagon (α-cells, right). Boxed areas are displayed at higher magnification in main Fig. 5a,e,i. Scale bars, 30μm (left) and 20μm (middle and right). b,d. Number of LAMP1+ puncta in pancreas and of KDendra+LAMP1+ puncta (top) and LAMP1+ (bottom) in skeletal muscle fibers from of old mice relative to those in sex-matched young mice. c,e, Normalized expression (z scoring) of the CMA network components in pancreas (c) and skeletal muscle (e) from young (3 m) and old (18-24 m) male and female mice, calculated from single cell RNAseq data from the Tabula Muris Senis dataset. f, CMA activity (KDendra+LAMP1+ puncta, top), percentage of CMA-active LAMP1+ lysosomes (middle), and endolysosomes (LAMP1+puncta, bottom) compared across all the analyzed cells in liver, adipose tissues, pancreas and skeletal muscles in young and old, female (F) and male (M) mice. Values are mean ± s.e.m. and n values those indicated in main Figs. 4 and 5. g, Bubble plots to illustrate changes in CMA activity z-score (KDendra+LAMP1+ puncta, ballon size) compared with number of endolysosomes z-score (top), fraction of CMA-active lysosomes z-score, (middle), and CMA transcriptional z-score (bottom) in liver, adipose tissue, pancreas and skeletal muscle cells from young (Y) and old (O) female and male mice. Data presented as mean ± s.e.m. and individual data (for b and d). Number mice(cells) for YF, OF, YM and OM, respectively are indicated in legends of main Fig. 5 (for b, c) and 4 and 5 (for f) and summarized in Source data Extended Data Fig. 4. P values were calculated using two-way ANOVA with Bonferroni’s multiple comparison test (b) or two-tailed unpaired Student’s t test (d) or two-way ANOVA with Fishers LSD test (f). All values were compared, but only significant comparisons are marked. Source data
Extended Data Fig. 5
Extended Data Fig. 5. Cell-specific changes with age in kidney and heart CMA.
a, d, Confocal images of kidney (a) and heart (d) from female and male young (4-6 m) and old (24-28 m) KFERQDendra mice stained for Aquaporin-2+ (a) to stain collecting ducts and actin (d) for cardiomyocytes. Scale bar, 20μm (a). Scale bar, 10μm (d). Boxed areas indicate the regions displayed at higher magnification in main Fig. 6i. b, e, Quantification of changes in LAMP1+ puncta in kidney cells (b) and of changes in KDendra+LAMP1+ puncta (top) and LAMP1+ (bottom) in cardiomyocytes (e) from of old male and female mice relative to those in sex-matched young mice. c, f, Normalized expression (z scoring within each cell type) of the CMA network components (organized in functional groups) in kidney (c) and cardiomyocytes (f) from young (3 m) and old (18-24 m) male and female mice, calculated from single cell RNAseq data from the Tabula Muris Senis dataset. Data presented as mean ± s.e.m. Values are mean ± s.e.m. and individual values. Number mice(cells) for YF, OF, YM and OM, respectively are indicated in legends of main Fig. 6 and summarized in Source data Extended Data Fig. 5. P values were calculated using two-way ANOVA with Bonferroni’s multiple comparison test (b) or two-tailed unpaired Student’s t test (e). All values were compared, but only significant comparisons are marked. Source data
Extended Data Fig. 6
Extended Data Fig. 6. Tissue-wide comparison of changes with age and sex in CMA and endolysosomes and in autophagy-related transcriptional programs.
a-c, Heatmaps showing z-scores of KDendra+LAMP1+ puncta (CMA activity) (a), proportion of CMA-active lysosomes (KDendra+LAMP1+/LAMP1+) (b) and LAMP1+ puncta (endolysosomal number) (c), corrected for differences in cell area (all values calculated as puncta per mm2 of cell area) z-scores in the indicated tissues and cell types from young (Y) and old (O) KFERQDendra mice. d-f, Transcriptional scores for CMA (d), endolysosomes (e) and macroautophagy (f) calculated from the individual expression of each pathway related genes in the indicated tissues and cell types from young and old female and male mice. g-I, Heatmaps showing normalized expression (z scoring within each cell type) of the MiTF family of transcription factors including Tfeb (g), Tfe3 (h) and Tfec (i) in the indicated tissues and cell types from young and old female and male mice. Data in d-i was extracted from single cell RNAseq data from the Tabula Muris Senis dataset. Cell types with no data for Tfec in the dataset are represented with a cross. Source data
Extended Data Fig. 7
Extended Data Fig. 7. Sex and cell-type-specific changes in expression of lysosomal genes with aging.
a-e, Heatmaps showing normalized expression (z scoring within each gene) of the lysosomal components (organized in groups of lysosomal hydrolases, lysosomal membrane proteins, acidification components and biogenesis proteins) in cells of brain (a), liver (b), pancreas (c), kidney (d) and heart (e) from young (3 m) and old (18-24 m) female and male mice, calculated from single cell RNAseq data from the Tabula Muris Senis dataset. f, Correlation analysis of CMA activity (KDendra+LAMP1+ z-score) against lysosomal gene score (averaged z-score of all lysosomal genes) in neurons (left) and astrocytes (right) of hippocampus (top) and cortex (bottom) brain regions from young and old, female and male mice used in Figs. 1 and 2. P values were calculated using simple linear regression. A linear regression line is plotted on graphs with significant correlations with either an R2 value between 0.1-0.5 (when P-value < 0.05) or an R2 value > 0.5. Cell types with no data for a certain gene in the dataset are represented with a cross. Source data
Extended Data Fig. 8
Extended Data Fig. 8. Sex and cell-type-specific changes in expression of macroautophagy genes with aging.
a-e, Heatmaps showing normalized expression (z scoring within each gene) of the macroautophagy network components (organized in functional groups of effectors, adaptors, inhibitors and activators) in cells of brain (a), liver (b), pancreas (c), kidney (d) and heart (e) from young (3 m) and old (18-24 m) female and male mice, calculated from single cell RNAseq data from the Tabula Muris Senis dataset. Cell types with no data for a certain gene in the dataset are represented with a cross. Source data
Extended Data Fig. 9
Extended Data Fig. 9. Cell-type-specific association of CMA activity with Xist expression in females with aging.
a-g, Xist expression (left panels) in young (3 m) vs old (18-24 m) female mice (when available in TMS dataset) and correlation analysis (right panels) of CMA transcriptional score against Xist expression in old female in the indicated cells in brain (a-c), liver (d), pancreas (e), heart (f) and kidney (g), calculated from single cell RNAseq data from the Tabula Muris Senis dataset. h, Correlation analysis of CMA activity (KDendra+LAMP1+ z-score) against Xist expression in all the analyzed cell types of the brain in old females. Data presented as mean ± s.e.m. Number cells for YF, OF respectively: a: 1,4 (hippocampus), 3, 10 (cortex); b: 4, 4 (hippocampus) 11, 33 (cortex); c: 2, 8 (Inhibitory), 8, 24 (Excitatory); d: 401, 371 (Hepatocytes); 11, 213 (Kupffer cells); e: 73, 94 (acinar cells), 265, 140 (β-cells), 39, 39 (α-cells); f: 51, 10; g: 1, 5 (glomerulus), 5, 5 (proximal tubules), 1, 37(collecting ducts). *P < 0.05, **P < 0.01, **P < 0.001 and ****P < 0.0001 (bar graphs) or exact P values (scatter plots) were calculated using two-tailed unpaired Student’s t test (left panels) or simple linear regression (right panels). A linear regression line is plotted on graphs with significant correlations with either an R2 value between 0.1-0.5 (when P-value < 0.05) or an R2 value > 0.5. All values were compared, but only significant comparisons are marked. Source data
Extended Data Fig. 10
Extended Data Fig. 10. Tissue-specific association of CMA activity with expression of sex hormone receptors in aging.
a-l, Sex hormone receptors expression (left panels) and correlation analysis of their expression with CMA activity (KDendra+LAMP1+ puncta per cell) in female (middle panels) and male (right panels) liver (a-d), brown adipose tissue (BAT) (e-h) and skeletal myofibers (i-l). Androgen / dihydrotestosterone receptor (Andr, a,e,i), Estrogen receptor alpha (Esr1, b,f,j), Estrogen receptor beta (Esr2, c,g,k) and G-protein coupled estrogen receptor 1 (Gper1, d,h,l) levels were measured with qRT-PCR in whole homogenate of liver, BAT and skeletal muscles in the same young (4-6 m) and old (24-28 m), female and male KFERQDendra mice used for CMA activity analysis (main Figs. 4 and 5). Data is presented as mean ± s.e.m. Number mice for YF, OF, YM and OM, respectively: a-d: 5, 6, 5, 6; e-h: 9, 9, 7, 6; i-l: 5, 5, 5, 5. *P < 0.05, **P < 0.01, **P < 0.001 and ****P < 0.0001 (bar graphs) or exact P values (scatter plots) were calculated using two-way ANOVA with Bonferroni’s multiple comparison test (left panels) or simple linear regression (middle and right panels). A linear regression line is plotted on graphs with significant correlations with either an R2 value between 0.1-0.5 (when P-value < 0.05) or an R2 value > 0.5. All values were compared, but only significant comparisons are marked. Source data

Similar articles

Cited by

  • Liver, ageing and disease.
    Le Couteur DG, Ngu MC, Hunt NJ, Brandon AE, Simpson SJ, Cogger VC. Le Couteur DG, et al. Nat Rev Gastroenterol Hepatol. 2025 Jul 28. doi: 10.1038/s41575-025-01099-z. Online ahead of print. Nat Rev Gastroenterol Hepatol. 2025. PMID: 40721658 Review.

References

    1. Lopez-Otin, C., Blasco, M. A., Partridge, L., Serrano, M. & Kroemer, G. The hallmarks of aging. Cell153, 1194–1217 (2013). - PMC - PubMed
    1. Brandvold, K. R. & Morimoto, R. I. The chemical biology of molecular chaperones—implications for modulation of proteostasis. J. Mol. Biol.427, 2931–2947 (2015). - PMC - PubMed
    1. Nieto-Torres, J. L. & Hansen, M. Macroautophagy and aging: the impact of cellular recycling on health and longevity. Mol. Aspects Med.82, 101020 (2021). - PMC - PubMed
    1. Kaushik, S. et al. Autophagy and the hallmarks of aging. Ageing Res. Rev.72, 101468 (2021). - PMC - PubMed
    1. Yamamoto, H., Zhang, S. & Mizushima, N. Autophagy genes in biology and disease. Nat. Rev. Genet.24, 382–400 (2023). - PMC - PubMed

Grants and funding