. 2025 Feb;638(8052):1095-1103.
doi: 10.1038/s41586-024-08398-6. Epub 2025 Feb 5.

Synthetic lethality of mRNA quality control complexes in cancer

Affiliations

Synthetic lethality of mRNA quality control complexes in cancer

Vivian Prindle et al. Nature. 2025 Feb.

Abstract

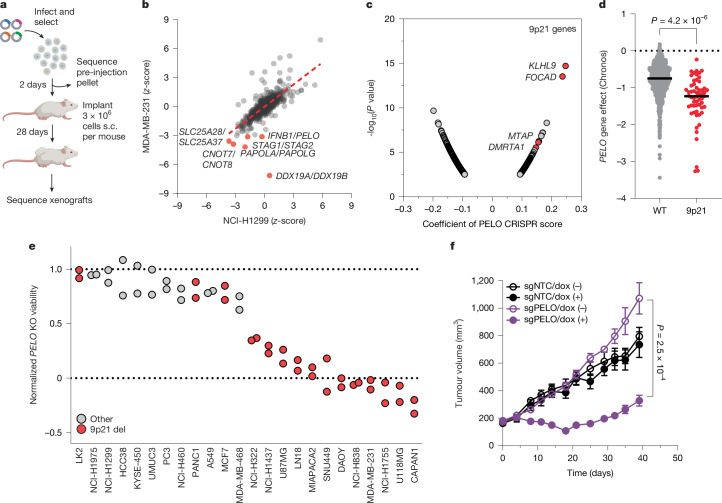
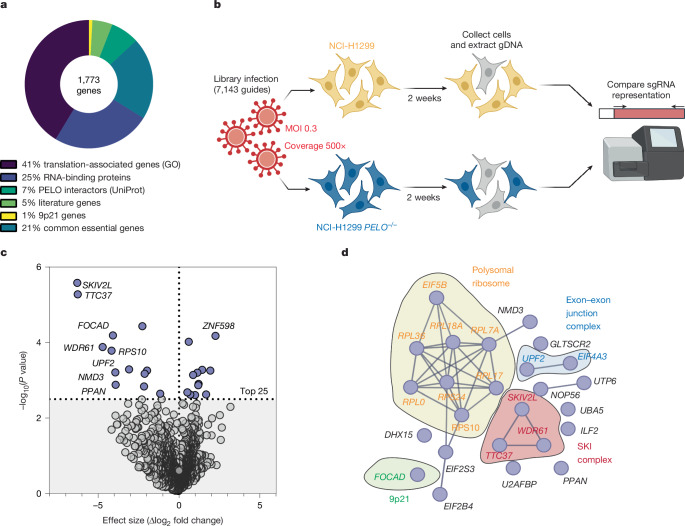
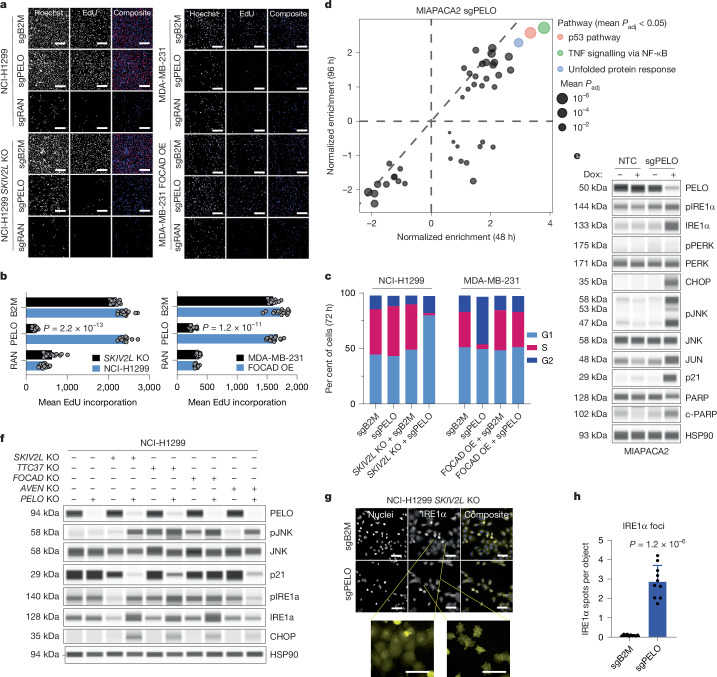
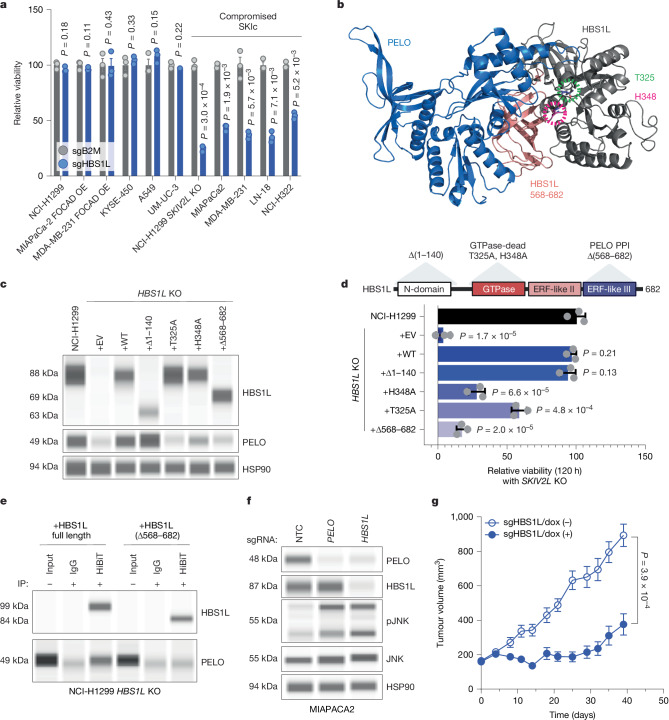
Synthetic lethality exploits the genetic vulnerabilities of cancer cells to enable a targeted, precision approach to treat cancer1. Over the past 15 years, synthetic lethal cancer target discovery approaches have led to clinical successes of PARP inhibitors2 and ushered several next-generation therapeutic targets such as WRN3, USP14, PKMYT15, POLQ6 and PRMT57 into the clinic. Here we identify, in human cancer, a novel synthetic lethal interaction between the PELO-HBS1L and SKI complexes of the mRNA quality control pathway. In distinct genetic contexts, including 9p21.3-deleted and high microsatellite instability (MSI-H) tumours, we found that phenotypically destabilized SKI complex leads to dependence on the PELO-HBS1L ribosomal rescue complex. PELO-HBS1L and SKI complex synthetic lethality alters the normal cell cycle and drives the unfolded protein response through the activation of IRE1, as well as robust tumour growth inhibition. Our results indicate that PELO and HBS1L represent novel therapeutic targets whose dependence converges upon SKI complex destabilization, a common phenotypic biomarker in diverse genetic contexts representing a significant population of patients with cancer.


Conflict of interest statement

Competing interests: V.P., A.E.R., K.S., S.K., K.K., D.C., D.W., P.L., S.P., M.T., A.C., S.W., M.B.P., D.M., V.M., X.S., C.L., S.S., Z.D., G.B., D.V., B.B., J.A.M., W.N.P. and J.P.P. are employees of AbbVie.

Figures

Fig. 1
Fig. 1. PELO is a selective dependency in cancers with 9p21.3 loss.
a, Design of in vivo CRISPR screen. s.c, subcutaneous. b, Digenic CRISPR dropout correlation. In vivo CRISPR results for NCI-H1299 and MDA-MB-231 xenografts at 28 days. Normalized z-scores indicate the change in guide abundance between pre-injection pellet and day 28 after implantation. Selected pairs are highlighted in red. c, Pearson correlation of PELO Chronos CRISPR score and gene expression across cell lines in the 23Q4 DepMap release. Top 1,000 correlated genes are shown; genes located on 9p21.3 are highlighted in red. d, PELO dependency in 9p21.3-deleted models (9p21 del) are preferentially sensitive across all cancer cell lines available in the 23Q4 DepMap Public Release. Two-tailed Student’s t-test between mean of wild-type (WT) (n = 1,043, mean = −0.795) and 9p21-deleted (n = 57, mean = −1.326); P = 4.2 × 10−6. e, In vitro PELO dependency. Negative control: B2M sgRNA. Pan-essential controls: ABCE1, RPA3 and RAN sgRNA. Normalized viability at 7 days calculated relative to the negative control and average phenotype of pan-essential genes. Data from n = 2 biological replicates calculated as average of n = 3 technical replicates per cell line. KO, knockout. f, In vivo PELO dependency. Growth of size-matched (200 mm3) xenografted 9p21-deleted MIAPACA2 tumours with doxycycline (dox)-inducible sgRNA targeting PELO (sgPELO) or non-targeting sgRNA (NTC). Doxycycline (625 mg kg−1) chow was administered ad libitum. Data are mean ± s.e.m. of n  =  8 mice. Two-tailed Student’s t-test between groups on day 40; P = 2.5 × 10−4 . Source Data
Fig. 2
Fig. 2. FOCAD deletion dictates 9p21 synthetic lethality.
a, PELO SL-ID library composition. GO, gene ontology. b, Experimental design for PELO SL-ID screen. Library infected at a multiplicity of infection (MOI) of approximately 0.3, with approximately 500× representation per sgRNA. gDNA, genomic DNA. c, Results of the PELO SL-ID screen, with genes of interest labelled. Effect size calculated from n = 3 independent replicates. Two-tailed Student’s t-test followed by Benjamini–Hochberg correction for multiple-hypothesis testing. WDR61 is also known as SKIC8. d, StringDB physical subnetwork analysis of the top 25 most significant hits from PELO SL-ID in c. Enriched complexes and 9p21.3 genes are circled.
Fig. 3
Fig. 3. SKIc is lost in cancer and drives PELO dependency.
a, Pearson correlation between PELO Chronos CRISPR score and whole-proteome data from cell lines (n = 375) available in the 23Q4 DepMap release. Top 1,000 correlated proteins shown, SKIc proteins are labelled in purple. Two-tailed Student’s t-test. b, FOCAD and SKIV2L protein levels across cell lines analysed in the 23Q4 DepMap release. Pearson’s r = 0.553; n = 375. c, Immunoblot of SKIc proteins in FOCAD homozygous deletion (FOCAD KO) and FOCAD-expressing cell lines. d, Correlation of SKIV2L and TTC37 protein expression in tumours. Data from the PanCancer Clinical Proteomic Tumor Analysis Consortium (CPTAC) cohort (n = 1,022). Models with FOCAD homozygous deletion are highlighted in blue. Pearson’s coefficient of determination (R2) = 0.75. e, Relative SKIV2L and TTC37 protein expression in tumours with (KO, n = 36) and without (WT, n = 986) FOCAD homozygous deletion. Two-tailed Student’s t-test between two groups; SKIV2L, P = 4.5 × 10−4; TTC37, P = 1.8 × 10−7. In box plots, the centre line is the median, box edges delineate 25th and 75th percentiles and whiskers extend to 10th and 90th percentiles; data outside whiskers are shown as individual points. f, Immunoblot of SKIc isogenic clonal knockout (cKO) NCI-H1299 cell lines. Asterisk denotes TTC37-specific bands. g, Validation of PELO and SKIc synthetic lethality. Relative viability of parental or PELO cKO NCI-H1299 cells following acute knockout of indicated SKIc gene or B2M negative control. FOCAD, P = 1.1 × 10−4; SKIV2L, P = 2.5 × 10−5; TTC37, P = 3.6 × 10−5; AVEN, P = 4.0 × 10−5. h, Reconstitution of SKIc. Immunoblot in MIAPACA2 cells with exogenous expression of indicated SKIc proteins. i, Functional rescue of PELO dependency by overexpression (OE) of indicated proteins. Relative viability was assessed on day seven and normalized to B2M sgRNA control. j, FOCAD-driven SKIc stability. Time course of SKIV2L, TTC37, FOCAD and AVEN protein expression following treatment with 500 nM dTAG-v1 (inducible degron tag). Data are mean ± s.e.m. Two-tailed Student’s t-test. Representative data shown as n = 3 independent biological replicates (g,i) or representative data shown from one of two independent replicates (c,f,j). Source Data
Fig. 4
Fig. 4. PELO and SKIc synthetic lethality induces cell cycle arrest and UPR.
a, Representative high-content images of Hoechst and Edu staining in isogenic SKIc models 72 h after transfection of sgRNA targeting B2M (sgB2M), PELO (sgPELO) or RAN (sgRAN). Scale bars, 200 µm. b, Mean average Edu incorporation in NCI-H1299 with or without SKIV2L expression (left) and MDA-MB-231 with or without FOCAD overexpression (right) 72 h after transfection with sgB2M, sgPELO or sgRAN. Data are mean ± s.e.m. of n = 2 independent biological replicates, n = 7 images per replicate. Two-tailed Student’s t-test for sgPELO with SKIc (NCI-H1299 or FOCAD OE) versus without SKIc (SKIV2L KO or MDA-MB-231): NCI-H1299, P = 2.2 × 10−13; MDA-MB-231, P = 1.2 × 10−11. c, Cell cycle analysis 72 h after infection with sgB2M or sgPELO. G1, S and G2 phases gated by Edu and PI intensity. d, Differentially regulated pathways in MIAPACA2 after doxycycline-induced sgPELO expression. Size of bubble indicates average adjusted P value (Padj); P value estimation based on an adaptive multi-level split Monte Carlo scheme. n = 3 independent replicates per time point. e, Validation of sgPELO RNA sequencing results. Samples were collected 48 h after sgPELO infection and protein extracts were blotted with indicated antibodies. c-PARP, cleaved PARP; pIRE1α, phosphorylated IRE1α. f, UPR pathway regulation in NCI-H1299 SKIc isogenic models transfected with sgB2M or sgPELO. Samples were collected at 48 h. g, High-content imaging of IRE1α foci in the NCI-H1299 SKIV2L-knockout cell line. Images were collected 48 h after sgB2M or sgPELO treatment. Scale bars, 400 µm. h, Quantification of IRE1α foci per object from g, 48 h after sgB2M or sgPELO transfection of SKIV2L-knockout NCI-H1299 model. Five images were acquired from two independent biological replicates. Data are mean ± s.e.m. Two-tailed Student’s t-test, P = 1.2 × 10−6. Representative data shown from one of two independent replicates (e,f). Source Data
Fig. 5
Fig. 5. HBS1L is a synthetic lethal target in cancers with SKIc loss.
a, HBS1L knockout in a panel of cell lines. Relative viability of sgHBS1L or sgB2M cells at day 7. Data are mean ± s.e.m. of n = 3 independent biological replicates. b, Model of the PELO–HBS1L complex, adapted from Protein Data Bank ID 5LZZ. PELO is shown in blue, HBS1L is in grey. Key HBS1L residues (568–682) along the PELO interaction surface are shown in salmon. GTPase catalytic residues T325 and H348 are circled with green and pink dotted lines, respectively. c, Validation of a stable NCI-H1299 sgHBS1L model (HBS1L KO) and HBS1L rescue constructs. d, Functional characterization of HBS1L. Data shown from n = 3 independent biological replicates. EV, empty vector, P = 1.7 × 10−5; wild type, P = 0.21; Δ1–140, P = 0.13; H348A, P = 6.6 × 10−5; T325A, P = 4.8 × 10−4; Δ568–682, P = 2.0 × 10−5. e, Co-immunoprecipitation of full-length HBS1L and HBS1L(Δ568–682) and PELO. Representative image of a single experiment from two independent biological replicates. f, Immunoblot for validation of the inducible sgHBS1L model. Experiment performed once. g, In vivo HBS1L dependency. Growth of size-matched (200 mm3) implanted doxycycline-inducible sgHBS1L MIAPACA2 model. Doxycycline (625 mg kg−1) chow was administered ad libitum. Data show mean ± s.e.m. of n  =  8 mice per group. P value calculated at study end, P = 3.9 × 10−4. Two-tailed Student’s t-test (a,d,g). Source Data
Extended Data Fig. 1
Extended Data Fig. 1. Validation of PELO dependency in vitro and in vivo.
(a) in vitro validation of IFNΒ1/PELO in NCI-H1299 and MDA-MB-231. (b) Confluency MDA-MB-231 cells after transfection with sgB2M or four independent sgRNA’s targeting PELO (e2.2, e3.13, e3.25, e3.55). (c) Image on day 7 of Incucyte experiment shown in (b); cells outlined in yellow to show confluence. (d) PELO gene effect density plot across all models available in DepMap Public release 23Q4 (n = 1100) and PELO Chronos scores across all major lineages available in DepMap Public release 23Q4. Red line delineates highly dependent models. (e) sgPELO knockout efficiency in models tested in Fig. 1g. Representative image of one experiment of two independent biological replicates shown. (f) Validation of PELO knockout in the MIAPACA-2 in vivo doxycycline inducible sgPELO or sgNTC study. Four independent tumors harvested at each time-point post dox (D7, D14, D21) for both the no dox and dox conditions. (g) Quantification of PELO protein levels from (f). Mean of n = 4 animals per group, relative to no dox control. Data (a, b) shown as mean ± s.e.m. Data shown as n = 3 independent biological replicates (a, b), representative data shown from one of three independent replicates (c). Source Data
Extended Data Fig. 2
Extended Data Fig. 2. In vitro growth curves after PELO knockout.
(a) Growth of sgB2M (black) and sgPELO (blue) models reported in Fig. 1g. n = 2 independent biological experiments, shown as mean ± s.e.m. (b) Effect of sgPELO on normal immortalized cell models, HEMa, P = 0.18; HFF-1, P = 0.09; ARPE-19, P = 0.39; MCF10A, P = 0.85. Negative control: B2M sgRNA. Pan essential control: RAN sgRNA. Data shown as mean ± s.e.m, n = 3 biologically independent replicates. (c) Stable NCI-H1299 sgPELO model generation verified by immunoblot and growth rate of NCI-H1299 wildtype as compared to sgPELO. Data shown as mean ± s.e.m, n = 2 biologically independent experiments. Source Data
Extended Data Fig. 3
Extended Data Fig. 3. Protein and mRNA correlations of SKIc members.
(a) DepMap correlations of genomic and dependency features (protein, copy number, RNA expression) between SKIc members and PELO dependency. Pearson r calculated for each comparison.
Extended Data Fig. 4
Extended Data Fig. 4. Characterization of SKIc loss and relationship with PELO.
(a) Guide level analysis of 9p21 genes. NCI-H1299 parent (orange) and PELO−/− (blue) models shown. Two-tailed Student’s t-test of n = 4 sgRNA per gene, Parent vs. PELO −/−; FOCAD, P = 5.7 × 10⁻³. (b) SL-ID screen results in SKIV2L −/− and FOCAD −/− models. NCI-H1299 parental (orange) SKIV2L −/− or FOCAD −/− (blue). Each dot represents an individual sgRNA (n = 4) for each gene, mean of n = 3 independent biological replicates. (c) Immunoblot of the PELO/HBS1L/ABCE1 rescue complex across isogenic SKIc knockout models. (d) PELO dependency by siRNA in HAP1 or HAP1 SKIV2L −/− models. Data shown as mean ± s.e.m, n = 3 biologically independent replicates, two-tailed Student’s t-test; P = 9.9 × 10⁻⁷. (e) Validation of siRNA efficiency by immunoblot in (d). Data generated from a single experiment. (f) RNA quantification of SKIc levels (FOCAD, TTC37, SKIV2L, AVEN) post FOCAD degradation. Data shown as mean ± s.e.m, n = 3 biologically independent replicates, two-tailed Student’s t-test. (g) sgWDR61 in NCI-H1299 parental, PELO −/−, and SKIV2L −/− models. Confluency of sgB2M (black), sgWDR61 (blue). Data shown as mean ± s.e.m, n = 3 biologically independent replicates (h) Immunoblot validation of sgWDR61 efficiency and effects on SKIc in models from (g). Data is generated from a single independent experiment. Source Data
Extended Data Fig. 5
Extended Data Fig. 5. SKIc perturbations in cancer.
(a) Stacked bar chart of the frequency of homozygous deletions of FOCAD (grey), TTC37 (teal), SKIV2L (fuchsia), AVEN (purple) across TCGA cohorts with prevalence greater >5%. (b) Frequency of FOCAD mutations occurring across TCGA cohorts with prevalence >5%. (c) Generation of a SKIV2L rescue model in the NCI-H1299 SKIV2L KO cell line; validation of SKIV2L and TTC37 expression. Data is a representative image of a single replicate of n = 2 independent biological experiments. (d) PELO knockout in the panel of SKIV2L KO, SKIV2L WT rescue or SKIV2L R483C rescue cells. Data is a representative image of a single replicate of n = 3 independent biological experiments. (e) Relative viability of SKIV2L KO (−), SKIV2L WT rescue or SKVI2L R483C rescue cell lines measured 7 days after sgB2M (black), sgPELO (blue), or sgRAN (red) transfection. Data shown as mean ± s.e.m., n = 3 biologically independent replicates, two-tailed Student’s t-test between sgB2M and sgPELO groups; SKIV2L KO, P = 2.8 × 10⁻⁴; SKIV2L WT, P = 0.32; R483C, P = 9.5 × 10⁻⁷. Source Data
Extended Data Fig. 6
Extended Data Fig. 6. SKIc and PELO synthetic lethality in MSI-H cancers.
(a) PELO is a selective dependency in MSI-H cell lines. A panel of MSS (SW837, HT-29) and MSI-H (HCT-116, RKO, DLD1, MFE-319) cell lines after sgB2M (black) or sgPELO (blue). Data shown as mean ± s.e.m., n = 3 biologically independent replicates. (b) PELO DepMap Chronos dependency in MSI-H models as part of major MSI lineages. Models characterized by NGS MSI status, MSS (grey) or MSI-H (red). Two-tailed Students t-test of MSI to MSS by lineage; Bowel, P = 4.0 × 10⁻¹³; Uterine, P = 2.8 × 10⁻³; Overy, P = 2.0 × 10⁻³; Lymphoid, P = 0.03. (c) SKIc immunoblot in MSI and MSS models. Data is derived from one biological experiment. d) Correlation of SKIV2L and TTC37 relative protein levels from uterine cancer CPTAC proteomic data (n = 116). MSI-H tumors highlighted in red. Pearson’s coefficient of determination, R2 = 0.65. (e) Correlation of SKIV2L and TTC37 relative protein levels from colorectal CPTAC proteomic data (n = 96). MSI-H tumors highlighted in red. Pearson’s coefficient of determination, R2 = 0.52. (f) cBioPortal OncoPrint showing mutual exclusivity of FOCAD homozygous deletions, MSH2, PMS1, PMS2, RPL22 mutations across major lineage MSI-H solid tumors (bowel, uterine, endometrial). (g) PELO and WRN dependency comparison across MSI-H (n = 61) models by NGS grouped by TP53 LOF or WT status. PELO dependency score (blue), WRN (orange). Median denoted by red line. (h) Relative viability of DLD-1 MSI-H cells after sgPELO, sgWRN, and sgABCE1 on day 7. Data shown as mean ± s.e.m., n = 5 biologically independent replicates (i) Immunoblot validation of sgPELO and sgWRN knockout efficiency in experiments in (h), data presented is a single representative image from n = 2 biologically independent replicates. Source Data
Extended Data Fig. 7
Extended Data Fig. 7. Pathway analysis of PELO/SKI synthetic lethality.
(a) Gating strategy for cell cycle analysis by flow cytometry for cell cycle analysis. (b) Cell cycle analysis by flow cytometry. Scatters of PI, propidium iodide (x-axis) vs. Edu (y-axis) and raw plots for quantification in Fig. 5c. (c) Quantification of cell viability and death markers; calcein blue (blue); apoptracker (green); mitotracker (red), in NCI-H1299 and MDA-MB-231 SKIc isogenic models at 72 h post sgPELO transfection. Data shown as mean ± s.e.m., n = 3 biologically independent replicates. (d) Percent Cytotox and Annexin V positive cells 120 h post sgB2M (grey), sgPELO (blue), sgRAN (red). Data shown as mean ± s.e.m., n = 5 biologically independent replicates. (e) Leading edge plots of highlighted gene expression programs from Fig. 5d. (f) Immunoblot of endogenous 9p21 models 48 h after sgB2M or sgPELO transfection for UPR target genes. Data is representative image from n = 2 independent biological replicates. (f) Quantification of percent IRE1α levels 48 h after sgPELO transfection across n = 5 deleted and n = 7 wildtype 9p21.3 cell line models. Data shown as mean ± s.e.m. Source Data
Extended Data Fig. 8
Extended Data Fig. 8. Validation of HBS1L dependency.
(a) Correlation of HBS1L and PELO Chronos scores across DepMap models from 23Q4 release (n = 1078). (b) Correlation of HBS1L dependency to RNA expression data across all lineages and models. The top 1000 correlated genes are shown. Highlighted 9p21.3 genes in red. P-value calculated by two-tailed Student’s t-test. (c) Correlation of HBS1L dependency to proteomic expression data across all lineages and models. The top 1000 correlated proteins are shown. Highlighted SKIc member proteins shown in purple. P-values calculated by F-test. (d) Validation of HBS1L knockout in models assessed in Fig. 5a. (e) Confluency over time of MDA-MB-231 cells after transfection of sgB2M or four independent sgRNA’s targeting HBS1L (e7.1, e7.2, e13.1, e17.1). Data shown as mean ± s.e.m. of n = 2 independent biological replicates. (f) Representative confluency images of MDA-MB-231 cells containing sgB2M control or one of four sgRNA’s targeting HBS1L. Image acquired on day 7. Representative image of a single replicate of n = 3 independent biological experiments. (g) Immunoblot of HBS1L and PELO from in vivo doxycycline sgHBS1L study, n = 4 tumors harvested at each time-point post dox (D7, D14, D21) for both the no dox and dox conditions. (h) Quantification of HBS1L and PELO after in vivo sgHBS1L inducible knockout, normalized to HSP90 loading control. Shown as the mean of n = 4 animals per group. Source Data

References

    1. O’Neil, N. J., Bailey, M. L. & Hieter, P. Synthetic lethality and cancer. Nat. Rev. Genet.18, 613–623 (2017). - PubMed
    1. Robson, M. et al. Olaparib for metastatic breast cancer in patients with a germline BRCA mutation. N. Engl. J. Med.377, 523–533 (2017). - PubMed
    1. Chan, E. M. et al. WRN helicase is a synthetic lethal target in microsatellite unstable cancers. Nature568, 551–556 (2019). - PMC - PubMed
    1. Lim, K. S. et al. USP1 is required for replication fork protection in BRCA1-deficient tumors. Mol. Cell72, 925–941.e4 (2018). - PMC - PubMed
    1. Gallo, D. et al. CCNE1 amplification is synthetic lethal with PKMYT1 kinase inhibition. Nature604, 749–756 (2022). - PMC - PubMed

MeSH terms