. 2025 Mar;639(8056):1024-1031.
doi: 10.1038/s41586-024-08511-9. Epub 2025 Feb 5.

Differential protection against SARS-CoV-2 reinfection pre- and post-Omicron

Affiliations

Differential protection against SARS-CoV-2 reinfection pre- and post-Omicron

Hiam Chemaitelly et al. Nature. 2025 Mar.

Abstract

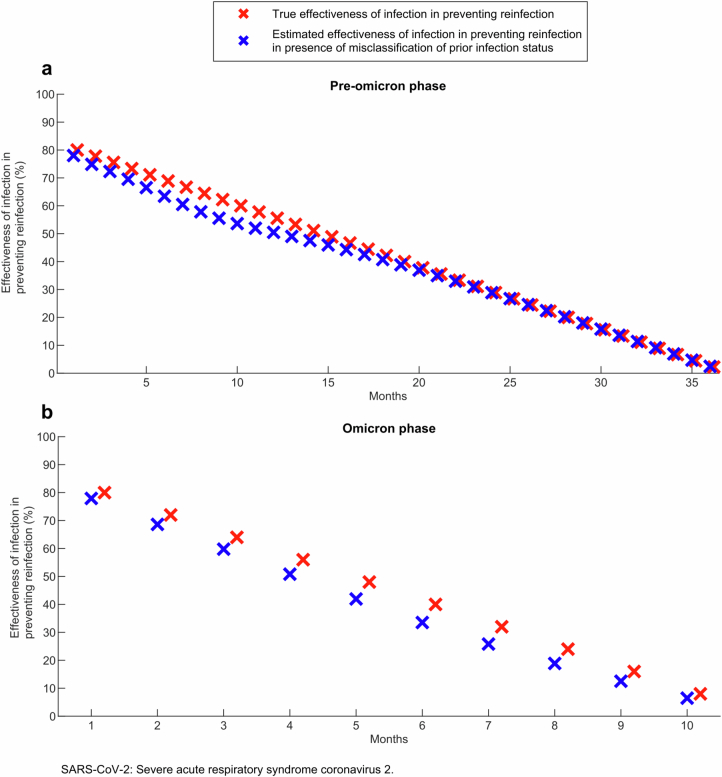
The severe acute respiratory syndrome coronavirus 2 (SARS-CoV-2) has rapidly evolved over short timescales, leading to the emergence of more transmissible variants such as Alpha and Delta1-3. The arrival of the Omicron variant marked a major shift, introducing numerous extra mutations in the spike gene compared with earlier variants1,2. These evolutionary changes have raised concerns regarding their potential impact on immune evasion, disease severity and the effectiveness of vaccines and treatments1,3. In this epidemiological study, we identified two distinct patterns in the protective effect of natural infection against reinfection in the Omicron versus pre-Omicron eras. Before Omicron, natural infection provided strong and durable protection against reinfection, with minimal waning over time. However, during the Omicron era, protection was robust only for those recently infected, declining rapidly over time and diminishing within a year. These results demonstrate that SARS-CoV-2 immune protection is shaped by a dynamic interaction between host immunity and viral evolution, leading to contrasting reinfection patterns before and after Omicron's first wave. This shift in patterns suggests a change in evolutionary pressures, with intrinsic transmissibility driving adaptation pre-Omicron and immune escape becoming dominant post-Omicron, underscoring the need for periodic vaccine updates to sustain immunity.


Conflict of interest statement

Competing interests: A.A.B. has received institutional grant funding from Gilead Sciences unrelated to the work presented in this paper. The other authors declare no competing interests.

Figures

Fig. 1
Fig. 1. Effectiveness of previous infection against reinfection.
a,b, Effectiveness of infection in preventing reinfection regardless of symptoms (a) and in preventing severe, critical or fatal COVID-19 on reinfection (b), by time since the previous infection. a, Includes 384,231 and 684,257 independent samples for cases and controls, respectively, in the pre-Omicron era analysis, and 269,991 and 432,955 independent samples for each of cases and controls, respectively, in the Omicron era analysis. Panel b includes 9,833 and 37,698 independent samples for cases and controls, respectively, in the pre-Omicron era analysis, and 230 and 650 independent samples for each of cases and controls, respectively, in the Omicron era analysis. Data are presented as effectiveness point estimates and corresponding 95% CIs. Error bars indicate the 95% CIs. Measures were not adjusted for multiplicity. In this figure, the 95% CIs are exceedingly small, rendering them barely noticeable for the protection against reinfection in both pre-Omicron and Omicron analyses, as well as for the protection against severe, critical or fatal COVID-19 on reinfection in the pre-Omicron era. This is attributed to the very large sample sizes in these analyses. However, because of the small number of cases of severe forms of COVID-19 in the Omicron era, the 95% CIs are very wide for the protection against severe, critical or fatal COVID-19 on reinfection in the Omicron era. aThe negative lower bound for the CI was truncated because the CI was too wide.
Extended Data Fig. 1
Extended Data Fig. 1. Study population selection process in the pre-omicron analysis.
Flowchart describing the population selection process for investigating the effectiveness of a pre-omicron infection in preventing reinfection with a pre-omicron virus.
Extended Data Fig. 2
Extended Data Fig. 2. Study population selection process in the omicron analysis.
Flowchart describing the population selection process for investigating the effectiveness of an omicron infection in preventing reinfection with an omicron virus.
Extended Data Fig. 3
Extended Data Fig. 3. SARS-CoV-2 infection incidence in Qatar.
Daily count of newly diagnosed SARS-CoV-2 infections up to the end of the study, between February 5, 2020 and February 12, 2024.
Extended Data Fig. 4
Extended Data Fig. 4. Effectiveness of previous infection in preventing reinfection by vaccination status.
Effectiveness of infection in preventing reinfection by time since prior infection by vaccination status in the a) pre-omicron era and b) omicron era. a includes 353,485 and 627,836 independent samples for unvaccinated cases and controls, respectively, and 30,746 and 56,421 independent samples for vaccinated cases and controls, respectively. b includes 93,830 and 157,697 independent samples for unvaccinated cases and controls, respectively, and 176,161 and 275,258 independent samples for vaccinated cases and controls, respectively. Data are presented as effectiveness point estimates and corresponding 95% confidence intervals. Error bars indicate the 95% confidence intervals. Measures were not adjusted for multiplicity.
Extended Data Fig. 5
Extended Data Fig. 5. Impact of bias due to misclassification of prior infection status.
Impact of bias due to misclassification of prior infection status in the test-negative design, assuming 90% of SARS-CoV-2 infections are undocumented. The figure shows the simulated estimated effectiveness of infection against reinfection in presence of misclassification of prior infection status compared to the true effectiveness of infection against reinfection in the pre-omicron a) and omicron b) phases of the pandemic.
Extended Data Fig. 6
Extended Data Fig. 6. Impact of misclassification of coexisting condition status on the results for the pre-omicron era.
The figure compares the main analysis results to those of a sensitivity analysis, where matching by the number of coexisting conditions was entirely removed to simulate complete under-ascertainment of coexisting conditions. The comparisons include: a) overall effectiveness of infection in preventing reinfection, b) overall effectiveness of infection in preventing severe, critical, or fatal COVID-19 upon reinfection, c) overall effectiveness of infection in preventing reinfection for each of vaccinated and unvaccinated individuals, d) effectiveness of infection in preventing reinfection by time since prior infection, and e) effectiveness of infection in preventing severe, critical, or fatal COVID-19 upon reinfection by time since prior infection. Main analysis includes 384,231 and 684,257 independent samples for cases and controls, respectively. Sensitivity analysis includes 401,686 and 723,529 independent samples for cases and controls, respectively. Data are presented as effectiveness point estimates and corresponding 95% confidence intervals. Error bars indicate the 95% confidence intervals. Measures were not adjusted for multiplicity.
Extended Data Fig. 7
Extended Data Fig. 7. Impact of misclassification of coexisting condition status on the results for the omicron era.
The figure compares the main analysis results to those of a sensitivity analysis, where matching by the number of coexisting conditions was entirely removed to simulate complete under-ascertainment of coexisting conditions. The comparisons include: a) overall effectiveness of infection in preventing reinfection, b) overall effectiveness of infection in preventing severe, critical, or fatal COVID-19 upon reinfection, c) overall effectiveness of infection in preventing reinfection for each of vaccinated and unvaccinated individuals, d) effectiveness of infection in preventing reinfection by time since prior infection, and e) effectiveness of infection in preventing severe, critical, or fatal COVID-19 upon reinfection by time since prior infection. Main analysis includes 269,991 and 432,955 independent samples for cases and controls, respectively. Sensitivity analysis includes 287,576 and 464,064 independent samples for cases and controls, respectively. Data are presented as effectiveness point estimates and corresponding 95% confidence intervals. Error bars indicate the 95% confidence intervals. Measures were not adjusted for multiplicity.
Extended Data Fig. 8
Extended Data Fig. 8. Validation of the results for the pre-omicron era using a cohort study design.
The figure compares the main analysis results obtained using the test-negative design to the results obtained using the cohort study design. The comparisons include: a) overall effectiveness of infection in preventing reinfection, b) overall effectiveness of infection in preventing severe, critical, or fatal COVID-19 upon reinfection, c) overall effectiveness of infection in preventing reinfection for each of vaccinated and unvaccinated individuals, d) effectiveness of infection in preventing reinfection by time since prior infection, and e) effectiveness of infection in preventing severe, critical, or fatal COVID-19 upon reinfection by time since prior infection. Analysis using the test-negative design includes 384,231 and 684,257 independent samples for cases and controls, respectively. Analysis using the cohort design includes 339,019 independent samples for each of the primary infection and uninfected cohorts. Data are presented as effectiveness point estimates and corresponding 95% confidence intervals. Error bars indicate the 95% confidence intervals. Measures were not adjusted for multiplicity.
Extended Data Fig. 9
Extended Data Fig. 9. Validation of the results for the omicron era using a cohort study design.
The figure compares the main analysis results obtained using the test-negative design to the results obtained using the cohort study design. The comparisons include: a) overall effectiveness of infection in preventing reinfection, b) overall effectiveness of infection in preventing severe, critical, or fatal COVID-19 upon reinfection, c) overall effectiveness of infection in preventing reinfection for each of vaccinated and unvaccinated individuals, d) effectiveness of infection in preventing reinfection by time since prior infection, and e) effectiveness of infection in preventing severe, critical, or fatal COVID-19 upon reinfection by time since prior infection. Analysis using the test-negative design includes 269,991 and 432,955 independent samples for cases and controls, respectively. Analysis using the cohort design includes 329,117 independent samples for each of the primary infection and uninfected cohorts. Data are presented as effectiveness point estimates and corresponding 95% confidence intervals. Error bars indicate the 95% confidence intervals. Measures were not adjusted for multiplicity.

References

    1. Markov, P. V. et al. The evolution of SARS-CoV-2. Nat. Rev. Microbiol.21, 361–379 (2023). - PubMed
    1. Roemer, C. et al. SARS-CoV-2 evolution in the omicron era. Nat. Microbiol.8, 1952–1959 (2023). - PubMed
    1. Subissi, L. et al. An early warning system for emerging SARS-CoV-2 variants. Nat. Med.28, 1110–1115 (2022). - PMC - PubMed
    1. Abu-Raddad, L. J. et al. Introduction and expansion of the SARS-CoV-2 B.1.1.7 variant and reinfections in Qatar: a nationally representative cohort study. PLoS Med.18, e1003879 (2021). - PMC - PubMed
    1. Abu-Raddad, L. J. et al. Severity, criticality, and fatality of the SARS-CoV-2 Beta variant. Clin. Infect. Dis. 10.1093/cid/ciab909 (2021). - PMC - PubMed

MeSH terms

Supplementary concepts