. 2025 Feb;638(8052):1104-1111.
doi: 10.1038/s41586-024-08509-3. Epub 2025 Feb 5.

SKI complex loss renders 9p21.3-deleted or MSI-H cancers dependent on PELO

Affiliations

SKI complex loss renders 9p21.3-deleted or MSI-H cancers dependent on PELO

Patricia C Borck et al. Nature. 2025 Feb.

Abstract

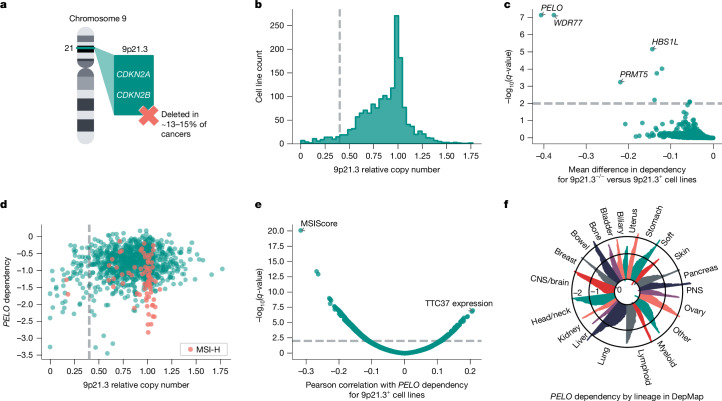
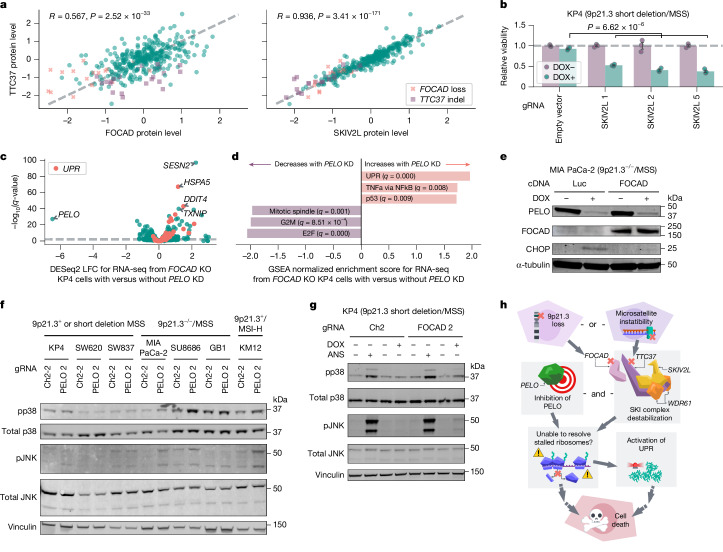
Cancer genome alterations often lead to vulnerabilities that can be used to selectively target cancer cells. Various inhibitors of such synthetic lethal targets have been approved by the FDA or are in clinical trials, highlighting the potential of this approach1-3. Here we analysed large-scale CRISPR knockout screening data from the Cancer Dependency Map and identified a new synthetic lethal target, PELO, for two independent molecular subtypes of cancer: biallelic deletion of chromosomal region 9p21.3 or microsatellite instability-high (MSI-H). In 9p21.3-deleted cancers, PELO dependency emerges from biallelic deletion of the 9p21.3 gene FOCAD, a stabilizer of the superkiller complex (SKIc). In MSI-H cancers, PELO is required owing to MSI-H-associated mutations in TTC37 (also known as SKIC3), a critical component of the SKIc. We show that both cancer subtypes converge to destabilize the SKIc, which extracts mRNA from stalled ribosomes. In SKIc-deficient cells, PELO depletion induces the unfolded protein response, a stress response to accumulation of misfolded or unfolded nascent polypeptides. Together, our findings indicate PELO as a promising therapeutic target for a large patient population with cancers characterized as MSI-H with deleterious TTC37 mutations or with biallelic 9p21.3 deletions involving FOCAD.


Conflict of interest statement

Competing interests: S.R. holds equity in Amgen and receives research funding from Microsoft. J.R.P. is a paid consultant for ProFound Therapeutics. T.R.G. receives research funding from Calico Life Sciences and Deerfield Management, is a founder and equity holder of Sherlock Biosciences and Amplifyer Bio, and serves as a paid consultant and equity holder of Anji Pharmaceuticals and Dewpoint Therapeutics. C.D.C. serves as a paid consultant for Droplet Biosciences. J.M.D. is a consultant for and owns equity in Jumble Therapeutics. E.M.C. serves as a paid consultant for AbbVie, receives research support from Novartis and Genentech, and has received research support from Bayer. F.V. receives research support from the Dependency Map Consortium, Riva Therapeutics, Bristol Myers Squibb, Merck, Illumina and Deerfield Management. F.V. is on the scientific advisory board of GSK, is a consultant for and holds equity in Riva Therapeutics, and is a cofounder of and holds equity in Jumble Therapeutics. The remaining authors declare no competing interests.

Figures

Fig. 1
Fig. 1. Analyses of DepMap data to identify dependencies associated with 9p21.3 deletion.
a, Illustration of chromosome 9 cytoband 9p21.3, which is biallelically deleted (9p21.3−/−) in approximately 13–15% of human cancers. b, Histogram of 9p21.3 relative copy number across DepMap cell lines (n = 1,750). Threshold of less than 0.4 (dashed line) indicates cell lines characterized as 9p21.3−/−. c, q-values from left-tailed Student’s t-test between 9p21.3−/− (less than 0.4 threshold, n = 63 cell lines) or at least one intact copy of 9p21.3 (9p21.3+, n = 1,037 cell lines) plotted against the mean difference in gene dependency in DepMap. d, PELO dependency plotted against 9p21.3 relative copy number (n = 1,100 cell lines), with MSI-H cell lines (MSIsensor2 MSIScore > 20, n = 73) highlighted. e, Univariate associations of DepMap omics data with PELO dependency score in 9p21.3+ cell lines (n = 1,037). f, PELO dependency score for cell lines (n = 1,100) grouped by OncoTree lineage. Ovary, ovary and/or fallopian tube; bladder: bladder and/or urinary tract; soft, soft tissue; stomach, oesophagus and/or stomach; head/neck, head and neck; PNS, peripheral nervous system; biliary, biliary tract; ampulla, ampulla of Vater. Relative copy number, gene dependency and omics data are from DepMap 23Q4 or 24Q2 release. Source Data
Fig. 2
Fig. 2. Focused validation of PELO dependency in vitro and in vivo.
a, Viability effect of CRISPRi-mediated PELO knockdown (KD) normalized to average of negative controls (grey dashed line; empty vector and/or gRNA Ch2-2) and positive controls (orange dotted line; gRNA for SF3B1 and/or POLR2D) for 9p21.3+ or short deletion/MSS (n = 4), 9p21.3−/−/MSS (n = 3) and 9p21.3+/MSI-H cell lines (n = 3). b, Top, immunoblots of PELO and vinculin in MIA PaCa-2 cells transduced with the indicated gRNA ± PELO cDNA. Bottom, viability scores normalized to average viability of negative controls. c, Immunoblots of PELO and vinculin levels in the indicated patient-derived tumour organoid models. Relative viability following DOX-induced knockdown of the indicated gRNA, relative to DMSO control. d, Average tumour volume over time for nude mice with subcutaneous engraftment of MIA PaCa-2 cells following randomization to a standard diet (control) or DOX-containing diet to induce PELO knockdown. e, Kaplan–Meier survival plot for mice randomized to DOX-containing (n = 5) or standard (n = 6) diet. Data are mean ± s.e.m. of biological replicates: n = 6 for all cell lines except KP4 and GB1, for which n = 7, and IGROV-1, for which n = 3 in a, n = 3 in b, n = 2 for PANFR0127 and PANFR0071 and n = 3 for CCLF_CORE_0001 in c; n = 9 tumours for standard diet and n = 10 for DOX-containing diet in d. Significance was calculated as follows: left-tailed Student’s t-test (a), right-tailed Student’s t-test (b), pairwise log-rank test (e). Representative data are shown from two experiments in a and one experiment in be. Experiments were performed twice for ac and once for d and e. For immunoblots, vinculin was used as loading control. Source Data
Fig. 3
Fig. 3. Dissecting the molecular mechanisms underlying PELO dependency in 9p21.3−/− and MSI-H cancers.
a, Left, CRISPR knockout (KO) screen targeting 9p21.3 genes in KP4 cells with CRISPRi knockdown using Ch2-2 gRNA (control), or PELO gRNA 1 or 2. Right, differences in Chronos gene effect scores between PELO and Ch2-2 knockdown for both PELO gRNAs. b, Top, immunoblots of FOCAD, PELO and GAPDH in WM793 cells. Bottom, relative viability of WM793 cells with Ch2 gRNA or FOCAD knockout ± DOX-induced PELO knockdown. c, Top, immunoblots of FOCAD, PELO and α-tubulin in MIA PaCa-2 cells. Bottom, relative viability in MIA PaCa-2 cells stably expressing indicated cDNA ± DOX-induced PELO knockdown. d, Pearson correlation of microsatellite site length with PELO dependency scores in MSI-H cells (n = 73 cell lines). e, Cell lines (n = 1,100) plotted by PELO dependency and length of TTC37 intron 29 microsatellite repeats. f, Top, immunoblots of TTC37, PELO and β-actin in KP4 cells. Bottom, relative viability of KP4 ± TTC37 knockout ± DOX-induced PELO knockdown cells. g, Top, immunoblots of TTC37, PELO and β-actin in HCT116. Bottom, relative viability of HCT116 cells stably expressing the indicated cDNA ± DOX-induced PELO knockdown. Data are mean ± s.e.m. of biological replicates: n = 2 in a; n = 3 in b, f and g; and n = 3 except for PELO cDNA in DOX− condition, for which n = 2, in c. Significance was calculated as follows: in a, left-tailed Wilcoxon rank-sum test; in b and f, left-tailed Student’s t-test; in c and g, right-tailed Student’s t-test. Representative data from one experiment are shown. All experiments were performed twice, except for the experiment in a, which was performed once. For immunoblots, GAPDH, α-tubulin and β-actin were used as loading controls. Neg. ctrl, negative control; Pos. ctrl, positive control. Source Data
Fig. 4
Fig. 4. Evaluating loss of the SKIc as the common thread of PELO dependency.
a, Comparison of TTC37, FOCAD and SKIV2L protein levels across cell lines (n = 375) with FOCAD loss (relative copy number < 0.4, n = 17) or TTC37 insertion–deletion (indel; ≤9 microsatellite repeats, n = 23) indicated. b, Relative viability of KP4 cells with the indicated CRISPR knockout gRNAs ± DOX-induced PELO knockdown. c, q-values from DESeq2 Wald test for differential expression between RNA sequencing from KP4 FOCAD knockout cells ± DOX-induced PELO knockdown plotted against log2-transformed fold change. Genes in the Hallmark UPR gene set are highlighted. d, Hallmark gene set enrichment prerank results for log2-transformed fold changes shown in c. e, Immunoblots of PELO, FOCAD, CHOP and α-tubulin in MIA PaCa-2 cells with Luc or FOCAD cDNA ± DOX-induced PELO knockdown. f, Immunoblots of phospho-p38 (pp38, Thr180/Tyr182), total p38, phospho-JNK (pJNK, Thr183/Tyr185), total JNK and vinculin in the indicated cell lines with Ch2-2 gRNA or PELO knockdown. g, Immunoblots of pp38 (Thr180/Tyr182), total p38, pJNK (Thr183/Tyr185), total JNK and vinculin for KP4 cells with Ch2 gRNA or FOCAD knockout ± DOX-induced PELO knockdown ± anisomycin (ANS, positive control). h, Model of synthetic lethality between PELO dependency and 9p21.3−/− and MSI-H cancers. Created in Lucid (lucid.co). Data are mean ± s.e.m. of biological replicates: n = 3 for (bd). Significance was calculated using right-tailed Student’s t-test in b. Representative data from one experiment are shown. All experiments were performed twice, except for experiments in c,d,f, which were performed once. For immunoblots, α-tubulin and vinculin were used as loading controls. Source Data
Extended Data Fig. 1
Extended Data Fig. 1. Analyses of functional genomic datasets identify PELO as preferential dependency.
(a) Upper figure: histogram of 9p21.3 relative copy number across cell lines. Dashed vertical lines represent 9p21.3 relative copy number thresholds between 0.2 and 0.6 tested for calling 9p21.3−/−. Lower figures: q-value from left-tailed Student’s t-test plotted against the mean difference of gene dependency scores between 9p21.3−/− or 9p21.3+cell lines for each indicated threshold. (b) q-value from two-tailed Student’s t-test plotted against the mean difference of dependency scores between 9p21.3+/MSI-H (n = 71) and 9p21.3+/MSS cell lines (n = 966). Source Data
Extended Data Fig. 2
Extended Data Fig. 2. Focused validation of PELO dependency.
(a) Relative viability normalizing to negative control, with mean of positive controls per cell line represented by horizontal red lines. (b) Immunoblot of PELO and Vinculin levels in indicated cell lines 4-6 days following transduction of indicated gRNAs. (c) Immunoblot of PELO and β-actin levels in engrafted MIA PaCa-2 tumors n = 1 mice on standard diet (DOX−) or n = 3 mice on DOX-containing diet (DOX+). DOX+ tumors were harvested at indicated times following the start of the diet. (d) Tumor volume plotted by time following randomization for individual MIA PaCa-2 xenograft growth ± DOX-induced PELO KD, showing all tumors (n = 19). All DOX-treated mice resumed a standard diet 66 days following randomization. Data are mean ± s.e.m. of biological replicates: n = 6 for all cell lines except KP4 and GB1 where n = 7 and IGROV-1 where n = 3 in (a), and n = 9 tumors on standard diet and n = 10 for DOX-containing diet in (d). n = 4 mice for (c). Significance was calculated as follows: (a) left-tailed Student’s t-test. Representative data from two experiments in (a,b) and one experiment in (c,d). Experiments were performed twice for (a,b) and once for (c,d). For immunoblots, Vinculin and β-actin were used as loading controls. Source Data
Extended Data Fig. 3
Extended Data Fig. 3. Characterizing the molecular alterations underlying PELO dependency.
(a) Pearson correlation of relative copy number for genes on cytoband 9p21.3 with PELO dependency scores in 9p21.3−/− cell lines. Genes included in the Cas12a library targeting 9p21.3 in red. (b) Left figure: immunoblot of FOCAD, PELO, Vinculin levels in KP4. Right figure: relative viability with indicated DOX-inducible gRNAs treated with DMSO or DOX. (c) Frequency of select alterations in TCGA dataset (n = 10,715 profiled tumors for HOMDEL and n = 10,443 for MUT_DRIVER). (d) TTC37 mRNA transcript expression versus number of TTC37 microsatellite repeats in cell lines (n = 1407). (e) TTC37 protein levels versus number of TTC37 microsatellite repeats in cell lines (n = 372). (f) PELO dependency versus FOCAD relative copy number in cell lines (n = 1100), with cell lines harboring TTC37 indels (≤ 9 microsatellite repeats, n = 32) highlighted. (g) Left figure: immunoblot of TTC37, PELO and β-actin. Right figure: relative viability of KM12 stably expressing indicated cDNA ± DOX-induced PELO KD. (h) Immunoblot of TTC37, PELO and β-actin. Relative viability of DLD1 stably expressing indicated cDNA ± DOX-induced PELO KD. (i) PELO, KRAS, BRAF dependency in cell lines with or without their corresponding biomarker and in 4 immortalized non-cancerous cell lines. Data are mean ± s.e.m. of biological replicates: n = 3 in (b); n = 3 except for TTC37 cDNA DOX- where n = 2 in (g) and n = 3 in (h). For box plots in (i), the center line marks the median, the edges of the box represent the 25th–75th percentiles, and the whiskers span minimum-maximum values. Significance was calculated as follows: (b) left-tailed Student’s t-test, (g,h) right-tailed Student’s t-test, (i) left-tailed Student’s t-test. Representative data from one experiment are shown. All experiments were performed twice. For immunoblots, Vinculin and β-actin were used as loading controls. Source Data
Extended Data Fig. 4
Extended Data Fig. 4. Evaluating the relationship between FOCAD and the SKIc subunits.
(a) Comparison of SKIc protein levels (n = 375 cell lines) and mRNA expression levels (n = 1485) in cell lines. (b) Comparison of cell lines for FOCAD protein level and SKIV2L or TTC37 mRNA expression levels (n = 369). (c) Immunoblot of PELO, TTC37, SKIV2L, α-tubulin in representative 9p21.3+/MSI-H and 9p21.3+ or Short Deletion/MSS cell lines. (d) Immunoblot of TTC37, FOCAD, SKIV2L, and GAPDH in representative 9p21.3−/−/MSS and 9p21.3+ or Short Deletion/MSS cell lines. Significance was calculated as follows: (a, b) Pearson’s R. Representative data from one experiment are shown. All experiments were performed once. For immunoblots, α-tubulin and GAPDH were used as loading controls. Source Data
Extended Data Fig. 5
Extended Data Fig. 5. Evaluating the cellular consequences of PELO depletion in SKIc-deficient cancers.
(a) Quantification (left) of immunoblot (right) for SKIV2L, TTC37, and β-actin protein levels for indicated cDNA in MIA PaCa-2. (b) Quantification (right) of immunoblot (left) for SKIV2L, TTC37, PELO, and α-tubulin protein levels for indicated enAasCas12a gRNAs ± DOX-induced PELO KD in KP4. (c) Immunoblot of SKIV2L, PELO, and β-actin in KP4 cells with indicated enAasCas12a gRNAs ± DOX-induced PELO KD. (d) Minimum SKIc protein level (calculated per cell line by taking the minimum of SKIV2L, TTC37, WDR61) versus PELO dependency across cell lines (n = 302). (e) SKIV2L protein level versus PELO dependency across cell lines (n = 302). (f) q-value from DESeq2 Wald test for differential expression between RNA-seq from KP4 control (Ch2 KO) and FOCAD KO cells plotted against log2-fold change. (g) q-value from DESeq2 Wald test for differential expression between RNA-seq from KP4 control (Ch2 gRNA) cells ± DOX-induced PELO KD plotted against log2-fold change. (h) Immunoblot of PELO, CHOP, and β-actin in indicated cell lines ± DOX-induced PELO KD. (i) Immunoblot of PELO, FOCAD, CHOP, and α-tubulin in KP4 cells with Ch2 gRNA or FOCAD#2 ± DOX-induced PELO KD. (j) Reverse transcription quantitative polymerase chain reaction of spliced XBP1 ± DOX-induced PELO KD in control (Ch2 gRNA) or FOCAD-deleted KP4 cells. Data are mean ± s.e.m. of biological replicates: n = 1 in two independent experiments in (a,b); n = 3 performed once in (f, g); n = 1 in two independent experiments in (h,i). n = 3 for two independent experiments in (j). Significance was calculated as follows: (d, e) Pearson’s R, (j) right-tailed Student’s t-test. Representative data from two experiments are shown in (a,b,j). Data from one experiment are shown for (c,f,g,h,i). β-actin and α-tubulin were used as loading controls. Source Data

References

    1. Paluch-Shimon, S. & Cardoso, F. PARP inhibitors coming of age. Nat. Rev. Clin. Oncol.18, 69–70 (2021). - PubMed
    1. Engstrom, L. D. et al. MRTX1719 is an MTA-cooperative PRMT5 inhibitor that exhibits synthetic lethality in preclinical models and patients with MTAP-deleted cancer. Cancer Discov13, 2412–2431 (2023). - PMC - PubMed
    1. Ferretti, S. et al. Discovery of WRN inhibitor HRO761 with synthetic lethality in MSI cancers. Nature629, 443–449 (2024). - PMC - PubMed
    1. Beroukhim, R. et al. The landscape of somatic copy-number alteration across human cancers. Nature463, 899–905 (2010). - PMC - PubMed
    1. Han, G. et al. 9p21 loss confers a cold tumor immune microenvironment and primary resistance to immune checkpoint therapy. Nat. Commun.12, 5606 (2021). - PMC - PubMed

LinkOut - more resources