. 2025 Mar;639(8053):205-213.
doi: 10.1038/s41586-024-08500-y. Epub 2025 Feb 5.

Antibody prophylaxis may mask subclinical SIV infections in macaques

Affiliations

Antibody prophylaxis may mask subclinical SIV infections in macaques

Christopher A Gonelli et al. Nature. 2025 Mar.

Abstract

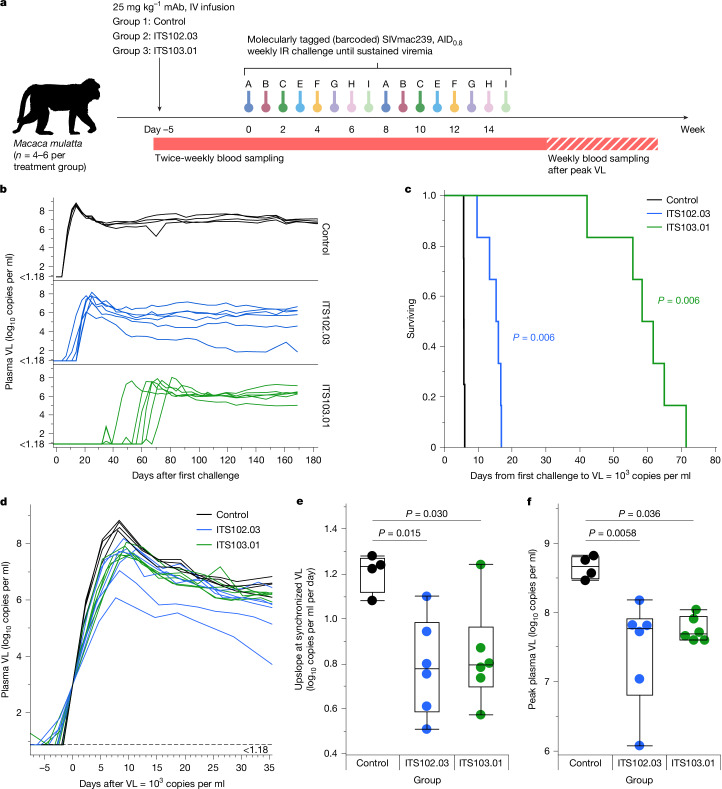
Broadly neutralizing antibodies (bNAbs) show potential to prevent human immunodeficiency virus (HIV-1) infection in humans1. However, there are limited data on the antibody concentrations required to prevent infection. Clinical trials of bNAb prophylaxis have demonstrated partial efficacy2, but the sampling frequency typically does not allow precise timing of infection events and concurrent antibody levels. Here, using simian immunodeficiency virus (SIV) infection of rhesus macaques, we show that although potent bNAbs can delay the onset of acute viremia, subclinical infections occur while bNAb levels remain high. Serial SIV challenge of monkeys given partially and fully neutralizing bNAbs revealed that 'viral blips'-low and transient plasma viremia-often occur while serum bNAb concentrations are well above currently accepted protective levels. To understand the precise timing of the infections resulting in such blips, we performed plasma viral sequencing on monkeys that were serially challenged with genetically barcoded SIV after bNAb administration. These analyses showed that subclinical infections occurred in most animals that were given potent bNAb prophylaxis. These subclinical infections occurred while antibody concentrations were 2- to 400-fold higher than the levels required to prevent fully viremic breakthrough infection. This study demonstrates that immunoprophylaxis can mask subclinical infections, which may affect the interpretation of prophylactic HIV-1 bNAb clinical trials.


Conflict of interest statement

Competing interests: The authors declare no competing interests.

Figures

Fig. 1
Fig. 1. Study design, SIV viral loads and time to infection following fully and partially neutralizing antibody infusion.
a, Infusion of partially and/or fully neutralizing mAbs and schema of the challenge study. b, Longitudinal plasma viral load (VL) up to 240 days after the first challenge, stratified according to treatment group. c, Longitudinal plasma VL synchronized to when 1,000 copies per millilitre was reached, stratified according to treatment group. Animals with VLs trending lower over time have their IDs indicated next to their curve. IDs with an asterisk indicate animals with known MHC alleles associated with control of virus replication (Supplementary Table 5). d, Survival curves of days until likely infection date according to treatment group. e, Survival curves of days until likely infection, with animals from antibody treatment groups clustered according to whether they received treatment with the fully neutralizing ITS103.01 mAb (+ITS103.01 mAb) or lacked ITS103.01 in the delivered mAbs (−ITS103.01 mAb). Group 1 (control) animals are shown separately. In d and e, survival curves for the control and each mAb treatment group or cluster were compared using a two-tailed Wilcoxon test; significant differences (P < 0.05, Bonferroni-corrected for multiple comparisons) are indicated for each mAb treatment (by legend colour) versus control. Source Data
Fig. 2
Fig. 2. Viral kinetics and plasma antibody levels following fully and partially neutralizing antibody infusion.
a,b, Peak plasma VL (a) and rate of viremia increase (upslope; b) measured from synchronized VL curves when VL was equal to 1,000 copies per millilitre. Animals in the antibody treatment group were pooled according to whether they received the fully neutralizing ITS103.01 (groups 3 and 5) or the partially neutralizing mAbs (groups 2 and 4). Group 1 (control) animals are shown separately. For each graph, groups were compared by two-tailed one-way analysis of variance, and all pairwise comparisons were assessed using Tukey’s honest significant difference (HSD) test; significant (adjusted P < 0.05) differences are indicated. c,d, Antibody half-life in days of infused mAbs (c) and median longitudinal plasma mAb levels (d) (error bars indicate range; n = 6 animals for ITS01, n = 18 for ITS06.02, n = 12 for ITS103.01) with respect to the day of first viral challenge. For animal G4-3, no ITS01 half-life is shown, and the longitudinal plasma mAb levels for this animal were excluded from the median as high endogenous reactivity to the ITS01 anti-idiotypic antibody prevented calculation of the mAb decay curve (Extended Data Fig. 1). e, Plasma ITS103.01 levels measured at the time of the likely challenge causing a viral blip, at the time of the viral blip, at the challenge that probably led to infection and at the time of acute viremia (VL equal to 1,000 copies per millilitre). In each graph, the fold increase of the median mAb concentration relative to the ITS103.01 IC80 (marked by a dotted line for reference) is indicated above the data points (Extended Data Figs. 1 and 2 and Supplementary Table 1). In ac and e, data points for individual animals are shown and coloured according to treatment group (n = 6 animals per group in total). The overlaid boxes and middle line indicate the interquartile range (IQR) and median, respectively, and the whiskers indicate the range. Source Data
Fig. 3
Fig. 3. Barcoded SIV challenge study design, SIV VLs and kinetics.
a, Barcoded SIV challenge study schema. b, Longitudinal plasma VL up to 180 days after the first challenge, stratified according to treatment group. c, Survival curve for days from first challenge to acute viremia (first occurrence of VL equal to 1,000 copies per millilitre) for each treatment group. All pairwise comparisons were determined by two-tailed Wilcoxon testing, and significant differences (P < 0.05, Bonferroni-corrected for multiple comparisons) are indicated for each mAb treatment (by legend colour) versus control. d, Longitudinal plasma VL synchronized to when a VL of 1,000 copies per millilitre was first reached. Curves for individual animals are coloured according to treatment group. The limit of detection (15 copies per millilitre) is indicated by the dotted line. e,f, Rate of viremia increase (upslope; e), measured from synchronized VL curves when VL was equal to 1,000 copies per millilitre, and peak plasma VL (f). For each graph, groups were compared by two-tailed one-way analysis of variance, and all pairwise comparisons were assessed using Tukey’s HSD test. Significant (adjusted P < 0.05) differences are indicated. n = 4 (control group) or n = 6 (ITS102.03 and ITS103.1-treatment groups) animals. The overlaid boxes and middle line indicate the IQR and median, respectively, and the whiskers indicate the range. Source Data
Fig. 4
Fig. 4. Virus infections and plasma antibody levels with respect to plasma viremia barcode sequencing.
a, Longitudinal plasma VL (black) and plasma ITS103.01 mAb levels (red) up to 98 days after the first challenge are overlaid with each panel for individual animals in group 3. Open black circles represent VL of less than 15 copies per millilitre. The coloured boxes under the horizontal axis numbers designate the virus barcode used at each weekly challenge, with each animal’s final challenge indicated (yellow-filled circle). Time points where plasma viremia barcode sequencing was performed are marked by coloured bars aligned to a VL data point. Colours within the bar indicate the specific virus barcodes detected, and the area of each colour is proportional to the relative abundance of the given barcode (except for abundances <1%, which are shown as squares within their bar). N/R over a data point indicates that no barcode sequence was recovered (Supplementary Table 4). b, Survival curve of days to dominant virus infection for each treatment group. All pairwise comparisons were determined by two-tailed Wilcoxon testing, and significant differences (P < 0.05, Bonferroni-corrected) are indicated for each mAb treatment (by legend colour) versus control (Supplementary Tables 1–3). c, Plasma mAb levels measured at a subclinical infection, at viral blip, at the dominant virus infection and at acute viremia (VL = 1,000 copies per millilitre), for animals in group 2 or 3 where appropriate (n = 6 animals per group total). In each graph, the fold increase in the median mAb concentration relative to the ITS103.01 or ITS102.03 IC80 (marked by a dotted line for reference) is indicated above the data points. Individual animal data points are coloured by treatment group. Open circles represent secondary subclinical infections or viral blips for a given animal. The overlaid boxes and middle line indicate the IQR and median, respectively, and the whiskers indicate the range (Extended Data Fig. 3). Source Data
Extended Data Fig. 1
Extended Data Fig. 1. mAb neutralization against SIV isolates, and fully and partially neutralizing LS mAb pharmacokinetics in plasma.
(A) Neutralization activity of study mAbs against SIVsmE660.A8.CP3C (tier 1), SIVsmE660.2A5.CR54 (tier 2), and SIVmac239 (tier 3). Longitudinal plasma (B) ITS06.02, (C) ITS103.01, (D) ITS01 and ITS06.02, and (E) ITS103.01 and ITS06.02 mAb concentrations in animals from groups 2–5, respectively, from fully and partially neutralizing antibody infusion study relative to days following the first virus challenge. The dose of mAb used is indicated. (D–E) Separate graphs are shown for each mAb. Source Data
Extended Data Fig. 2
Extended Data Fig. 2. Viral blips in animals treated with ITS103.01 and challenged with SIVsmE660.FL14-IAKN.
Longitudinal plasma viral load (black line, left vertical axis) and plasma ITS103.01 mAb levels (red line, right vertical axis) up to 240 days post the first challenge are overlaid with each panel for an individual animal in groups 3 and 5 of the fully and partially neutralizing antibody infusion study. Viral blips (transient viremia of <1000 copies/mL plasma followed by ≥1 week of undetectable [<15 copies/mL] viral load) are indicated by the purple arrows. Source Data
Extended Data Fig. 3
Extended Data Fig. 3. Non-LS ITS102.03 and ITS103.01 mAb pharmacokinetics in plasma.
Longitudinal plasma (A) ITS102.03 and (B) ITS103.01 mAb concentrations in animals from groups 2 and 3, respectively, of the barcoded SIV challenge study relative to days following the first virus challenge (mAbs infused at day -5). (C) Antibody half-life in days of infused non-LS mAbs used in barcoded SIV challenge study (individual animal values are plotted; n = 6 animals per mAb-treatment group). The overlaid boxes and middle line indicate the IQR and median, respectively, and the whiskers are the range. Source Data
Extended Data Fig. 4
Extended Data Fig. 4. Endogenous SIV Env-specific humoral responses in barcoded SIV challenge study animals.
Longitudinal plasma antibody binding titers against SIVmac239 recombinant trimer measured as area under the curve (AUC) with pre-immune signal subtracted from 0 to 16 weeks post the dominant virus infection (as defined by the most abundant plasma virus barcode once sustained viremia occurred in each animal, see also supplementary Tables 1–3). (A) Each graph shows individual animal responses from groups 1–3 (from left to right, respectively). (B) Each group’s median antibody titer at each timepoint is shown with errors bars representing the IQR. Dotted lines equal 0. N = 4 (control group) or n = 6 (ITS102.03 and ITS103.1-treatment groups) animals. Source Data
Extended Data Fig. 5
Extended Data Fig. 5. Endogenous SIV Gag- and Env-specific T cell responses in barcoded SIV challenge study animals.
Intracellular cytokine staining was performed on PBMCs to assess T cell responses to (A, C) SIV Gag and (B, D) Env peptide pools. (A, B) Samples assessed were collected before antibody infusion (pre-immune) and 2, 6 and 16 weeks post the dominant virus infection (see Tables S1–3). Circles and squares represent individual animals. Dotted lines are equal to 0%. The overlaid boxes and middle line indicate the IQR and median, respectively, and the whiskers are the range. N = 4 (control group) or n = 6 (ITS102.03 and ITS103.1-treatment groups) animals. (C, D) For animals where a viral blip was observed (animal IDs shown below horizontal axis and day post-first virus challenge of relevant blip in parentheses where appropriate), PBMCs collected 2 weeks after the blip were assayed and are shown relative to individual’s pre-immune measurement. Solid, horizontal lines are equal to 0%. (A–D) CD4+ T cell Th1 responses (IFNγ, IL-2, or TNF), CD4+ T cell Th2 responses (IL-4 or IL-13), and CD8+ T cell responses (IFNγ, IL-2, or TNF) are shown from left to right, respectively. Responses are background-subtracted. Source Data
Extended Data Fig. 6
Extended Data Fig. 6. Env mutations detected in barcoded SIV challenge study animals.
(A) Sequencing at defined regions of Env as indicated along top of graph. Reads classified as not wild type (wt) are combined as general sequence variants (var) or as specific amino acid substitutions for PNGSs. Numbering according to HXB2 Env. All sequences are at peak viral load or additional timepoints as indicated (number of days +/– peak in parentheses). “N/A”, not assessed. (B) Single genome reads for B3-2 at peak viral load and 12 weeks later. Each row is a unique clone. The sequence around C4 and C5 glycan sites is shown with reference sequence in bold above and the PNGS is highlighted. (C) Neutralization IC50s for ITS102.03 and ITS103.01 against wt and Env mutants. Source Data
Extended Data Fig. 7
Extended Data Fig. 7. Gating strategy for intracellular cytokine staining.
Flow cytometry gating strategy used to identify and quantify antigen-specific T cells in PBMCs is shown from a representative sample. Sequential gating was used to identify T cells, followed by memory CD4+ and CD8+ T cells. Cytokine-expressing cells were then identified by co-expression of each cytokine with upregulated CD69 expression.

References

    1. Miner, M. D., Corey, L. & Montefiori, D. Broadly neutralizing monoclonal antibodies for HIV prevention. J. Int. AIDS Soc.24, e25829 (2021). - PMC - PubMed
    1. Corey, L. et al. Two randomized trials of neutralizing antibodies to prevent HIV-1 acquisition. N. Engl. J. Med.384, 1003–1014 (2021). - PMC - PubMed
    1. Global HIV & AIDS Statistics — 2023 Fact Sheet. UNAIDSwww.unaids.org/en/resources/fact-sheet (2023).
    1. Landovitz, R. J., Scott, H. & Deeks, S. G. Prevention, treatment and cure of HIV infection. Nat. Rev. Microbiol.10.1038/s41579-023-00914-1 (2023). - PubMed
    1. Velloza, J., Delany-Moretlwe, S. & Baeten, J. M. Comprehensive HIV risk reduction interventions for 2020 and beyond: product choices and effective service-delivery platforms for individual needs and population-level impact. Curr. Opin. HIV AIDS14, 423–432 (2019). - PubMed

MeSH terms

LinkOut - more resources