Clinical Trial
. 2025 Mar;639(8054):474-482.
doi: 10.1038/s41586-024-08507-5. Epub 2025 Feb 5.

A neoantigen vaccine generates antitumour immunity in renal cell carcinoma

Affiliations
Clinical Trial

A neoantigen vaccine generates antitumour immunity in renal cell carcinoma

David A Braun et al. Nature. 2025 Mar.

Abstract

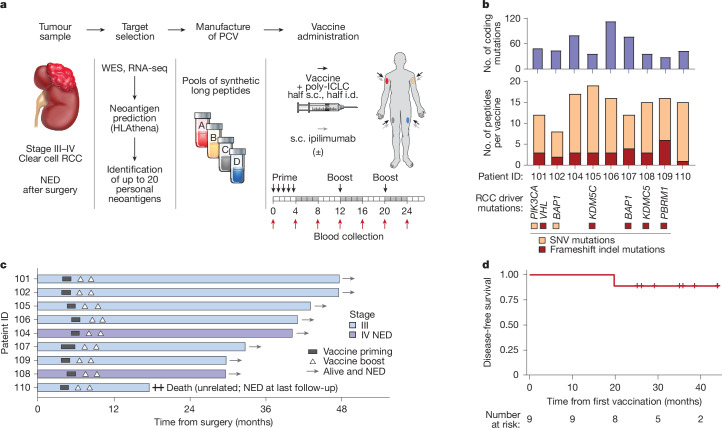
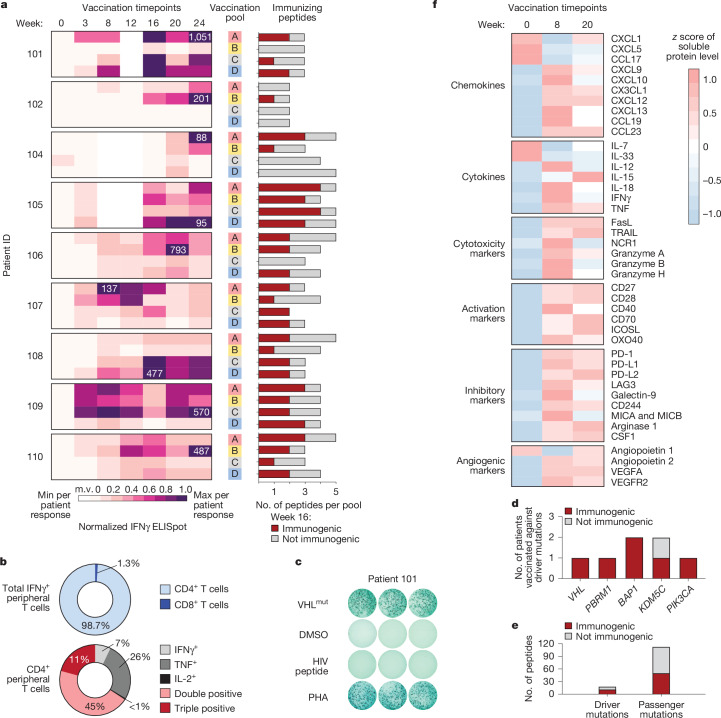
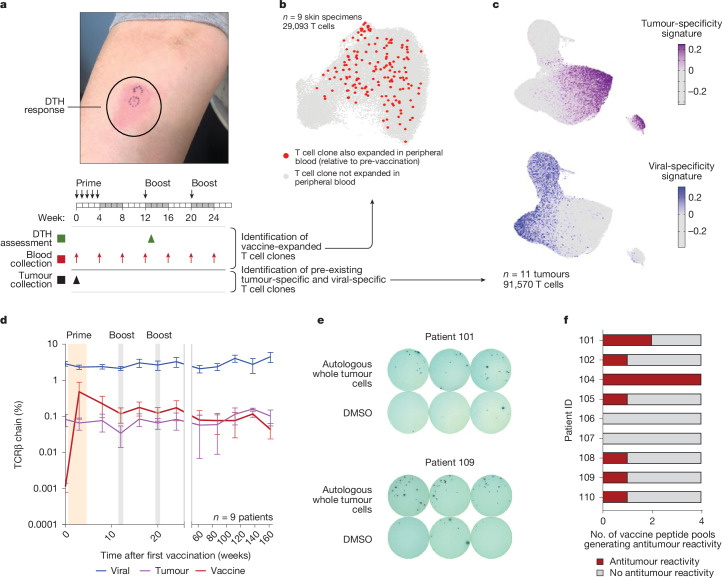
Personalized cancer vaccines (PCVs) can generate circulating immune responses against predicted neoantigens1-6. However, whether such responses can target cancer driver mutations, lead to immune recognition of a patient's tumour and result in clinical activity are largely unknown. These questions are of particular interest for patients who have tumours with a low mutational burden. Here we conducted a phase I trial (ClinicalTrials.gov identifier NCT02950766) to test a neoantigen-targeting PCV in patients with high-risk, fully resected clear cell renal cell carcinoma (RCC; stage III or IV) with or without ipilimumab administered adjacent to the vaccine. At a median follow-up of 40.2 months after surgery, none of the 9 participants enrolled in the study had a recurrence of RCC. No dose-limiting toxicities were observed. All patients generated T cell immune responses against the PCV antigens, including to RCC driver mutations in VHL, PBRM1, BAP1, KDM5C and PIK3CA. Following vaccination, there was a durable expansion of peripheral T cell clones. Moreover, T cell reactivity against autologous tumours was detected in seven out of nine patients. Our results demonstrate that neoantigen-targeting PCVs in high-risk RCC are highly immunogenic, capable of targeting key driver mutations and can induce antitumour immunity. These observations, in conjunction with the absence of recurrence in all nine vaccinated patients, highlights the promise of PCVs as effective adjuvant therapy in RCC.


Conflict of interest statement

Competing interests: Bristol-Myers Squibb provided ipilimumab, but no funding support for the clinical trial. D.A.B reports share options in Elephas; advisory board, consulting or personal fees from Cancer Expert Now, Adnovate Strategies, MDedge, CancerNetwork, Catenion, OncLive, Cello Health BioConsulting, PWW Consulting, Haymarket Medical Network, Aptitude Health, ASCO Post and Harborside, Targeted Oncology, Merck, Pfizer, MedScape, Accolade 2nd MD, DLA Piper, AbbVie, Compugen, Link Cell Therapies, Scholar Rock, NeoMorph, Nimbus, Exelixis, AVEO, Eisai and Elephas; and research support from Exelixis and AstraZeneca, outside the submitted work. B.A.M. discloses personal consulting fees from Arcus, Aveo, Bristol-Myers Squibb, Daiichi Sanko, Eisai, Exelixis, Genmab, Gilead, Hexagen, Pfizer and SeaGen, and institutional disclosures for Aveo, Bristol-Myers Squibb, Exelixis, Gilead, Pfizer and SeaGen. N.R.L. is a consultant and has received honoraria from Bayer, Seattle Genetics, Sanofi, Silverback, Fortress Biotech, Synox Therapeutics, Janssen and Astellas pharma, outside the submitted work. K.S. is now an employee and shareholder of Intellia Therapeutics, which has no contribution or affiliation to the work described in this article. S.K. is now an employee of Genentech. S. Sarkizova is now an employee of Moderna and holds stock (as of January 2024). J.B.I. reports receiving consulting fees from AstraZeneca outside the submitted work. S. Signoretti reports receiving commercial research grants from Bristol-Myers Squibb, AstraZeneca, Exelixis, Merck, NiKang Therapeutics and Arsenal Biosciences; is a consultant/advisory board member for Merck, AstraZeneca, Bristol Myers Squibb, CRISPR Therapeutics AG, AACR and NCI; receives royalties from Biogenex; and mentored several non-United States citizens on research projects with potential funding (in part) from non-United States sources/Foreign Components. J.C.A. has served as a consultant for Remix Therapeutics, Ayala Pharmaceuticals, Cellestia, and on the scientific advisory board of NeuAPC, outside the submitted work. S.A.C. is a member of the scientific advisory boards of PTM BioLabs, Seer, StandUp2Cancer and PrognomIQ. I.L. serves as a consultant for PACT Pharma and has stock, is on the board and serves as a consultant for ennov1, and is on the board and holds equity in Nord Bio. G.G. receives research funds from IBM, Pharmacyclics/Abbvie, Bayer, Genentech, Calico, Ultima Genomics, Inocras and Google and is also an inventor on patent applications filed by the Broad Institute related to MSMuTect, MSMutSig, POLYSOLVER, SignatureAnalyzer-GPU, MSEye and MinimuMM-seq. He is a founder, consultant and holds privately held equity in Scorpion Therapeutics; he is also a founder of, and holds privately held equity in, PreDICTA Biosciences. He was also a consultant to Merck. N.H. holds equity in and advises Danger Bio/Related Sciences and Repertoire Immune Medicines, owns equity in BioNtech and receives research funding from Bristol Myers Squibb and Calico Life Sciences. D.S.N. owns stock in Madrigal Pharmaceuticals, outside the submitted work. K.J.L. holds equity in Standard BioTools and is on the scientific advisory board for MBQ Pharma. S.A.S. reports equity in Agenus, Agios Pharmaceuticals, Breakbio, Bristol-Myers Squibb and Lumos Pharma. S.A.S. is a consultant for Imunon and Jivanu therapeutics. E.F.F. is an equity holder in and consultant for BioNTech, an equity holder and scientific advisory board member of BioEntre, and a founder and equity holder of Dionis Therapeutics. C.J.W. is subject to a conflict-of-interest management plan for the reported studies because of her former competing financial interests in Neon Therapeutics, which was acquired by BioNTech. Under this plan, C.J.W. may not access identifiable data for human participants or otherwise participate directly in the Institutional Review Board-approved protocol reported herein. C.J.W.’s contributions to the overall strategy and data analyses occurred on a de-identified basis. Patent applications have been filed on aspects of the described work entitled as follows: ‘Compositions and methods for personalized neoplasia vaccines’ (N.H., E.F.F. and C.J.W.), ‘Methods for identifying tumour specific neoantigens’ (N.H. and C.J.W.), ‘Formulations for neoplasia vaccines’ (E.F.F.) and ‘Combination therapy for neoantigen vaccine’ (N.H., C.J.W. and E.F.F.). The DFCI, the lead site of this trial, has a proprietary and financial interest in the personalized neoantigen vaccine. D.B.K. is a scientific advisor for Immunitrack, a wholly owned subsidiary of Eli Lilly and Company and Breakbio. D.B.K. owns equity in Affimed N.V., Agenus, Armata Pharmaceuticals, Breakbio, BioMarin Pharmaceuticals, Celldex Therapeutics, Editas Medicine, Immunitybio, Lexicon Pharmaceuticals, Summit Therapeutics and Viking Therapeutics. P.A.O. has received research funding from and/or has advised Agenus, Amgen, Armo BioSciences Array, AstraZeneca/MedImmune, Bristol-Meyers Squibb, Celldex, Compass Therapeutics, CytomX, Evaxion, Immunetune, Imunon, LGChem, Merck, Neon Therapeutics (now BioNTechUS), Novartis, Pharmajet, Phio, Pfizer, Oncorus, Roche/Genentech, Servier and Xencor. Committees: NCCN. T.K.C. reports grants, personal fees and non-financial support from Roche and Genentech during the conduct of the study; and reports institutional and/or personal, paid and/or unpaid support for research, advisory boards, consultancy, and/or honoraria from Alkermes, AstraZeneca, Aravive, Aveo, Bayer, Bristol Myers-Squibb, Calithera, Circle Pharma, Eisai, EMD Serono, Exelixis, GlaxoSmithKline, Gilead, IQVA, Infinity, Ipsen, Jansen, Kanaph, Lilly, Merck, Nikang, Nuscan, Novartis, Oncohost, Pfizer, Roche, Sanofi/Aventis, Scholar Rock, Surface Oncology, Takeda, Tempest, Up-To-Date, CME events (Peerview, OncLive, MJH and others), outside the submitted work. Institutional patents filed on molecular alterations and immunotherapy response/toxicity, and ctDNA. Equity: Tempest, Pionyr, Osel, Precede Bio, CureResponse, InnDura Therapeutics, Primium. Committees: NCCN, GU Steering Committee, ASCO/ESMO, ACCRU, KidneyCan, ODAC. Mentored several non-United States citizens on research projects with potential funding (in part) from non-United States sources/Foreign Components. The institution (Dana-Farber Cancer Institute) may have received additional independent funding of drug companies and/or royalties potentially involved in research around the subject matter. G.M., V.C., E.B., C.R.T., A.P.V., C.F., J.F., A.B.A., N.R.S., Y.L., S.L., J.S., S.L.C., M.S.H., O.O., A.M., H.G., C.B.P., M.M., I.C., A.T., J.D.-C., A.A.H., B.S., J.M.S., L.E., L.R.O., S.G. and G.O. have no reported disclosures related to the current work.

Figures

Fig. 1
Fig. 1. Vaccine manufacturing process and clinical outcomes.
a, Overview of the design and administration of the neoantigen-targeting PCV for clear cell RCC. At each site, each individual received half of the vaccine subcutaneously (under the skin; s.c.) and the other half intradermally (between the layers of the skin; i.d.). The immunotherapy drug ipilimumab was also administered to a subset of individuals (indicated by ±). Blood was collected at several time points over 24 weeks (red arrows). NED, no evidence of disease; WES, whole exome sequencing. b, Summary of the vaccine manufacturing process, including the number of high-quality coding mutations in each tumour (top), the number of neoantigen vaccine peptides administered for each patient (middle) and RCC-specific driver mutations targeted by the vaccine (bottom). ID, identifier; SNV, single nucleotide variant. c, Swimmer’s plot showing the timelines and outcomes of each patient enrolled in the trial, starting at nephrectomy. d, Kaplan–Meier estimate of disease-free survival, starting at initial vaccine dose. The illustrations in a were created by Sarah Pyle and Steven Moskowitz. Source data
Fig. 2
Fig. 2. Vaccine immunogenicity and targetability of driver mutations.
a, Peripheral T cell immune responses following vaccination, measured using IFNγ ELISpot assays. Left, heatmap showing the dynamics of ex vivo T cell responses for each patient and each peptide pool. m.v. denotes missing values. White numbers in the heatmap indicate the absolute magnitude of the maximum per patient response, in spot-forming units per 106 PBMCs. Right, the number of immunogenic individual peptides in each pool following in vitro stimulation. b, Summary of flow cytometry immunophenotyping and intracellular cytokine staining for all patients with assessable responses in the study cohort. c, Example IFNγ ELISpot images against an RCC driver mutation (VHL) from patient 101 PBMCs at week 16 following in vitro stimulation with a vaccine peptide pool, with dimethylsulfoxide (DMSO) and HIV peptides as negative controls, and phytohaemagglutinin (PHA) as a positive control, in triplicate. VHLmut, mutant VHL peptide. d, Per patient immunogenicity of the five common RCC driver mutations in this study. e, Immunogenicity of pan-cancer driver and passenger mutations. f, Heatmap showing the median normalized levels of circulating plasma proteins before and after vaccination. Normalized protein expression for each soluble factor (z score). Source data
Fig. 3
Fig. 3. Vaccine-induced changes in skin-infiltrating immune cells.
a, Top, schematic of skin assessments. Bottom, example of an injection-site reaction after vaccination, 48 h after priming. b, Uniform manifold approximation and projection (UMAP) representations of scRNA-seq data of skin-infiltrating myeloid and lymphoid cells before (week 0) and after vaccination (week 4) (n = 9 patients). c, Boxplot of the proportion of antigen-presenting cells (conventional dendritic cell (DC) subsets DC1 and DC2, and Langerhans cells (LCs)) before and after vaccination. d, Boxplots of the number of unique T cell clonotypes and TCR diversity before and after vaccination. e, Boxplots of cytotoxic lymphoid populations before and after vaccination, proliferating NK cells and cytotoxic CD8+ T cells. f, Heatmap showing the relative change in expression of cytotoxicity genes in lymphoid subsets before and after vaccination. For ce, P values were calculated using two-sided paired Wilcoxon test; n = 7 paired samples, as n = 2 patients had insufficient material at baseline for scRNA-seq; boxplot hinges represent 25th to 75th percentiles, central lines represent the medians, the whiskers extend to lowest and highest values no greater than 1.5× the interquartile range away from the 25th and 75th percentiles, and the dots indicate outliers. Source data
Fig. 4
Fig. 4. Vaccination induces T cell expansion and antitumour reactivity.
a, Schematic depicting sample collection (bottom) and an example image of DTH assessment (top). b, UMAP representation of week-13 cutaneous DTH assessment. T cell clones that were highly expanded in the peripheral blood after vaccination were also found in the skin following DTH assessment. c, UMAP representation of tumour-infiltrating T cells, which demonstrates the gene expression score for tumour-specificity or viral specificity. The n = 11 tumours includes primary tumours from all 9 patients and metastatic tumours from the 2 patients with stage IV disease. d, Circulating TCR dynamics during and after vaccination, which demonstrates the relative stability of pre-existing tumour-specific and viral-specific clones and the induction of vaccine-expanded T cell clones that persist following vaccination (n = 9 patients; error bars are s.e.m.). e, Example IFNγ ELISpot images of PBMCs at week 16, which demonstrate that post-vaccine peripheral T cells, expanded against neoantigen-peptides derived from RCC driver mutations (PIK3CAmut for patient 101; PBRM1mut for patient 109), are capable of recognizing autologous tumours (assays were performed in triplicate; DMSO was used as a negative control). f, The number of neoantigen peptide pools, per patient, that generated antitumour immune reactivity. Source data
Extended Data Fig. 1
Extended Data Fig. 1. Study description and qualitative comparison to modern RCC adjuvant trials.
a, CONSORT diagram describing screening, enrollment, vaccine manufacturing, and treatment. b, Kaplan-Meier plots of disease-free survival from the current PCV study (left) and two recent, randomize phase III adjuvant immune checkpoint inhibitor trials in RCC with similar eligibility criteria, (middle) the IMmotion-010 trial of atezolizumab vs placebo, and (left) the KEYNOTE-564 of pembrolizumab vs placebo.
Extended Data Fig. 2
Extended Data Fig. 2. Peripheral T cell responses to vaccination.
a, ex vivo dynamics of peripheral T cell response to vaccination. For each patient (101 through 110), the ex vivo PBMC IFNγ ELISpot response for each vaccine peptide pool at each timepoint following start of vaccination (week 0), normalized to 106 PBMCs. Each point is the background-subtracted mean of three replicates with standard error of the mean. b, deconvolution of individual neoantigen-containing vaccine peptides that generated T cell responses to vaccination. For each patient and each vaccine pool, week 16 PBMCs were stimulated in vitro with all peptides in that pool, rested, and then left unstimulated (DMSO) or re-stimulated with the individual mutation-encoding vaccine peptide. Each graph represents the absolute IFNγ ELISpot count (mean of triplicates with standard error of the mean; * indicates P < 0.05 by two-sided t-test and mean spot count at least three-fold higher than DMSO control). Source data
Extended Data Fig. 3
Extended Data Fig. 3. Characterization of peripheral immune responses to vaccination.
a, Example IFNγ ELISpots for selected driver mutations, including SNVs (PIK3CA and BAP1) and indels (KDM5C and PBRM1). b, Gating strategy for flow cytometry assessment of T cell cytokine production and phenotype. Example flow cytometry gating strategy for identifying CD4+ and CD8+ T cells, and production of IFNγ, TNFα, and IL-2 cytokines in those T cell subsets. c, Expression of CD45RO and, d, PD-1 on CD4+ IFNγ+ (vaccine-reactive) T cells (as measured by the median fluorescence intensity; MFI) after stimulation with vaccine peptide pools.
Extended Data Fig. 4
Extended Data Fig. 4. Patient-level T cell immunophenotyping and intracellular cytokine production, and Impact of tumor-intrinsic and -extrinsic features on antigen immunogenicity.
a, Per-patient CD4+ and CD8+ composition of vaccine-reactive (IFNγ+) T cells for each vaccine peptide pool and each patient (week 16 after vaccination). n.d., not detectable (the absolute number of IFNγ+ cells were too low for evaluation, or the frequency of IFNγ was not at least 1.5-fold higher than the negative control, HIV gag protein). * The additional negative control, HIV gag, was not available for patient 110 analysis. The results are reported here for reference, but not included in the overall summary. b, Per-patient and per-vaccine pool assessment of cytokine production. For each patient, the median fluorescence intensity (MFI) of (c) PD-1 (d) CD45RO for vaccine-reactive (IFNγ+) CD4+ T cells compared to naïve T cells (CD45RA+CD27+) is shown. e-i, the immunogenicity of each neoantigen-containing vaccine peptide was assessed by stimulation of week 16 PBMCs (in vitro stimulation) and measurement of IFNγ+ by ELISpot. For tumor-intrinsic features, the immunogenicity of each vaccine peptide was examined based on (e) the clonality of the underlying mutation in the tumor and (f) the expression of that gene (measured in transcripts per million; TPM). For tumor-extrinsic features, the immunogenicity of each vaccine peptides was examined based on (g) whether the predicted T cell epitope was inferred as a strong (rank <0.5) or weak (rank <2) HLA class I binder, (h) which HLA class I allele the epitope was predicted to bind to, and (i) whether the neoantigen was derived from an SNV or an indel. Source data
Extended Data Fig. 5
Extended Data Fig. 5. Global changes in the circulating immune milieu following vaccination.
Measurement of circulating (plasma) soluble proteins prior to vaccination (week 0), during vaccine priming (week 3), and 8 weeks after the first vaccine boost (week 20) for 92 circulating cytokines (n = 8 patients for week 0, n = 9 patients for week 3, and n = 9 patients for week 20; boxplot hinges represent 25th to 75th percentiles, central lines represent the medians, the whiskers extend to lowest and highest values no greater than 1.5× interquartile range away from the 25th and 75th percentiles, and the dots indicate outliers). Source data
Extended Data Fig. 6
Extended Data Fig. 6. Single-cell transcriptomic analysis of skin-infiltrating immune cells at the site of vaccination.
a, UMAP representation of scRNA-seq of skin-infiltrating myeloid cells (N = 9 patients) at the vaccination site (right thigh). b, Heatmap of marker gene expression for each myeloid population, which was utilized to assign identity to each cell cluster. c, Boxplots of the proportion of each myeloid cell population before and after vaccination (two-sided paired Wilcoxon test; n = 7 paired samples, as n = 2 patients had insufficient material at baseline for scRNA-seq; boxplot hinges represent 25th to 75th percentiles, central lines represent the medians, the whiskers extend to lowest and highest values no greater than 1.5× interquartile range away from the 25th and 75th percentiles, and the dots indicate outliers). DC1: conventional dendritic cell (type 1); DC2: conventional dendritic cell (type 2); pDC: plasmacytoid dendritic cell. LC: Langerhans cell. d, UMAP representation of scRNA-seq of skin-infiltrating lymphoid cells (N = 9 patients) at the vaccination site (right thigh). e, Heatmap of marker gene expression for each lymphoid population, which was utilized to assign identity to each cell cluster. f, Boxplots of the proportion of each lymphoid cell population before and after vaccination (two-sided paired Wilcoxon test; n = 7 paired samples, as n = 2 patients had insufficient material at baseline for scRNA-seq; boxplot hinges represent 25th to 75th percentiles, central lines represent the medians, the whiskers extend to lowest and highest values no greater than 1.5× interquartile range away from the 25th and 75th percentiles, and the dots indicate outliers). NK cell: natural killer cell. Source data
Extended Data Fig. 7
Extended Data Fig. 7. Minimal impact of subcutaneous ipilimumab on skin-infiltrating immune cells.
The proportion of each (a) myeloid cell and (b) lymphoid cell population after vaccination (week 4) was compared in patients who received the vaccine alone or vaccine plus subcutaneous ipilimumab (two-sided Wilcoxon test; n = 4 patients who received vaccine alone, and n = 5 patients who received vaccine + ipilimumab; boxplot hinges represent 25th to 75th percentiles, central lines represent the medians, the whiskers extend to lowest and highest values no greater than 1.5× interquartile range away from the 25th and 75th percentiles, and the dots indicate outliers). Source data
Extended Data Fig. 8
Extended Data Fig. 8. Rapid and durable expansion of T cell clonotypes following vaccination.
a, For each of the n = 9 patients with peripheral blood TCR sequencing data available, the dynamics of T cell clonotypes with inferred vaccine specificity is shown following vaccination. Vaccine-expanded clonotypes were defined as undetectable or at the lower limit of detection at baseline (week 0), expands by at least 10-fold after vaccination in all subsequent timepoints (including at least 3 unique molecular identifier sequencing reads at ≥2 timepoints), and is identified in the skin during the DTH assessment. (left), Each gray line represents one T cell clonotype, and the red line represents the sum of all clonotypes for an individual patient. (middle) Each light blue line represents a CD4 clonotype, dark blue lines represent CD8 clonotypes, and gray represents unresolved clonotypes. (right) The summation of all clonotypes (red), all CD4 clonotypes (light blue), or all CD8 clonotypes (dark blue) for each patient. b, The mean (and standard error of the mean) vaccine-expanded TCR clonotype frequency over time for all n = 9 patients (linear scale). c, The median (and interquartile range) of vaccine-expanded TCR clonotype frequences over time for all n = 9 patients (red), also shown for all CD4 clonotypes (light blue) and CD8 clonotypes (dark blue). Source data
Extended Data Fig. 9
Extended Data Fig. 9. Inference of tumor-specific, viral-specific, and vaccine-specific T cell clonotypes.
UMAP representations of scRNA-seq data from lymphoid cells in (a) the skin during the cutaneous delayed-type hypersensitivity (DTH) assessment, and (b) the tumor at the time of surgical resection. Single-cell TCR-sequencing of T cells showing areas of clonotype expansion in (c) the skin (during DTH assessment) and (d) the baseline tumor. e, For tumor-infiltrating T cells, the per-clonotype average expression of previously defined gene signatures for tumor specificity (TS) and viral specificity (VS). The red lines indicate thresholds that were used to identify TS and VS T cells. f, For each clonotype that was assigned as TS or VS (or no specificity), the percentage of individual T cells within that clonotype that express predominantly the TS signature, the VS signature, or neither (dual specificity of no specificity). Overall, for clonotypes that were labeled as TS or VS, over 70% of the individual T cells were concordant with that classification. g, association of expanded CD4 T cell clonotypes with IFNγ response after vaccination. The total number of inferred vaccine-expanded clonotypes (left), CD4-only clonotypes (middle), and CD8-only clonotypes (right) in each sample is plotted against the total number of IFNγ spot-forming cells by ex vivo ELISpot assessment at week 16 following vaccination (two-sided Pearson correlation). Source data
Extended Data Fig. 10
Extended Data Fig. 10. Vaccine-reactive T cells can recognize autologous tumor cells.
IFNγ+ ELISpots from week 16 PBMCs stimulated with individual vaccine peptides (top) or pools of peptides (bottom), rested, and then re-stimulated with autologous tumor cells (which had been pre-treated with or without IFNγ+ to improve antigen presentation). Representative ELISpots from peptides harboring driver mutations in (a) VHL and (b) BAP1. c, Autologous tumor-reactivity for each patient and each assayed peptide (and which pool it was contained in). Each graph represents the absolute IFNγ ELISpot count (mean of triplicates with standard error of the mean). For Fig. 4f in the main text, a vaccine peptide considered to induce tumor-reactivity if it was significantly increased over the DMSO negative control (t-test) and had median spot count at least three-fold higher than the negative control. For patient 110, only T cells expanded using pool of vaccine peptides (pool A) were capable of recognizing autologous tumor cells. Source data

References

    1. Weber, J. S. et al. Individualised neoantigen therapy mRNA-4157 (V940) plus pembrolizumab versus pembrolizumab monotherapy in resected melanoma (KEYNOTE-942): a randomised, phase 2b study. Lancet403, 632–644 (2024). - PubMed
    1. Rojas, L. A. et al. Personalized RNA neoantigen vaccines stimulate T cells in pancreatic cancer. Nature618, 144–150 (2023). - PMC - PubMed
    1. Keskin, D. B. et al. Neoantigen vaccine generates intratumoral T cell responses in phase Ib glioblastoma trial. Nature565, 234–239 (2019). - PMC - PubMed
    1. Ott, P. A. et al. An immunogenic personal neoantigen vaccine for patients with melanoma. Nature547, 217–221 (2017). - PMC - PubMed
    1. Hu, Z. et al. Personal neoantigen vaccines induce persistent memory T cell responses and epitope spreading in patients with melanoma. Nat. Med.27, 515–525 (2021). - PMC - PubMed

Publication types

MeSH terms

Associated data