. 2025 Mar;639(8053):181-189.
doi: 10.1038/s41586-024-08506-6. Epub 2025 Feb 5.

Limited impact of Salmonella stress and persisters on antibiotic clearance

Affiliations

Limited impact of Salmonella stress and persisters on antibiotic clearance

Joseph Fanous et al. Nature. 2025 Mar.

Abstract

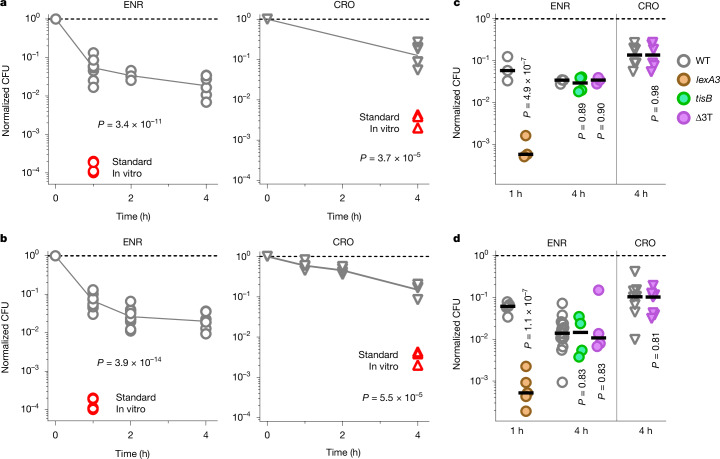
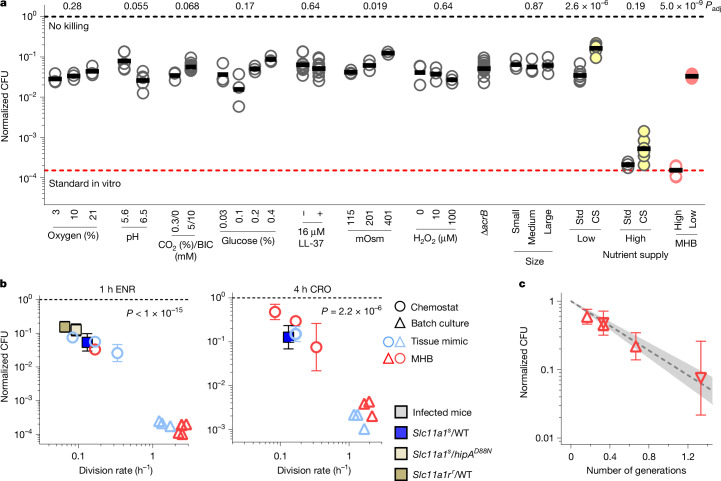
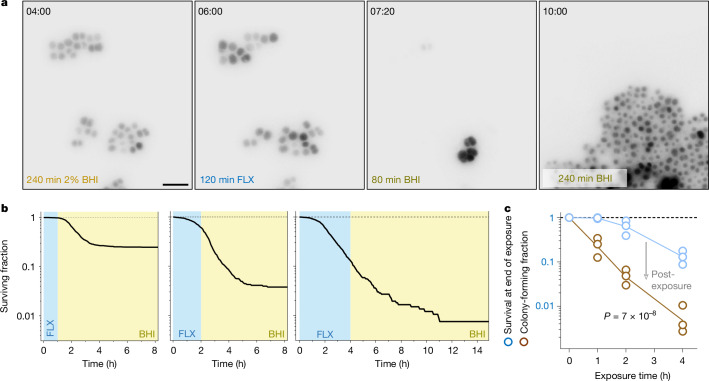
Antimicrobial compounds are essential for controlling bacterial infections. Stress-induced bacterial tolerance and persisters can undermine antimicrobial activities under laboratory conditions, but their quantitative effects under physiological conditions remain unclear1,2. Here we determined constraints on clearance of Salmonella by antimicrobials in infected mice and tissue-mimicking chemostats. The antibiotics enrofloxacin and ceftriaxone exhibited poor anti-Salmonella activity under both conditions, primarily owing to severe nutrient starvation, which restricted Salmonella replication3-5. Other infection-associated conditions, such as acidic pH, glucose, oxidative stress, nitrosative stress, antimicrobial peptides, osmolarity, oxygen limitation, carbon dioxide and carbonate, as well as drug efflux, toxin-antitoxin modules and cell size had limited effects. A subset of resilient Salmonella appeared as a key obstacle for clearance by enrofloxacin, based on the biphasic decline of Salmonella colony-forming units. However, these data were misleading, because colony formation was confounded by extensive post-exposure killing. More accurate single-cell, real-time assays showed uniformly slow damage, indicating high resilience across the entire Salmonella population. The resulting extensive survival of bulk bacteria minimized the effect of hyper-resilient persisters. Thus, starvation-induced general resilience of Salmonella was the main cause of poor antibiotic clearance. These findings highlight the importance of quantifying antibiotic activity with real-time, single-cell assays under physiological conditions.


Conflict of interest statement

Competing interests: The authors declare no competing interests.

Figures

Fig. 1
Fig. 1. Poor anti-Salmonella activities of enrofloxacin and ceftriaxone.
a, Salmonella survival in mouse spleen after an antibiotic dose (grey symbols show re-analysed data from ref. ; enrofloxacin (ENR): 1 h, n = 10; 2 h, n = 3; 4 h, n = 6; ceftriaxone (CRO), n = 6) or in Mueller–Hinton broth under normal atmosphere at 37 °C (red symbols (this study); enrofloxacin, n = 5; ceftriaxone, n = 3). Each symbol represents an individual mouse or an independent in vitro culture. Lines connect the geometric means. Two-tailed t-test of log-transformed data. b, Salmonella survival in tissue-mimicking chemostat cultures (grey symbols show re-analysed data from ref. ; enrofloxacin: 1 h and 2 h, n = 12; 4 h, n = 7; ceftriaxone 1 h, 2 h and 4 h, n = 4) or laboratory conditions (red symbols; number of samples as in a). Each symbol represents an individual chemostat reactor. Lines connect the geometric means. Two-tailed t-test of log-transformed data. c, Survival of wild-type (WT) and indicated mutant Salmonella in spleen. Each symbol represents an individual mouse (enrofloxacin: wild type and lexA3 1 h, n = 3; wild type 4 h, n = 3; tisB, n = 4; Δ3T, n = 3; ceftriaxone: wild type and Δ3T, n = 6). Horizontal bars represent geometric means. Enrofloxacin, one-way ANOVA of log-transformed data with comparisons to wild-type data and Holm–Šídák correction for multiple comparisons; ceftriaxone, two-tailed t-test of log-transformed data. d, Survival of wild-type and indicated mutant Salmonella in chemostat cultures. Each symbol represents an individual chemostat reactor (enrofloxacin: wild type and lexA3 1 h, n = 5; wild type 4 h, n = 16; tisB and Δ3T, n = 4; ceftriaxone: wild type, n = 8; Δ3T, n = 7). Horizontal bars represent geometric means (statistical tests as in c). Source data
Fig. 2
Fig. 2. Modulation of Salmonella killing by stresses and nutrient supply.
a, Salmonella survival after 1 h exposure to enrofloxacin in chemostat cultures with varying conditions. Each symbol represents an individual chemostat reactor. P values adjusted for multiple comparisons (Holm–Šídák) (two-tailed t-test on log-transformed data for pH; ANOVA on log-transformed data for glucose and osmolarity). BIC, bicarbonate; CS, combined stresses; MHB, Mueller–Hinton broth; Std, standard tissue-mimicking conditions. b, Survival of Salmonella in mice (squares, geometric mean ± geometric s.d.; enrofloxacin: Slc11a1s/WT, n = 10; Slc11a1s/hipAD88N, n = 4; Slc11a1r/WT, n = 8; ceftriaxone, n = 6), or in chemostats in tissue-mimicking medium (geometric mean ± geometric s.d.; enrofloxacin for division rates 0.083 h−1, 0.17 h−1 and 0.33 h−1, n = 10; ceftriaxone, n = 4), Mueller–Hinton broth (enrofloxacin or ceftriaxone for division rates 0.083 h−1, 0.17 h−1 and 0.33 h−1, n = 5) or in individual batch cultures (enrofloxacin: tissue-mimicking medium, n = 3; Mueller–Hinton broth, n = 5; ceftriaxone: tissue-mimicking medium and Mueller–Hinton broth, n = 3). One-way ANOVA with test for linear trend for log-transformed data for tissue-mimicking medium or Mueller–Hinton broth cultures. c, Relationship between exposure time to ceftriaxone to number of generations and Salmonella survival for different proliferation rates and exposure times (geometric mean and geometric s.d.; upward triangles, division rate 0.17 h−1 and exposure for 1 h (n = 4), 2 h (n = 4) or 4 h (n = 9); downward triangles, 4 h exposure and division rates 0.08 (n = 5) or 0.33 h−1 (n = 5)). The dashed line represents a monoexponential fit and the shaded area shows the 95% confidence interval. Source data
Fig. 3
Fig. 3. Salmonella DNA damage during and after exposure to enrofloxacin.
a, Time-lapse gallery of RecA foci in enrofloxacin-exposed Salmonella. Scale bar, 1 μm. b, Snapshots of Salmonella exposed for 1 h to enrofloxacin, followed by drug washout for 30 min and incubation in LB. Scale bar, 5 μm. c, Fraction of undamaged and regrowing cells during 1 h (top), 2 h (middle) or 4 h (bottom) enrofloxacin exposure, washout and LB incubation (250 (top), 255 (middle) and 250 (bottom) cells; dotted lines show monoexponential fits for damage during exposure and washout; summary data and independent replicates in d,g). d, Fractions of undamaged cells at the end of enrofloxacin exposure, in LB, and regrowing survivors (two independent experiments, 755 and 1,233 cells). e, Snapshots of Salmonella exposed for 7 h to decreasing concentrations of enrofloxacin, followed by drug-free nutrient-poor medium (Supplementary Video 3). Scale bar, 5 μm. f, Fraction of undamaged and regrowing cells during and after 7 h exposure to decreasing concentrations of enrofloxacin (ENR) in nutrient-poor medium (276 cells; dotted lines show monoexponential fits for damage during exposure, post-antibiotic damage or baseline damage; summary data for this and two independent replicates in g). g, Fractions of regrowing cells after 4 h enrofloxacin exposure and a switch to LB (4 h/LB; 250 and 444 cells; same data as in d) or under in vivo-mimicking conditions (IVM) with declining enrofloxacin concentrations and regrowth in nutrient-poor medium (276, 271 and 378 cells). Circles represent independent experiments. Two-tailed t-test on log-transformed data. h, Fluorescence of Salmonella/pPcad-gfp or Salmonella lexA3/pPcad-gfp in untreated (0 h) or enrofloxacin-treated mice. The vertical line separates GFP+ responders from GFP non-responders. The inset shows the median fluorescence (MFI) of GFP+ cells, the line connects the geometric means (test for non-zero slope in a linear regression of log-transformed values). The histograms represent pooled data, circles in the inset graph represent individual mice (1 h, n = 5; 3 h and 4 h, n = 4). i, Blue, fraction of GFP non-responders in enrofloxacin-treated mice (0 h, n = 2; 1 h, n = 6; 2 h and 4 h, n = 4). Each symbol represents an individual mouse. Brown, CFUs recovered from similar samples (same data as in Fig. 1a; geometric mean ± geometric s.d.; 1 h, n = 10; 2 h, n = 3; 4 h, n = 6). Two-way ANOVA for difference between SOS response and CFU recovery. j, Contribution of responders (SOS+) and non-responders (SOS) to CFU counts (Supplementary Note 5; data are mean ± s.d. for data from independently infected mice; 1 h, n = 6; 4 h, n = 4). Two-way ANOVA for difference between SOS+ and SOS. Source data
Fig. 4
Fig. 4. Killing of S. aureus by flucloxacillin.
a, Snapshots of gfp-expressing S. aureus (inverted fluorescence) before, during and after a 2 h exposure to flucloxacillin (FLX) and switching to antibiotic-free brain–heart infusion (BHI) medium (Supplementary Video 4). Scale bar, 5 μm. b, Surviving fractions of S. aureus after 1 h (left), 2 h (middle) or 4 h (right) exposure to flucloxacillin followed by switching to BHI medium (937, 745 and 599 cells pooled from three independent experiments). A growing colony originating from a single cell is counted as one survivor. Summary data for individual replicates are shown in c. c, Surviving fractions of S. aureus after 1 h, 2 h or 4 h exposure to flucloxacillin and after switching to antibiotic-free BHI medium. Data from three independent experiments (619, 745 and 917 cells). Lines connect the geometric means. Two-way ANOVA for difference between survival at the end of exposure and colony-forming fractions. The arrow depicts the post-exposure loss of viability. Source data
Extended Data Fig. 1
Extended Data Fig. 1. Analysis of Salmonella in vitro.
(a) Sorting of Salmonella cells with different sizes. Salmonella expressing gfp under control of the chromosomal PsifB promoter showed correlated sideward-scatter (a proxy for size) and green fluorescence signals. The combination of the two detection channels increased resolution and enabled enrichment of subsets by flow cytometric sorting using the gate boundaries shown as dashed red lines. (b) Growth curves in lysogeny broth in 96-well plates. Means and SDs for 4 (wild-type, WT), 5 (hipAD88N), or 6 (shpBQ97*) biological replicates (each measured in technical triplicates) are shown (OD600, optical density at 600 nm; Det. Lim., detection limit). (c) Division rate distributions of Salmonella strains in different mouse genotypes (data for wild-type Salmonella in SLC11A1r mice from, n = 61,137 cells from seven independently infected mice; SLC11A1s, WT n = 34,851 from three independently infected mice; SLC11A1s, hipAD88N n = 832 from three independently infected mice). The inset shows medians for the individual mice (SLC11A1s WT/hipAD88N n = 3; SLC11A1r, WT n = 7; ANOVA with comparison against SLC11A1s, WT; P-values adjusted for multiple comparisons according to Holm-Šídák). (d) Survival of Salmonella strains in mouse spleen 1 h after administration of 0.1 mg enrofloxacin. Each circle represents an individual mouse (SLC11A1s: WT n = 10; hipAD88N n = 4; SLC11A1r, WT n = 7) two-tailed t-test, P-values adjusted for multiple comparisons according to Holm-Šídák). (e) Analysis of Salmonella/pRecA-mCherry fluorescence images. Detection of RecA-mCherry foci was enhanced by 2D Laplacian of Gaussian filtering (approximating a second derivative) of red fluorescence and false-color visualization. (f) Fraction of cells with no long-lasting RecA focus (“undamaged fraction”) during growth without enrofloxacin (Control, 146 cells), or exposure from t = 0 h to 1.5 or 5 mg/L enrofloxacin (130, 250 cells). The dotted lines represent monoexponential fits. The data for 5 mg/L are also shown in Fig. 3c. Summary data for the 5 mg/L exposure and an independent replicate are shown in Fig. 3d. (g) Flow-cytometry analysis of sideward scatter as a read-out for cell size of Salmonella before and after 1 h exposure to enrofloxacin during exponential growth in lysogeny broth (LB), slow growth in tissue-mimicking chemostats, or in mouse spleen. Each symbol represents an independent culture or an individual mouse (LB +/− n = 3; Chemostat +/− n = 5; Mouse spleen +/− n = 3; two-tailed t-test of log-transformed data with Holm-Šídák correction for multiple comparisons). (h) Snap-shots of Salmonella growing in nutrient-poor minimal medium (MM) without enrofloxacin and then in lysogeny broth (LB; video S1). (i) Fraction of undamaged cells before and after switching to LB, and dividing Salmonella after the LB switch (146 cells; LoD, limit of detection). RecA foci during the first 4 h are also shown in panel f (‘Control’). The dotted line is a monoexponential fit for damage before the LB switch. (j) Time difference between detection of a DNA double-strand bread (DSB) based on a long-lasting RecA focus, and re-initiation of cell division. Control cells without enrofloxacin exposure that were switched to lysogeny broth (No ENR/LB: DSB- n = 40; DSB+ n = 69), cells exposed for 1 h to enrofloxacin followed by a switch to LB (1 h/LB n = 35), and cells exposed to declining concentrations of enrofloxacin over 7 h followed by continuing incubation in nutrient-poor medium (‘in vivo-mimicking’, IVM n = 115) are shown. Each circle represents an individual cell. The statistical difference between groups was test using the Kruskal-Wallis-test with Dunn’s correction for multiple testing. Source data
Extended Data Fig. 2
Extended Data Fig. 2. Salmonella analysis in vivo.
(a) Traditional model and actual mechanism underlying rapid loss of colony-forming units. In the traditional models, a small subset of persisters, some of which are triggered by stresses, survive antibiotic exposure and give rise to colonies on plates. However, antibiotic exposure actually kills only few cells, but survivors are poisoned by drug, which remains bound to its target (depicted as yellow symbols). Most of these poisoned cells die after plating. Thus, colony counts reflect mostly post-exposure killing rather than viability loss during exposure. (b) Plasmid map of the SOS-reporter construct. The Pcad promoter is repressed by LexA. LexA self-cleavage (SOS-response) is associated with unbinding of LexA to DNA, de-repressing Pcad. gfp-ova encodes a destabilized GFP variant to report current promoter activities. aphA encodes aminoglycoside phosphotransferase conferring resistance to kanamycin. repA encodes RepA which replicates plasmids with a oriSC101 origin (T, terminator). (c) Gating strategy for identifying Salmonella reporter cells in spleen homogenates based on the red fluorescence of chromosomally encoded mCherry (Ex, excitation wavelength; Em, emission range). mCherry-Salmonella were then analyzed for green fluorescence as shown in Fig. 3h. (d) Green fluorescence of Salmonella retrieved from mouse spleen 4 h after enrofloxacin administration and incubated for 3 h in lysogeny broth (LB). Control Salmonella without gfp are also shown. The data represent histograms pooled from 2 mice. (e) Colony recovery of GFP (SOS) and GFP+ (SOS+) Salmonella sorted from spleen homogenates from untreated mice (0 h), or from treated mice 1 h or 4 h after enrofloxacin administration. Survival was determined by plating on lysogeny-broth plates. Each circle represents an individual mouse (untreated n = 14; 1 h GFP +/− n = 6; 4 h GFP +/− n = 4). The statistical difference of GFP- and GFP+ contributions from treated mice was tested by two-way ANOVA (column factor, two-tailed, single comparison). (f) Survival of Salmonella strains in enrofloxacin-treated mice (hisGP69L: 1 h n = 10; 4 h n = 6; hisGP69L shpBQ97* 1 h/4 h n = 3; geometric means and geometric SDs; two-way ANOVA of log-transformed data). (g) Survival of Salmonella strains in lysogeny broth with enrofloxacin (geometric means and geometric SDs; six independent cultures from two different experiments; two-way ANOVA of log-transformed data). Source data

References

    1. Bjarnsholt, T. et al. The importance of understanding the infectious microenvironment. Lancet Infect. Dis.22, e88–e92 (2022). - PMC - PubMed
    1. Balaban, N. Q. et al. Definitions and guidelines for research on antibiotic persistence. Nat. Rev. Microbiol.17, 441–448 (2019). - PMC - PubMed
    1. Claudi, B. et al. Phenotypic variation of Salmonella in host tissues delays eradication by antimicrobial chemotherapy. Cell158, 722–733 (2014). - PubMed
    1. Cunrath, O. & Bumann, D. Host resistance factor SLC11A1 restricts Salmonella growth through magnesium deprivation. Science366, 995–999 (2019). - PubMed
    1. Steeb, B. et al. Parallel exploitation of diverse host nutrients enhances Salmonella virulence. PLoS Pathog.9, e1003301 (2013). - PMC - PubMed

MeSH terms

LinkOut - more resources