. 2025 Feb;638(8050):401-410.
doi: 10.1038/s41586-024-08401-0. Epub 2025 Feb 5.

H-bonded organic frameworks as ultrasound-programmable delivery platform

Affiliations

H-bonded organic frameworks as ultrasound-programmable delivery platform

Wenliang Wang et al. Nature. 2025 Feb.

Abstract

The precise control of mechanochemical activation within deep tissues using non-invasive ultrasound holds profound implications for advancing our understanding of fundamental biomedical sciences and revolutionizing disease treatments1-4. However, a theory-guided mechanoresponsive materials system with well-defined ultrasound activation has yet to be explored5,6. Here we present the concept of using porous hydrogen-bonded organic frameworks (HOFs) as toolkits for focused ultrasound (FUS) programmably triggered drug activation to control specific cellular events in the deep brain, through on-demand scission of the supramolecular interactions. A theoretical model is developed to potentially visualize the mechanochemical scission and ultrasound mechanics, providing valuable guidelines for the rational design of mechanoresponsive materials to achieve programmable control. To demonstrate the practicality of this approach, we encapsulate the designer drug clozapine N-oxide (CNO) into the optimal HOF nanocrystals for FUS-gated release to activate engineered G-protein-coupled receptors in the ventral tegmental area (VTA) of mice and rats and hence achieve targeted neural circuit modulation even at depth 9 mm with a latency of seconds. This work demonstrates the capability of ultrasound to precisely control molecular interactions and develops ultrasound-programmable HOFs to non-invasively and spatiotemporally control cellular events, thereby facilitating the establishment of precise molecular therapeutic possibilities.


Conflict of interest statement

Competing interests: H.W., W.W., Y.S. and B.C. declare that a patent application (PCT/US2024/042314) relating to this work has been filed. The other authors declare no competing interests.

Figures

Extended Data Fig. 1 |
Extended Data Fig. 1 |. Morphology, size and crystal structure of all four different HOF nanocrystals that were characterized.
ad, TEM images and hydrodynamic size distribution measured by DLS of HOF-TATB nanocrystals (a), HOF-BTB nanocrystals (b), HOF-101 nanocrystals (c) and HOF-102 nanocrystals (d). eh, The X-ray diffraction tests of HOF nanocrystals: HOF-TATB (e), HOF-BTB (f), HOF-101 (g), HOF-102 (h). n = 3 independent experiments for each sample.
Extended Data Fig. 2 |
Extended Data Fig. 2 |. Topology analysis of HOF-TATB.
a, Structures of two different hydrogen-bonding motifs and their simplified forms. b, 3D structure of the interpenetrated network in HOF-TATB and its simplified 3,4-connected topology viewed from the c axis. c, Perspective view of a simplified single net. d,e, Calculated pore surface of 1D pore channel of HOF-TATB: view along a axis (d); view along b axis (e). (Connolly surface with pore radius of 1.2 Å). fh, Crystal structure scheme of HOF-TATB: view along a axis (f); view along b axis (g); view along c axis (h).
Extended Data Fig. 3 |
Extended Data Fig. 3 |. Porosity characterization of the four different nanocrystals.
a, Single-component sorption isotherms of nitrogen at 77 K of HOF-TATB, indicating the framework flexibility. b, Single-component sorption isotherms of CO2 at 195 K of HOF-BTB (no nitrogen adsorption is observed at 77 K), indicating framework flexibility. c, Single-component sorption isotherms of nitrogen at 77 K of HOF-101. d, Single-component sorption isotherms of nitrogen at 77 K of HOF-102. n = 3 independent experiments for each sample.
Extended Data Fig. 4 |
Extended Data Fig. 4 |. Thermal dissociation tests of HOF nanocrystals.
a, HOF-TATB, b, HOF-BTB, c, HOF-101, d, HOF-102. The HOF nanocrystals were incubated at different temperatures for 5 min. After that, the HOFs solution was extracted and centrifuged and the supernatant was used to perform UV-Vis tests for HOFs dissociation determination. The thermal dissociation occurred around 60 °C. Only around a 2% increase was observed at HOF-TATB and HOF-BTB and no thermal dissociation was observed in HOF-101 and HOF-102, at temperature 100 °C. Mean ± s.e.m., n = 3 independent experiments for each sample.
Extended Data Fig. 5 |
Extended Data Fig. 5 |. Theoretical modelling of mechanochemical scission in HOFs.
a, A linear model fits the relationship between the ultrasound peak pressure and the ln(k) of HOFs when the peak pressure is less than 1.55 MPa; n = 3 independent experiments for each sample. b, A linear model fits the relationship between the ultrasound peak pressure and the ln(k) of HOFs when the peak pressure is up to 1.55 MPa. n = 3 independent experiments for each sample. c, A linear model qualitatively fits the relationship between the Ecohesive of HOFs and the ln(k) at fixed EUS. With 1.72, 3.94, 6.49 and 8.04 MPa peak pressure, ln(k) of HOF-TATB, HOF-BTB, HOF-101 and HOF-102 correlate to their cohesion energy linearly, respectively. n = 3 independent experiments for each sample. d, When ln(k) is held constant, a linear correlation is observed between the ultrasound peak pressure and the cohesive energy of HOFs. To achieve a targeted 10%, 20%, 30%, 40%, 50% and 60% dissociation of HOFs at a fixed ultrasound peak pressure, it is possible to calculate the corresponding Ecohesive of HOFs using the established linear relationship.
Extended Data Fig. 6 |
Extended Data Fig. 6 |. Ultrasound-triggered drug release from different HOF nanocrystals.
a, HOF-TATB. b, HOF-BTB. c, HOF-101. d, HOF-102. The fluorescence dye RB was first loaded into the HOF nanocrystals. After that, the ultrasound irradiated the RB-loaded nanocrystals with different power densities. At fixed time points, the solution was taken out and centrifuged. The released RB concentration was determined through UV-Vis from the supernatant. Mean ± s.e.m., n = 3 independent experiments for each sample. eh, Ultrasound-triggered drug release from HOF-TATB. The fluorescence dye RB was first loaded into the HOF-TATB nanocrystals (TATB@RB). After that, the TATB@RB nanocrystals were irradiated by the ultrasound with different power densities, including 0.51 MPa (e), 0.89 MPa (f) and 1.08 MPa (g), and the quantification of drug release percentage without ultrasound and with ultrasound for 90 s (h). Mean ± s.e.m., n ≥ 3 independent samples. One-way ANOVA and Dunnett’s multiple comparison tests (P ≥ 0.05 (ns), *0.01 ≤ P < 0.05, **0.001 ≤ P < 0.01, ****P < 0.0001). Mean ± s.e.m., n = 3 independent experiments for each sample.
Extended Data Fig. 7 |
Extended Data Fig. 7 |. Ultrasound-triggered release of various drugs.
a, Deschloroclozapine. b, Dopamine. c, Procaine. d, CNO from HOF-TATB at 1.5 MHz, 1.55 MPa (mean ± s.e.m., n = 3 independent samples).
Extended Data Fig. 8 |
Extended Data Fig. 8 |. Biosafety and biocompatibility evaluation of UltraHOF.
a, The cell viability tests of HOF-TATB nanocrystals in human embryonic kidney 293 (HEK-293T) cells. Mean ± s.e.m.; at least three independent tests (n = 5). The hemolysis tests of HOF-TATB nanocrystals: photograph (b) and hemolysis statistical analysis (c); mean ± s.e.m.; at least three independent tests (n ≥ 3). d, In vivo biosafety evaluation by haematoxylin and eosin staining after sono-chemogenetics. Scale bar, 100 μm. n = 3 independent experiments for each sample. e, In vivo biocompatibility evaluation of the sono-chemogenetics by means of determining microglia (Iba1) activation. Statistical analysis of the Iba1 intensity. Mean ± s.e.m., n ≥ 3 mice in each group. Two-way ANOVA and Tukey’s multiple comparison tests. f, In vivo biocompatibility evaluation of the sono-chemogenetics by means of determining neuron apoptosis (caspase-3). Statistical analysis of the caspase-3 intensity. Mean ± s.e.m., n ≥ 3 mice in each group. Two-way ANOVA and Tukey’s multiple comparison tests. g, In vivo biocompatibility evaluation of the sono-chemogenetics by determining astrocytes (GFAP) activation. Mean ± s.e.m., n ≥ 3 mice in each group. Two-way ANOVA and Tukey’s multiple comparison tests. Statistical significance: P ≥ 0.05 (ns).
Extended Data Fig. 9 |
Extended Data Fig. 9 |. Ultrasound power delivery in the tissue and biosafety evaluation.
a, To measure ultrasound power transfer efficiency through tissue, pork skin of varying depths was placed on a 1.5-MHz, 2.40-MPa FUS transducer. The results showed that 1.5-MHz ultrasound could penetrate up to 20 mm, with a power transfer efficiency of 37% at 10 mm depth; mean ± s.e.m.; n = 3. b, The in vivo ultrasound power transfer in the mouse head with FUS focus length of 5 mm. The ultrasound peak pressure heat map in the mouse head shows that around 0.90 MPa was delivered to the mouse VTA when 1.40 MPa primary ultrasound peak pressure was used. c, Ultrasound-induced blood-brain barrier opening evaluation through Evans blue staining. (i) Brains from mice injected with microbubbles and given 20 s ultrasound at 1.0 MPa (left) and 0.75 MPa (right). (ii) Brains from mice without microbubbles given 20 s ultrasound at 1.0 MPa. (iii) Brains from mice without microbubbles given 20 s ultrasound at 1.5 MPa. Red circles show ultrasound-treated areas. d, The evaluation of ultrasound-induced thermal effects at the focus. Real-time temperature detection was conducted at the mice VTA during FUS stimulation (1.5 MHz, 1.55 MPa, duration 20 s). No substantial temperature changes were observed during the initial 10 s of ultrasound exposure, with only a slight increase of approximately 1.25 °C detected after the 20 s stimulus. Mean ± s.e.m., n = 3 independent experiments for each sample. e, The in vivo ultrasound power transfer in rat heads with FUS focus length of 10 mm. The ultrasound peak pressure heat map in the rat head shows that around 1.19–1.39 MPa was delivered to the rat VTA when 2.45 MPa primary ultrasound peak pressure was used.
Fig. 1 |
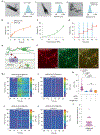
Fig. 1 |. Ultrasound mechanically responsive HOFs preparation.
a, Schematic illustration of the ultrasound mechanical stress triggered dissociation of HOFs, in which the HOFs were stable in solution but disassociated when triggered by the ultrasound power (EUS) exceeding the HOFs scission threshold (EUS > Ethreshold). b, Four representative organic monomers and the self-assembled porous HOF structures: HOF-TATB, HOF-BTB, HOF-101 and HOF-102. The OMBUs of HOFs self-assemble through hydrogen bonding and π–π stacking interactions, resulting in the formation of 3D porous frameworks.
Fig. 2 |
Fig. 2 |. Ultrasound mechanically controlled dissociation of HOFs in an aqueous solution.
ad, Ultrasound mechanically triggers the time-resolved dissociation curve of different HOFs (mean ± s.e.m., n = 3 independent experiments for each sample) at various peak pressures, including HOF-TATB (a), HOF-BTB (b), HOF-101 (c) and HOF-102 (d). e, Cohesive energy of different HOFs, including their hydrogen-bonding interactions and π–π stacking interactions in each unit. HOFs were constructed from organic building units through intermolecular non-covalent hydrogen-bonding interactions and π–π stacking interactions, for which the bonding energy of one unit was denoted as the cohesive energy of HOFs. Moreover, the HOFs showed varying ultrasound thresholds for dissociation, which were associated with the characteristics of the organic building units. f, The prediction heat map of ultrasound-controlled dissociation of HOFs. By referring to the provided heat map, we can determine the optimal cohesive energy needed to attain a dissociation percentage at a specific ultrasound power. This will guide the structural design of HOFs at the molecular level to achieve the cohesive energy required for subsequent programmable control of HOFs dissociation at certain ultrasound peak pressures. g, The free dye release from HOF nanocrystals without ultrasound stimulation (mean ± s.e.m., n ≥ 3 independent experiments for each sample). h, Schematic of ultrasound-triggered drug release from HOF nanocrystals, with drug release occurring when EUS > Ethreshold. i, Ultrasound-triggered dye release from HOF nanocrystals after 90 s of stimulus (mean ± s.e.m., n ≥ 3 independent experiments for each sample). The HOF nanocrystals exhibited distinct ultrasound thresholds for drug activation, with the order of sensitivity being HOF-TATB@RB (0.51 MPa) < HOF-BTB@RB (1.55 MPa) < HOF-101@RB (3.94 MPa) < HOF-102@RB (8.04 MPa).
Fig. 3 |
Fig. 3 |. Ultrasound-controlled cargo release from HOF-TATB nanocrystals and their in vitro modulation of neural activity.
a, TEM images and hydrodynamic size distribution measured by DLS of the HOF-TATB nanocrystals: (1) before loading of CNO, (2) after loading CNO and (3) after irradiating by ultrasound (1.5 MHz, 1.55 MPa, 60 s). Scale bars, 200 nm. n = 3 per group. b, Ultrasound-triggered dye release (mean ± s.e.m., n = 3 independent samples) from HOF-TATB at 1.5 MHz, 1.55 MPa. c, Ultrasound-triggered dye release (mean ± s.e.m., n = 3 independent samples) from HOF-TATB after 60 s irradiation (1.5 MHz) at different peak pressures. d, Repeated ultrasound-triggered drug release. The blue areas indicate ultrasound stimulus (1.5 MHz, 1.55 MPa, pulse 10 s). Mean ± s.e.m., n ≥ 3 independent tests. e, Ultrasound-triggered CNO release from the HOF-TATB nanocrystals for hM3D(Gq) expressing neuron activation. f, Fluorescence images of the primary cortical neurons expressing hSyn::hM3D(Gq)-mCherry and hSyn::GCaMP6s-WPRE-SV40. Scale bars, 40 μm. n = 3 per group. g, Heat maps of normalized GCaMP6s fluorescence intensity from 100 neurons in different experimental conditions (n = 100 neurons examined over three independent experiments for each group), including (1) hM3D(+)/FUS(+)/TATB@CNO(+), (2) hM3D(+)/FUS(+)/TATB@CNO(−), (3) hM3D(−)/FUS(+)/TATB@CNO(+) and (4) hM3D(+)/FUS(−)/TATB@CNO(+). OFF = ultrasound off; ON = ultrasound on (1.5 MHz, 1.08 MPa, 10 s pulse). h, Statistical analysis of calcium signal changes in 100 primary neurons under the different conditions (n = 100 neurons examined over three independent experiments for each group). Mean ± s.e.m. Two-way ANOVA and Tukey’s tests (P ≥ 0.05 (ns), ****P < 0.0001). i, Normalized in vitro neuron spiking latency under sono-chemogenetics stimulation. n = 100 neurons examined over three independent experiments for each group. Mean ± s.e.m.
Fig. 4 |
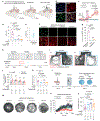
Fig. 4 |. In vivo sono-chemogenetic deep brain stimulation in mice.
a, Experimental scheme of the in vivo fibre photometry in the VTA. b, Confocal images showing co-expression of hM3D(Gq) and GCaMP6s in the VTA. Scale bars, 20 μm. n = 3 per group. c, Normalized GCaMP6s fluorescence change (ΔF/F0) in mice VTA under different conditions; FUS: 1.5 MHz, 1.40 MPa, pulse 10 s; one-way ANOVA and Tukey’s tests. d, Statistical analysis of calcium signal changes in c; two-way ANOVA and Tukey’s tests. Mean ± s.e.m., n = 5 (+++), n = 5 (++−), n = 3 (−++), n = 5 (+−+). e, Normalized in vivo neuron spiking latency (3.5 s) in mice VTA under sono-chemogenetics. Mean ± s.e.m., n = 5. f, c-fos expression in the VTA after different treatments (FUS: 1.5 MHz, 1.40 MPa, pulse 20 s, focus 5 mm). Scale bars, 20 μm. n = 3 per group. g, Quantification of c-fos expression in hM3D(Gq)+ neurons. Mean ± s.e.m., n = 3 per condition. Two-way ANOVA and Tukey’s tests. h, Scheme of CPP tests. i, Traces of mouse exploration in CPP apparatus (1) before and (2) after sono-chemogenetics. j, Time spent in the FUS stimulation chamber; paired t-tests and two-sided comparison test. k, CPP preference score; two-way ANOVA and Tukey’s tests. Mean ± s.e.m., n = 9 (+++), n = 8 (++−), n = 8 (−++) and n = 7 (+−+). l, Scheme of FST with sono-chemogenetics. m, Representative traces of mice in FST with sono-chemogenetics. n, Time-resolved mouse immobility curve in FST. o, Statistical analysis of immobility time in FST; mean ± s.e.m., n = 12 (+++), n = 10 (++−), n = 9 (−++), n = 11 (+−+); two-way ANOVA and Tukey’s tests. Statistical significance: P ≥ 0.05 (ns), *0.01 ≤ P < 0.05, **0.001 ≤ P < 0.01, ***0.0001 ≤ P < 0.001, ****P < 0.0001.
Fig. 5 |
Fig. 5 |. In vivo sono-chemogenetic deep brain stimulation in rats.
a, Experimental scheme of the in vivo fibre photometry in rat VTA. b, Confocal images of the co-expression of hM3D(Gq) and GCaMP6s in rat VTA. Scale bars, 20 μm; n = 3 independent experiments for each group. c, Normalized GCaMP6s fluorescence change (ΔF/F0) in rat VTA under the different experiment conditions. The pink area represents the FUS irradiation (1.5 MHz, 2.45 MPa, pulse 20 s, focus length 9 mm); solid line, mean; shaded area, s.e.m.; n = 3 (+++), n = 3 (++−), n = 3 (−++), n = 3 (+−+); one-way ANOVA and Tukey’s tests. d, Statistical analysis of calcium signal changes in the rat VTA region under the different conditions. Mean ± s.e.m.; n = 3 (+++), n = 3 (++−), n = 3 (−++), n = 3 (+−+); two-way ANOVA and Tukey’s tests. e, Normalized in vivo neuron spiking latency (8.8 s) in rat VTA under sono-chemogenetics stimulation; mean ± s.e.m.; n = 5 represents five independent tests in three rats. f, c-fos expression in VTA after the rat is treated with different conditions. Scale bars, 20 μm; n = 3 per group. g, Quantification of the c-fos expression percentage among the hM3D(Gq)+ neurons; mean ± s.e.m., n = 3 per group; two-way ANOVA and Tukey’s tests. h, Rat CPP tests. (1) Scheme of CPP tests with sono-chemogenetics. Traces of mouse freely exploring apparatus (2) before and (3) after sono-chemogenetic stimulation. i, Statistical analysis of time spent in the FUS stimulation chamber; mean ± s.e.m., n = 7 (+++), n = 6 (++−), n = 6 (−++), n = 8 (+−+); paired t-tests and two-sided comparison. j, Preference score of rats at different conditions; mean ± s.e.m., n = 7 (+++), n = 6 (++−), n = 6 (−++), n = 8 (+−+); two-way ANOVA and Tukey’s tests. Statistical significance: P ≥ 0.05 (ns), *0.01 ≤ P < 0.05, **0.001 ≤ P < 0.01, ***0.0001 ≤ P < 0.001, ****P < 0.0001.

References

    1. Huo S et al. Mechanochemical bond scission for the activation of drugs. Nat. Chem 13, 131–139 (2021). - PubMed
    1. Chen L, Nixon R & De Bo G Force-controlled release of small molecules with a rotaxane actuator. Nature 628, 320–325 (2024). - PMC - PubMed
    1. Rwei AY et al. Ultrasound-triggered local anaesthesia. Nat. Biomed. Eng 1, 644–653 (2017). - PMC - PubMed
    1. Wang JB, Aryal M, Zhong Q, Vyas DB & Airan RD Noninvasive ultrasonic drug uncaging maps whole-brain functional networks. Neuron 100, 728–738.e7 (2018). - PMC - PubMed
    1. Boulatov R The liberating force of ultrasound. Nat. Chem 13, 112–114 (2021). - PubMed

LinkOut - more resources