. 2025 Mar;22(3):243-259.
doi: 10.1038/s41423-025-01257-y. Epub 2025 Feb 5.

Peroxisome proliferator-activated receptor alpha is an essential factor in enhanced macrophage immune function induced by angiotensin-converting enzyme

Affiliations

Peroxisome proliferator-activated receptor alpha is an essential factor in enhanced macrophage immune function induced by angiotensin-converting enzyme

Suguru Saito et al. Cell Mol Immunol. 2025 Mar.

Abstract

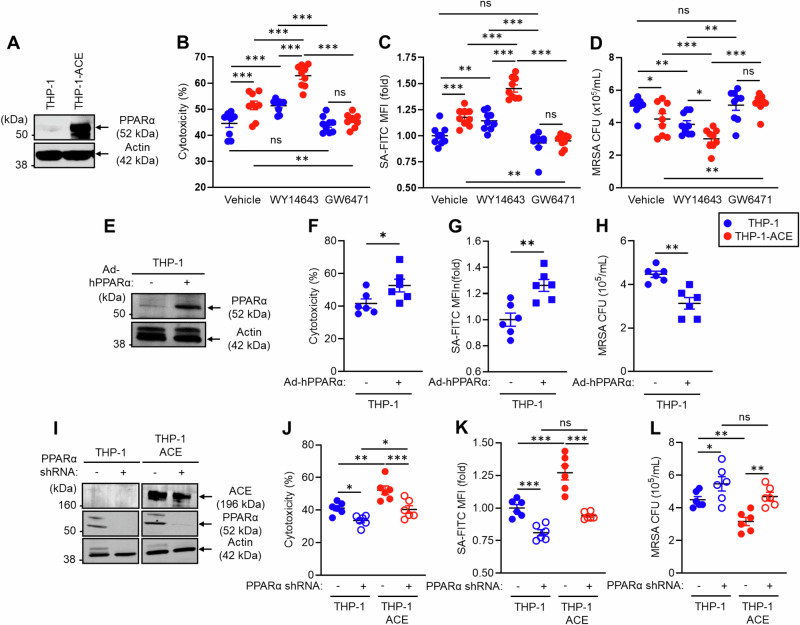
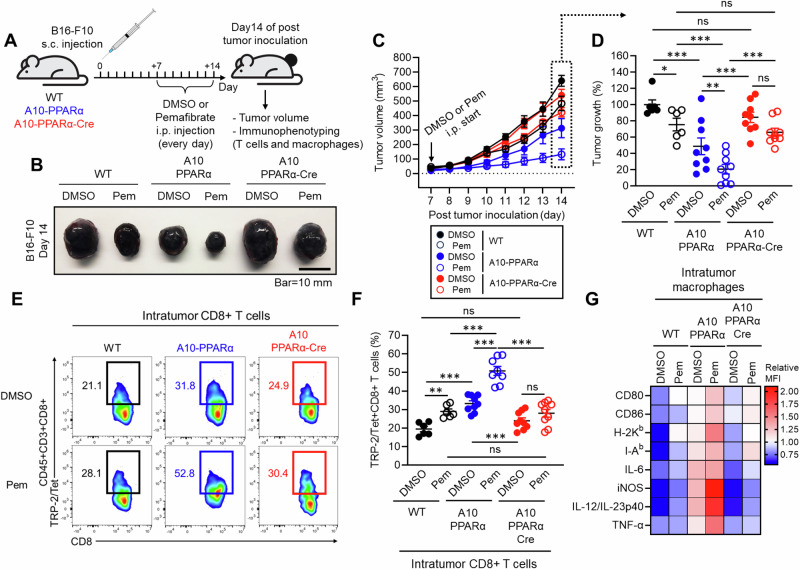
Increased expression of angiotensin-converting enzyme (ACE) by myeloid lineage cells strongly increases the immune activity of these cells, as observed in ACE10/10 mice, which exhibit a marked increase in antitumor and antibactericidal immunity. We report that peroxisome proliferator-activated receptor alpha (PPARα), a transcription factor that regulates genes critical for lipid metabolism, is a key molecule in the enhanced macrophage function induced by ACE. Here, we used a Cre-LoxP approach with LysM-Cre to create a modified ACE10/10 mouse line in which macrophages continue to generate abundant ACE but in which monocyte and macrophage PPARα expression is selectively suppressed. These mice, termed A10-PPARα-Cre, have significantly increased growth of B16-F10 tumors compared with ACE10/10 mice with Cre expression. PPARα depletion impaired cytokine production and antigen-presenting activity in ACE-expressing macrophages, resulting in reduced tumor antigen-specific CD8+ T-cell generation. Additionally, the elevated bactericidal resistance typical of ACE10/10 mice was significantly reduced in A10-PPARα-Cre mice, such that these mice resembled WT mice in their resistance to methicillin-resistant Staphylococcus aureus (MRSA) infection. THP-1 cells expressing increased ACE (termed THP-1-ACE) constitute a human macrophage model with increased PPARα that shows enhanced cytotoxicity against tumor cells and better phagocytosis and killing of MRSA. RNA silencing of PPARα in THP-1-ACE cells reduced both tumor cell death and bacterial phagocytosis and clearance. In contrast, the in vivo administration of pemafibrate, a specific agonist of PPARα, to WT and A10-PPARα-Cre mice reduced B16-F10 tumor growth by 24.5% and 25.8%, respectively, but pemafibrate reduced tumors by 57.8% in ACE10/10 mice. With pemafibrate, the number of antitumor CD8+ T cells was significantly lower in A10-PPARα-Cre mice than in ACE10/10 mice. We conclude that PPARα is important in the immune system of myeloid cells, including wild-type cells, and that its increased expression by ACE-expressing macrophages in ACE10/10 mice is indispensable for ACE-dependent functional upregulation of macrophages in both mice and human cells.

Keywords: Angiotensin-converting enzyme; Antitumor immunity; Bacterial clearance.; Macrophages; PPARα.


Conflict of interest statement

Competing interests: The authors declare no competing interests.

Figures

Fig. 1
Fig. 1
Genetic design of macrophage-specific PPARα deletion in ACE10/10 mice. A A10-PPRAα mice are ACE10/10 mice in which exon 4 of both PPARα genes is floxed (see “Methods” section). This construct was crossed with LysM-Cre mice to obtain A10-PPRAα-Cre mice (conditional KO), in which cre recombinase, expressed by macrophages and monocytes, excises PPARα exon 4, functionally eliminating this protein. To measure the depletion of exon 4, PCR was performed by using the primers Lf and Er (Supplementary Table 1). B Representative gel images of the WT, A10-PPARα, and A10-PPRAα-Cre mice generated by genotyping PCR. C PPARα expression in thioglycolate-elicited peritoneal macrophages (TPMs) and hepatocytes was measured by Western blotting. D, E Representative histogram (D) and MFI values (fold change) (E) of PPARα expression in TPMs measured by flow cytometry. FH Representative histogram (F) and PPARα MFI values (fold change) in the spleen (G) and liver (H) resident macrophages measured by flow cytometry. The cumulative data are shown as the mean ± SEM values of six samples from two independent experiments. All MFI values are represented as fold changes (the average value of WT was used for a value equal to 1). One-way ANOVA was used to analyze the significance of the data. *p < 0.05 and **p < 0.001; ns not significant
Fig. 2
Fig. 2
PPARα depletion alters the expression of lipid metabolism- and immune response-associated genes in macrophages. Total RNA was isolated from thioglycolate-elicited peritoneal macrophages of WT, A10-PPARα, or A10-PPARα-Cre mice (n = 3 in each) and subjected to bulk RNA sequencing. As shown in (B), some of these macrophages were incubated with vehicle (ethanol) or OA (200 µM) at 37 °C for 36 h before total RNA isolation. The TPM values obtained from RNA sequencing were used for the analyses via conversion to log2(TPM + 1) values. A Lipid metabolism-associated pathways were determined by Ingenuity Pathway Analysis (IPA) using genes identified as having significant expression changes (p < 0.05) in either of the two independent comparisons: A10-PPARα-Cre vs. WT and A10-PPARα-Cre vs. WT. The Rich Raito of each pathway was also calculated via IPA. The figure shows identified pathways in which the Rich ratio for A10-PPARα-Cre vs. WT is either greater than 1.2-fold or less than 0.8-fold greater than that of A10-PPARα-Cre vs. WT. Additionally, pathways with a Rich ratio of 0 for A10-PPARα-Cre vs. WT are also shown. Individual values for the pathways shown here and all pathways analyzed are shown in Supplementary Table 6. BF Expression profile of genes associated with lipid metabolism and the immune system. The gene sets belonging to the categories shown were extracted via the KEGG pathway database. The mean log2(TPM + 1) values of the WT were compared to those of A10-PPARα or A10-PPARα-Cre independently, and the 20 genes with the greatest increase in expression from the WT for each comparison were extracted to generate heatmaps. z scores were calculated from the log2(TPM + 1) values and used to visualize gene expression differences in the heatmaps. The gene expression differences of these pathways, including PPARα target genes, PPAR signaling, lipid metabolism (with vehicle or OA treatment) (B), antigen processing and presentation (C), cytokine and chemokine production (D), pathogen recognition (E), and bacterial killing and inflammasome formation (F), are presented as heatmaps
Fig. 3
Fig. 3
PPARα depletion alters lipid metabolism in ACE-overexpressing macrophages. AG TPMs were incubated with vehicle (ethanol) or 200 μM OA for 16 h. A, B In vitro lipid uptake assay. The intracellular lipid content was determined via Lipi-Deep Red (LDR) staining followed by flow cytometry analysis. Representative histograms (A) and MFI values (fold change) (B) of LDR signals in TPMs. C, D CD36 expression. Representative histograms (C) and MFI values (fold change) (D) of CD36 expression in TPMs measured by flow cytometry. EG Lipid consumption. TPMs were treated with 200 μM OA at 37 °C for 16 h and then washed and cultured in media (without OA) for 6, 12, or 18 h. Intracellular lipids were stained with LDR and quantified via flow cytometry at each time point. E Time-dependent lipid reduction. F Fluorescence microscopy images of intracellular lipids in TPM immediately following OA loading (0 h) or after 18 h without OA. G Lipid reduction rate at 18 h post-OA exposure. H Gene expression profile of OA-treated TMPs. The TPM samples were cultured with 200 μM OA for 16 h, after which the isolated total RNA was subjected to real-time PCR. Gene expression was quantified via the ∆Ct method. I, J Lipid peroxidation. TPMs were incubated with 200 μM OA for 16 h, and lipid peroxidation was subsequently measured by staining with a peroxidation probe and flow cytometry. Representative histogram (I) and MFI values (fold change) (J) of lipid peroxidation. K, L ROS production. TPMs were incubated with ethanol or 200 μM OA for 16 h. Cytosolic ROS and mitochondrial ROS (mtROS) were measured by flow cytometry with H2DFCDA and MitoSOXTM, respectively. Representative histograms (K) and MFI values (fold change) (L) of cytosolic ROS levels in TPMs. Representative histograms (M) and MFI values (fold change) (N) of mtROS levels. O Measurement of the intracellular ATP concentration. TPMs were incubated with ethanol or OA as described above, and then, intracellular ATP was quantified via the luminescence-based assay CellTiter-Glo 2.0. The ATP concentrations were calculated via the standard curve method. PR Real-time metabolic analysis of TPM by Seahorse. P Transition of the oxygen consumption rate (OCR) in the TPMs during analysis. Q, R Basal respiration and maximal respiration of TPMs. The cumulative data are shown as the means ± SEMs of five to six samples from two independent experiments. All MFI values are represented as fold changes (the average value of WT was used for base = 1). One-way ANOVA was used to analyze the significance of the data. *p < 0.05, **p < 0.01 and ***p < 0.01. ns indicates not significant
Fig. 4
Fig. 4
PPARα depletion impairs the antitumor activity of A10-PPARα-Cre mice. A Experimental design of the murine B16-F10 tumor model. The mice received a subcutaneous (s.c.) injection of B16-F10 cells (100 μL of 1.0 × 107/mL in PBS). The tumor volumes were measured, and the immunological activities of intratumor (IT) macrophages and CD8+ T cells were analyzed via flow cytometry on day 14 posttumor inoculation. B Representative pictures of tumors. C Tumor volumes. D Number of tumor-infiltrating macrophages. E Functional marker expression of IT macrophages. M1 markers (TNF-α, IL-6, IL-12/IL-23p40, and iNOS) and M2 markers (arginase 1 (Arg 1), IL-10, and CD206) were measured via flow cytometry, and MFI values were used to generate a heatmap. F, G Representative histograms (H) and MFI values (fold change) (I) of CD80, H-2Kb, and I-Ab expression in IT macrophages. H, I Representative histograms (F) and MFI values (fold change) (G) of PD-L1 and PD-L2 expression by IT macrophages. JO Functional characterization of IT CD8+ T cells. J Representative plots of TRP-2/tetramer (Tet)+CD8+ T cells and IFN-γ+, TNF-α+, or GzmB+ populations among TRP-2/Tet+CD8+ T cells. K, L Percentages (K) and cell numbers (per 100 mm3 of tumor) (L) of TRP-2/Tet+CD8+ T cells. MO Percentages of TNF-α+ (M), IFN-γ+ (N), or GzmB+ (O) TRP-2/Tet+CD8+ T cells. The cumulative data are shown as the means ± SEMs of six to ten samples from two or three independent experiments. All MFI values are represented as fold changes (the average value of WT was used for base = 1). One-way ANOVA was used to analyze the data for significant differences. *p < 0.05, **p < 0.01, and ***p < 0.001; ns not significant
Fig. 5
Fig. 5
PPARα depletion attenuates tumor killing and the antigen-presenting ability of ACE-overexpressing macrophages. A In vitro tumor-killing assay. B16-F10 cells and TPMs prepared from WT, A10-PPARα or A10-PPARα-Cre naïve mice were mixed at a 1:1 ratio and incubated at 37 °C for 24 h. LDH levels in the cultures were measured via absorbance, and the values were used to calculate the tumor-killing rates. B In vitro antigen restimulation assay. Inguinal lymph node (iLN) cells were isolated from tumor-bearing mice 11 days after tumor inoculation and were restimulated with TRP-2 peptide (100 μg/mL) at 37 °C for 72 h. IFN-γ concentrations in the culture medium were measured via ELISA. C In vitro antigen presentation assay. CD8+ T cells were isolated from the iLNs of tumor-bearing WT mice 11 days after tumor inoculation. TPMs were also prepared from naive WT, A10-PPARα, or A10-PPARα-Cre mice and cocultured with CD8+ T cells in the presence of the TRP-2 peptide (100 μg/mL) at 37 °C for 24 h. The expression (MFI) of CD69 and the percentages of IFN-γ-producing cells in the CD8+ T-cell population were measured via flow cytometry. The cumulative data are shown as the mean ± SEM of six samples from two independent experiments. All MFI values are represented as fold changes (the average value of WT was used as 1). One-way ANOVA was used to analyze the data for significant differences. *p < 0.05 and **p < 0.01; ns not significant
Fig. 6
Fig. 6
PPARα depletion impairs the antibacterial immune response of A10-PPARα-Cre mice. AC In vitro phagocytosis. TPMs were incubated with FITC-labeled heat-killed S. aureus (HK-SA-FITC) at 37 °C for 2 h. Bacterial phagocytosis was analyzed via fluorescence microscopy and flow cytometry. A Representative fluorescence microscopy images of the incorporated HK-SA-FITC (green spots) in the TPM (bar = 10 μm). Representative histograms (B) and MFI values (fold change) (C) of incorporated HK-SA-FITC signals in TPMs. D, E Cell surface receptor expression in TPMs. Representative histograms (D) and MFI values (fold change) (E) of CD16/CD32, CD64, CR1/2, TLR2, and TLR6 are shown. F In vitro TPM stimulation assay. TPMs were stimulated with HK-SA at 37 °C for 24 h, and the concentrations of IL-1β, TNF-α, and nitrite in the culture medium were measured via ELISA and the Griess assay. ROS production in TPMs was measured by flow cytometry with DCFDA staining. G, H In vitro MRSA killing. G In vitro bactericidal activity assay. TPMs (1.0 × 106/mL) were incubated with MRSA (1.0 × 107 CFU/mL, MOI = 1:10) for 2 h or 5 h, and the number of live MRSA in the supernatant and within the TPM was quantitated as colony-forming units (CFUs). The bacterial CFUs in the supernatant and intracellular mixture are shown in (H). IK In vivo MRSA infection. I In vivo bactericidal activity assay. The mice received an i.v. injection of live MRSA (100 μL of 1.0 × 109 CFU/mL in PBS). After 24 h or 48 h, the number of MRSA CFUs in the peripheral blood (PB) was measured (J). The number of MRSA CFUs in the spleen, liver, and lung was also measured at 48 h (per 100 mg of tissue) (K). All MFI values are represented as fold changes (the average value of WT was used as 1). The cumulative data are shown as the means ± SEMs of six or eight samples from two or three independent experiments. One-way ANOVA was used to analyze the data for significant differences. *p < 0.05, **p < 0.01 and ***p < 0.01. ns not significant
Fig. 7
Fig. 7
PPARα regulates the ACE-mediated functional behavior of human macrophage-like cells. THP-1 and THP-1-ACE cells were differentiated into macrophage-like cells by treatment with 20 ng/mL PMA for 72 h. A Western blot (WB) image of ACE expression. B In vitro tumor killing. BT549 cells and macrophage-like cells were mixed at a 1:1 ratio and incubated at 37 °C for 24 h. LDH concentrations in the culture media were measured to calculate the degree of killing of the tumor cells. C In vitro phagocytosis. Macrophage-like cells were incubated with FITC-labeled S. aureus (SA-FITC) for 2 h at 37 °C, after which bacterial phagocytosis was quantified via flow cytometry. D In vitro MRSA killing. Macrophage-like cells were incubated with MRSA (MOI = 1:30) at 37 °C for 5 h. The number of live intracellular MRSA was then determined via CFU analysis. In this assay, the cells were also treated with vehicle (DMSO), WY 146743 (a PPARα agonist), or GW6471 (a PPARα antagonist). E WB image of PPARα expression in THP-1 cells. Human PPARα was overexpressed in THP-1 cells via adenovirus transduction. THP-1 cells and PPARα-overexpressing (OE) THP-1 cells were used to measure in vitro tumor killing (F), in vitro phagocytosis (G), and in vitro MRSA killing (H). I WB image of ACE and PPARα expression in PPARα-knockdown (KD) THP-1 or THP-1-ACE cells. PPARα mRNA expression was silenced via shRNA. These cells were used to measure in vitro tumor killing (J), in vitro phagocytosis (K), and in vitro MRSA killing (L). All MFI values are represented as fold changes (the average value of the control was used as 1). The cumulative data are shown as the means ± SEMs of six to nine samples from two or three independent experiments. Student’s t-test or one-way ANOVA was used to analyze the data for significant differences. *p < 0.05, **p < 0.01 and ***p < 0.01. ns not significant
Fig. 8
Fig. 8
Selective PPARα activation enhances antitumor immunity. A Effect of a selective PPARα agonist in a murine melanoma model. The mice received a s.c. injection of B16-F10 cells on the same day. Beginning on day 7, DMSO (control) or 10 mg/kg pemafibrate was administered daily for 7 days. On day 14, the tumor volume was measured, and intratumor (IT) CD8+ T cells and macrophages were studied via flow cytometry. B Representative pictures of tumors. C Measurement of tumor volume. D Percentage of control tumor volume where tumors in the DMSO-treated WT group were set as 100%. E Representative plots of TRP-2/Tet+CD8+ T cells in tumors. F TRP-2/Tet+CD8+ T cells as a percentage of all CD8+ T cells in tumors. G Heatmap characterization of IT macrophages for receptors and cytokines important for the antitumor response. The data are shown as the means ± SEMs of six to nine tumor samples (one sample/mouse) from three independent experiments. One-way ANOVA was used to analyze the data for significant differences. *p < 0.05, **p < 0.01 and ***p < 0.01. ns not significant

Update of

Comment in

References

    1. Russell DG, Huang L, VanderVen BC. Immunometabolism at the interface between macrophages and pathogens. Nat Rev Immunol. 2019;19:291–304. - PMC - PubMed
    1. Christofides A, Strauss L, Yeo A, Cao C, Charest A, Boussiotis VA. The complex role of tumor-infiltrating macrophages. Nat Immunol. 2022;23:1148–56. - PMC - PubMed
    1. Barrett TJ. Macrophages in atherosclerosis regression. Arterioscler Thromb Vasc Biol. 2020;40:20–33. - PMC - PubMed
    1. Bernstein KE, Khan Z, Giani JF, Cao DY, Bernstein EA, Shen XZ. Angiotensin-converting enzyme in innate and adaptive immunity. Nat Rev Nephrol. 2018;14:325–36. - PMC - PubMed
    1. Okwan-Duodu D, Datta V, Shen XZ, Goodridge HS, Bernstein EA, Fuchs S, et al. Angiotensin-converting enzyme overexpression in mouse myelomonocytic cells augments resistance to Listeria and methicillin-resistant Staphylococcus aureus. J Biol Chem. 2010;285:39051–60. - PMC - PubMed

LinkOut - more resources