. 2025 Feb;638(8049):112-119.
doi: 10.1038/s41586-024-08514-6. Epub 2025 Feb 5.

Emergence of collective oscillations in massive human crowds

Affiliations

Emergence of collective oscillations in massive human crowds

François Gu et al. Nature. 2025 Feb.

Abstract

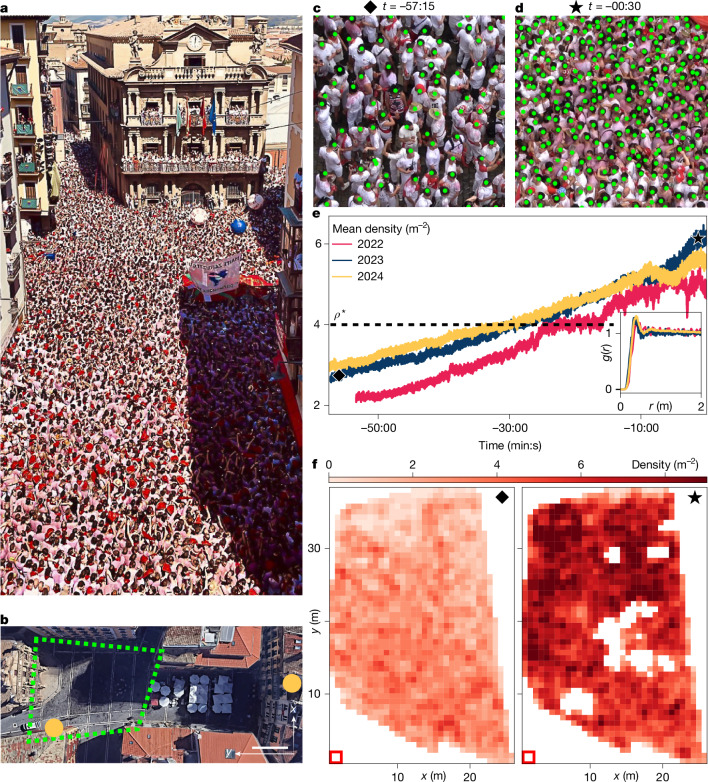
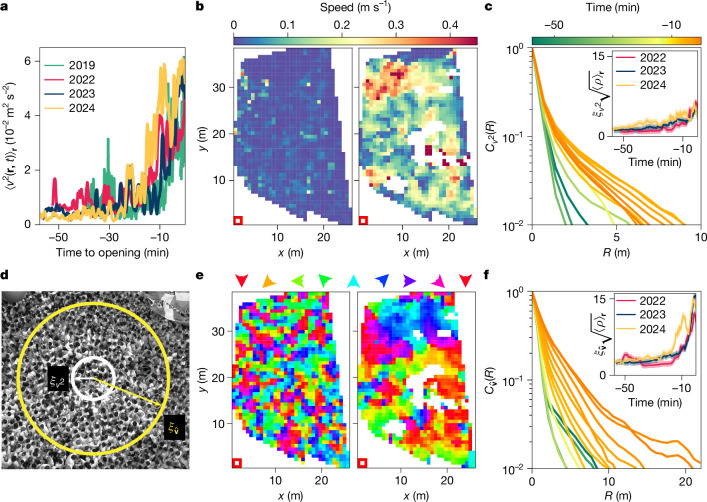
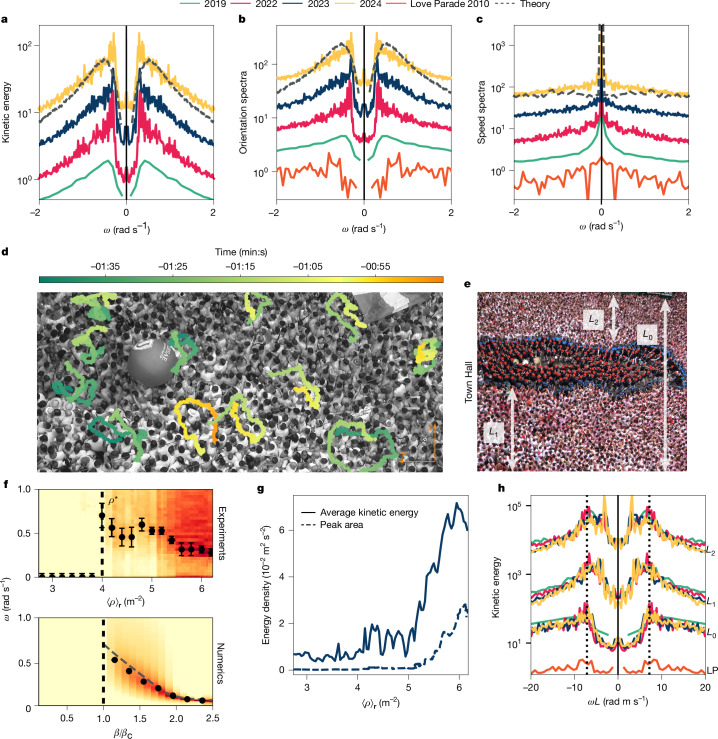
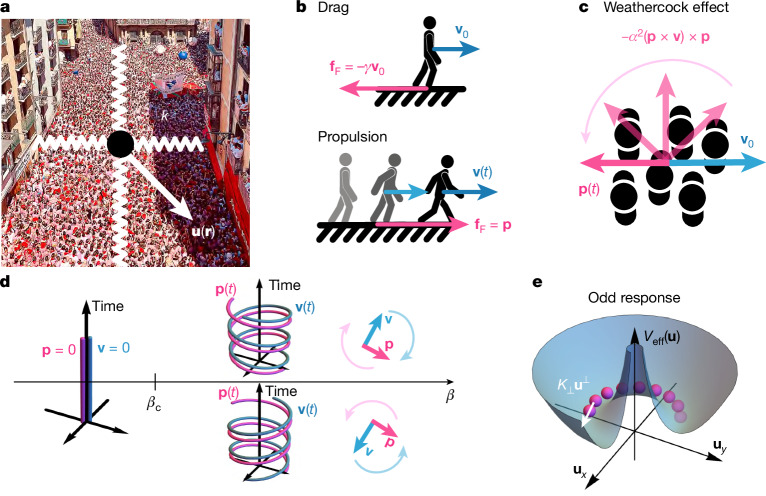
Dense crowds form some of the most dangerous environments in modern society1. Dangers arise from uncontrolled collective motions, leading to compression against walls, suffocation and fatalities2-4. Our current understanding of crowd dynamics primarily relies on heuristic collision models, which effectively capture the behaviour observed in small groups of people5,6. However, the emergent dynamics of dense crowds, composed of thousands of individuals, remains a formidable many-body problem lacking quantitative experimental characterization and explanations rooted in first principles. Here we analyse the dynamics of thousands of densely packed individuals at the San Fermín festival (Spain) and infer a physical theory of dense crowds in confinement. Our measurements reveal that dense crowds can self-organize into macroscopic chiral oscillators, coordinating the orbital motion of hundreds of individuals without external guidance. Guided by these measurements and symmetry principles, we construct a mechanical model of dense-crowd motion. Our model demonstrates that emergent odd frictional forces drive a non-reciprocal phase transition7 towards collective chiral oscillations, capturing all our experimental observations. To test the robustness of our findings, we show that similar chiral dynamics emerged at the onset of the 2010 Love Parade disaster and propose a protocol that could help anticipate these previously unpredictable dynamics.


Conflict of interest statement

Competing interests: The authors declare no competing interests.

Figures

Fig. 1
Fig. 1. Gathering of a massive crowd in Pamplona, Spain.
a, Picture of the crowd at the opening ceremony of the San Fermín festival (2019). b, Aerial view of the Plaza Consistorial. We analyse the crowd dynamics in the region delimited by the dashed polygon. The orange dots are the observation spots. Scale bar, 10 m. c, Close-up view on the crowd 57 minutes and 15 seconds before the opening of the festival. The green dots show the position of the head of the festival attendees (Methods). d, Close-up view on the crowd 30 seconds before the opening of the festival. The crowd density has markedly increased. e, Plot of the mean number density of the crowd as a function of the time to the festival opening. Diamond, t = −57:15 (see c); star, t = −00:30 (see d). The crowd density increases slowly and monotonically. The dashed line indicates the value of ρ*. The measurement error is smaller than the statistical variations that define the width of the plots. Inset: radial distribution function g(r) computed from the position of individuals and averaged over about 7 minutes before the festival opening (see Methods for details). f, Snapshots of two local-density maps for t = −57 min 15 s (left) and t = −30 s (right). The white areas correspond to regions where the field of view is obstructed by buildings, flags and balloons (see a and Methods).
Fig. 2
Fig. 2. Emergence of spatially correlated motion in dense crowds.
a, Spatially averaged velocity fluctuations plotted versus time. The fluctuations increase about 30 minutes before the opening of the festival. The measurement error is smaller than the thickness of the solid lines given the integration over all the local velocities, and the running average over a 1-min interval. b, Heat maps of the local crowd speed at t = −57:15 and t = −00:30 (2023 data). The flows of dense crowds are heterogeneous. c, Spatial correlation function of the squared speed, Cv2, plotted versus the distance R for different times (2023). Inset: associated correlation lengths measured in 2022, 2023 and 2024, and normalized by the typical distance between two attendees. The thickness of the lines represents the combined errors on ξ and ρ. The error on ξ is estimated on the spatial resolution of the spatial correlations and the error on ρ is estimated on the typical fluctuations of the mean density against time. d, Illustrations of the extent of the orientation and speed correlations at t = −00:30. The correlations of v^ reflect the directed motion of hundreds of individuals. e, Maps of the local orientation of the spontaneous flows in the crowd (same times as in b). In dense crowds, the orientation of the emergent flows correlates over more than 10 m. f, Spatial correlation function of the orientation field, Cv^, plotted versus the distance R for different times (2023). Inset: associated correlation lengths measured in 2022, 2023 and 2024, and normalized by the typical distance between two attendees. The thickness of the lines represents the combined errors on ξ and ρ.
Fig. 3
Fig. 3. Dense crowds oscillate spontaneously.
For model details, see equations (1) and (2) and Methods. See Methods for simulation parameters. a, Power spectra of v (that is, the kinetic energy) measured in 2019, 2022, 2023 and 2024 along with predictions from our mechanical model. The spectra are shifted for increased readability. b,c, Normalized power spectra of v^ (b) and v2 (c) measured in 2019, 2022, 2023 and 2024, as well as in the Love Parade 2010, and compared with predictions from our mechanical model. The spectra are shifted for increased readability. d, Raw trajectories tracked in the 2023 crowd. We do not observe sequences of back-and-forth motion. e, Illustrations of the different confinement lengths used in the rescaled spectra shown in h. It is noted that L0 and L1 extend up to the wall located at the bottom of the image, which is not visible in the current view. f, Heat maps in logarithmic scale showing the variations of the kinetic energy spectrum with the spatially averaged density (experiments), and with the windsock parameter β/βc of our numeric simulations. The black dots indicate the value of ω0 and the vertical dashed line represents ρ* and β = βc. The dashed grey line in the bottom panel represents the theoretical evolution of ω0 with β/βc. For β < βc, the spectra are flat, so we set ω0 = 0. The experimental error bars were estimated manually. g, Variations of the total kinetic energy and of the area below the peak of the power spectrum (ω ∈ [0.25, 0.40] rad s−1) with the mean crowd density (2023). Oscillatory dynamics dominate the kinetic energy of the crowd. h, Normalized power spectra of v plotted against rescaled pulsation ωL, where L is the confinement length. The spectra measured with the confinement length L0 correspond to those shown in a. The spectra measured with the confinement length L1 and L2 correspond to the crowd dynamics during the orchestra performance (see e). The measured widths are L0 = 23.1 m, L1 = 10.0 m, L2 = 9.1 m (Chupinazo) and LP = 11 m (Love Parade 2010). The dotted black lines represent the rescaled pulsation ω0L.
Fig. 4
Fig. 4. Dense crowds support chiral oscillations with non-prescribed handedness.
a, The colours indicate the local handedness ϵ(r, t) of the oscillatory displacements in a crowd where ⟨ρ(r, t)⟩r ≈ 6 m−2 (2023). We compute ϵ(r, t) for the oscillatory component of the dynamics by applying a band-pass filter ω ∈ [0.25, 0.40] rad s−1 to v(r, t) (Methods). b, Probability P(ϵ) of the spin variable in an approximately 7-min-long interval before the opening of the festival (2022, 2023 and 2024). In agreement with our theory, the parity of the dynamics is not explicitly broken (see equation (2) and Methods for the numerical parameters). The error bars are estimates based on the jackknife method (Methods). c, The correlation length ξϵ of ϵ(r, t) measures the size of the regions where the crowd oscillations have a uniform handedness (Methods). The thickness of the lines represents the measurement error.
Fig. 5
Fig. 5. Emergent odd mechanics in crowd motion.
a, When packed, the crowd is a soft medium confined by the walls of the Plaza Consistorial. Within a harmonic approximation, the resulting confining potential V(u) can be modelled by a spring stiffness k (third term in equation (1)). b, Illustration of the two contribution to the friction force in equation (1). Top: when the crowd moves at a velocity v0, it experiences a passive drag in the opposite direction −γv0. Bottom: the crowd is an active medium. It can propel owing to the propulsive component p of the friction force. It is noted that in our mean-field theory, these forces are not defined at the single-individual scale, but at macroscopic scales of the order of ξv^. c, Illustration of the weathercock term in equation (2). As the crowd propels with a velocity v, the α2 term rotates the orientation of the propulsive force p in the direction opposite to v. d, The pink and blue lines represent the world lines of the p and v variables, respectively. When β < βc, the crowd is in a quiescent state, the velocity and the propulsive force vanish. When β = βc, a non-reciprocal phase transition results in a spontaneous chiral-symmetry breaking. The crowd oscillates along limit cycles of opposite handedness. The oscillations are sustained as v chases p, while p moves away from v (weathercock effect). e, When integrating out the fast degrees of freedom (p(t)), we are left with an effective theory where the centre of mass of the crowd evolves along the ridge of an effective ‘Mexican hat’ potential under the action of an ‘odd spring’ of stiffness K. The odd stiffness arises from the active friction on the ground.
Extended Data Fig. 1
Extended Data Fig. 1. Top views of the Chupinazo crowd.
The crowd first gathers and fills the plaza Consistorial. When the average density of people exceeds ~ 4 m−2 the crowd undergoes spontaneous oscillations. In our article we investigate solely these two regimes. Then, at noon, the festival starts and all attendees raise red handkerchiefs. Finally, several orchestras surrounded by the police force performs in the crowd, and exit the plaza Consistorial followed by the festival attendees.
Extended Data Fig. 2
Extended Data Fig. 2. Evolution of the kinetic energy spectra with the crowd density.
Kinetic energy spectra Sv(ω) measured at three different times (time window: 3 mins). For each spectrum we indicate the mean value of the crowd density. a, d and g, At low density the spectra peak at zero: the crowd does not oscillate. b, e and h, When the mean density exceeds ~ 4 people per square meter, the kinetic energy spectra feature two peaks at finite frequency. The crowd oscillates. c, f and i, When the crowd density further increases, the peaks become narrower thereby indicating a longer persistence of the oscillations.
Extended Data Fig. 3
Extended Data Fig. 3. In dense crowds, spontaneous oscillations dominate the speed fluctuations of the crowd flow. The oscillations become increasingly coherent as the density increases.
a, d and g, Magnitude of the spatially averaged velocity fluctuations plotted versus time. b, e and h, Time-frequency plots of the kinetic energy spectra (time window: 3 mins). Black dots: maxima of the energy spectra, i.e., oscillation frequency of the crowd flow. Same plot as in Fig. 3f of the text and comparison with the 2022 and 2024 data which show the same trends. c, f and i, Evolution of the relaxation time τ(t) of the spontaneous oscillations measured as the full width at half maximum of the instantaneous kinetic energy spectra. We illustrate the definition of τ in Extended Data Fig. 2.
Extended Data Fig. 4
Extended Data Fig. 4. Velocity correlations in dense crowds.
a, The heatmap represents the values of the spatial autocorrelation of the velocity field measured in 2022 in the dense regime. The dashed line marks where the correlation value reaches 0.1. b, Same plot for the 2023 experiments. c, Same plot for the 2024 experiments.
Extended Data Fig. 5
Extended Data Fig. 5. Determination of the constitutive relation p({u}, {v}) for the active friction.
To determine how the active friction force depends on the local state of the crowd we compute the spectra Sv, Sv2, the distribution of the spin variable ϵ(t), the amplitude of velocity fluctuations v (radius of the limit cycles when they exist) and the angular frequency of oscillation Ω. The different models are detailed in the SI. Only the overdamped model with a spontaneous parity breaking (d) is able to reproduce the salient features observed in our experiments. Simulation parameters are γ = 1, α = 1, γp = 18, k = 0.027, η = 0.45, σ = 0, σp = 2 and βc = γ + k/γp (d) and γ = 1, α = 1, γp = 50, σ = 0, σp = 5 and βc = γ (e).
Extended Data Fig. 6
Extended Data Fig. 6. Observation setup.
a, Aerial view of the plaza Consistorial and location of the two observation spots. The dashed lines show two typical pictures taken in 2022 (red) and 2023 (orange). b, Image taken from the leftmost spot at t = −00: 30. c, d, Pictures of our custom camera mounts fixed on a building balcony. e, Image taken from the rightmost spot at t = −00: 30.
Extended Data Fig. 7
Extended Data Fig. 7. Planar homography and dynamical masking of the perturbations to the field of view.
a, Raw image (2023) of the plaza Consistorial. We identify four distinctive features on the ground and label their positions (green dots). b, Location of the four same spots on a satellite view (Google Earth Pro). c, Same image as in a after the planar homography correction (2023). d, Raw image showing balloons and flags held by the festival attendees (2022). e, Flags and balloons automatically detected by the YOLOv8 neural network and highlighted with bright colors. f, Velocity field measured on the corrected images around the flags and balloons only.
Extended Data Fig. 8
Extended Data Fig. 8. Emergence of collective oscillations during the Love Parade 2010, Duisburg, Germany.
a, Satellite view of the main entry to the Love Parade 2010 festival (Google Earth). The dotted squares indicate the fields of view of the two publicly available video clips we analysed (see Methods). Clip 1: green polygon; Clip 2: orange rectangle. b, Power spectra of the velocity field v, velocity orientation v^, and squared norm v2 corresponding to clip 1 (see Methods). c, Same power spectra computed from clip 2 (see Methods).
Extended Data Fig. 9
Extended Data Fig. 9. Chiral dynamics of dense crowds and construction of the spin field.
a, Time variations of the angle θ(rt) made by the filtered velocity field with the x − axis for one position r (2023 data). The band-pass filter applied to v is a rectangular window for ω ∈ [0.25, 0.40] rad/s. b, Same time series as in a after unwinding the angular variable and smoothing it over a time window of width π/ω0, where ω0 = 0.32 rad/s is the oscillation frequency. Note that the angular frequency of v(rt) is strongly persistent but changes in time. The handedness of the dynamics is an emergent dynamical property. c, Corresponding spin field measured at t = −02: 30 in 2023.
Extended Data Fig. 10
Extended Data Fig. 10. Phase diagram representing the stability of the limit cycles of the overdamped model with an additional non-linearity.
(term η3, see Methods and SI for further details). The region in pink corresponds to the range of parameters for which the limit cycles are stable for all values of the windsock parameter β. In the blue region, there are values of β for which the limit cycles are unstable. Because we do not observe chaotic motion of the crowd, the hydrodynamic coefficients characterizing the Chupinazo crowd in the overdamped regime lie in the pink region.

References

    1. Feliciani, C., Shimura, K. & Nishinari, K. Introduction to Crowd Management: Managing Crowds in the Digital Era: Theory and Practice (Springer, 2022).
    1. Feliciani, C., Corbetta, A., Haghani, M. & Nishinari, K. Trends in crowd accidents based on an analysis of press reports. Saf. Sci.164, 106174 (2023).
    1. Helbing, D., Johansson, A. & Al-Abideen, H. Z. Dynamics of crowd disasters: an empirical study. Phys. Rev. E75, 046109 (2007). - PubMed
    1. Helbing, D. & Mukerji, P. Crowd disasters as systemic failures: analysis of the Love Parade disaster. EPJ Data Sci.1, 7 (2012).
    1. Corbetta, A. & Toschi, F. Physics of human crowds. Annu. Rev. Condens. Matter Phys.14, 311–333 (2023).

LinkOut - more resources