. 2025 Jan 29;10(1):120-139.
doi: 10.20411/pai.v10i1.770. eCollection 2024.

The TB27 Transcriptomic Model for Predicting Mycobacterium tuberculosis Culture Conversion

Affiliations

The TB27 Transcriptomic Model for Predicting Mycobacterium tuberculosis Culture Conversion

Maja Reimann et al. Pathog Immun. .

Abstract

Rationale: Treatment monitoring of tuberculosis patients is complicated by a slow growth rate of Mycobacterium tuberculosis. Recently, host RNA signatures have been used to monitor the response to tuberculosis treatment.

Objective: Identifying and validating a whole blood-based RNA signature model to predict microbiological treatment responses in patients on tuberculosis therapy.

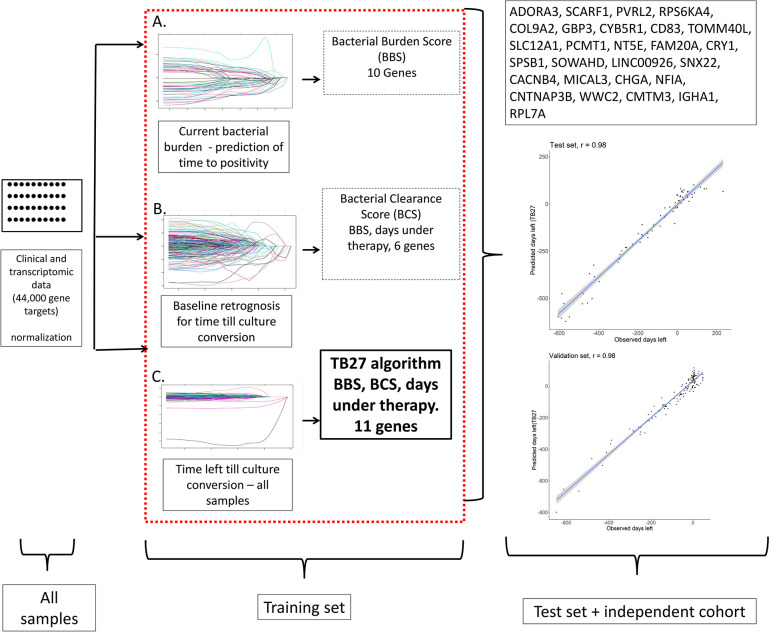
Methods: Using a multi-step machine learning algorithm to identify an RNA-based algorithm to predict the remaining time to culture conversion at flexible time points during anti-tuberculosis therapy.

Results: The identification cohort included 149 patients split into a training and a test cohort, to develop a multistep algorithm consisting of 27 genes (TB27) for predicting the remaining time to culture conversion (TCC) at any given time. In the test dataset, predicted TCC and observed TCC achieved a correlation coefficient of r=0.98. An external validation cohort of 34 patients shows a correlation between predicted and observed days to TCC also of r=0.98.

Conclusion: We identified and validated a whole blood-based RNA signature (TB27) that demonstrates an excellent agreement between predicted and observed times to M. tuberculosis culture conversion during tuberculosis therapy. TB27 is a potential useful biomarker for anti-tuberculosis drug development and for prediction of treatment responses in clinical practice.

Keywords: biomarker; precision medicine; systems biology; therapy response; tuberculosis treatment.


Conflict of interest statement

Stefan H.E. Kaufmann, Maja Reimann, Jan Heyckendorf, Sebastian Marwitz, and Christoph Lange declare that they are co-holders of patents on tuberculosis biomarkers

Figures

Figure 1.
Figure 1.
Multi-step development for predicting time left until culture conversion. Simplified flow chart showing the multi-step approach of transcriptomic and clinical data analysis to develop the TB27 model for predicting days left until culture conversion at any given time during therapy. Step 1: A) “Bacterial burden score (BBS)” modeling. Identification of genes using LASSO regression Genes identified for predicting time to culture positivity. After further gene reduction steps, a model consisting of 10 genes was created to draw conclusions about bacterial burden through TTP prediction. Step 2: B) Bacterial clearance score (BCS). Retro prediction for time to culture conversion at therapy initiation. Through the LASSO and other reduction procedures, 6 genes were identified to predict the time to culture conversion at therapy start. Step 3: C) TB27 Score. BBS, BCS, and 44,000 transcripts formed the basis. Gene reduction led to the final model consisting of BBS, BCS, time under therapy, and 11, which is expected to predict the remaining time to culture conversion. The model fit is R=0.98; in the test set, the correlation coefficient is r=0.98; in the validation set, the correlation coefficient is r=0.98
Figure 2.
Figure 2.
Comparison of the 27-RNA gene signature model with published RNA-signatures and scores for predicting time left until culture conversion during therapy. Y-axis: Predicted days left until culture conversion; X-axis: time under therapy in months. Figure 2A: TB27. Figure 2B: TB22 [17]. Figure 2C: Anderson et al, 43 genes [18]. Figure 2D: Berry et al, 87 genes [19]. Figure 2E: Blankley et al, 4 genes [20]. Figure 2F: Kaforou et al, 27 genes [21]. Figure 2G: Kaforou et al, 44 genes [21]. Figure 2H: Kaforou et al, 53 genes [21]. Figure 2I: Laux da Costa et al, 3 genes [22]. Figure 2J: Maertzdorf et al, 3 genes. Figure 2K: Sambarey et al, 10 genes [25] Figure 2L: Singhania et al, 20 genes [26]. Figure 2M: Sutherland et al, 4 genes [28]. Figure 2N: Suliman et al, 4 genes [27]. Figure 2O: Sweeney et al, 3 genes [30]. Figure 2P: Thompson et al, 9 genes [29]. Figure 2Q: Thompson et al, 16 genes [29]. Figure 2R: Thompson et al, 32 genes [29]. Figure 2S: RISK6 genes [23]. Figure 2T: Zak et al, 16 genes [14].
Figure 3.
Figure 3.
Bland-Altman plot as a graphical representation of the agreement between the observed remaining time to culture conversion as the gold standard and the TB27 score with a limit of agreement of one standard deviation (upper and lower dashed line) in the validation cohort. A) Consistency of TB27 and culture data in all samples of validation cohort. B) Consistency of TB27 and culture data in all measurements after the start of therapy and before the culture conversion of validation cohort.
Figure 4.
Figure 4.
Comparison of the 27-RNA gene signature model with published RNA-signatures and scores for predicting time left until culture conversion at baseline with consideration of presence or absence of cavities. Y-axis: Predicted days left until culture conversion. Figure 4A: TB27. Figure 4B: TB22 [17]. Figure 4C: Anderson et al, 43 genes [18]. Figure 4D: Berry et al, 87 genes [19]. Figure 4E: Blankley et al, 4 genes [20]. Figure 4F: Kaforou et al, 27 genes [21]. Figure 4G: Kaforou et al, 44 genes [21]. Figure 4H: Kaforou et al, 53 genes [21]. Figure 4I: Laux da Costa et al, 3 genes [22]. Figure 4J: Maertzdorf et al, 3 genes [24]. Figure 4K: RISK6 genes [23]. Figure 4L: Sambarey et al, 10 genes [25]. Figure 4M: Singhania et al, 20 genes [26]. Figure 4N: Suliman et al, 4 genes [27]. Figure 4O: Sutherland et al, 4 genes [28]. Figure 4P: Sweeney et al, 3 genes [30]. Figure 4Q: Thompson et al, 16 genes [29]. Figure 4R: Thompson et al, 32 genes [29]. Figure 4S: Thompson et al, 9 genes [29]. Figure 4T: Zak et al, 16 genes [14].

References

    1. World Health Organization. Global tuberculosis report 2023. Geneva, Switzerland: 2023.
    1. World Health Organization. Treatment of drug-susceptible tuberculosis: rapid communication. Geneva, Switzerland: WHO; 2021.
    1. World Health Organization. Rapid communication: key changes to the treatment of drug-resistant tuberculosis. Geneva, Switzerland: World Health Organization, 2022.
    1. Schaberg T, Brinkmann F, Feiterna-Sperling C, Geerdes-Fenge H, Hartmann P, Häcker B, Hauer B, Haas W, Heyckendorf J, Lange C.. Tuberkulose im Erwachsenenalter. Pneumologie. 2022;76(11):727–819. - PubMed
    1. Heyckendorf J, Georghiou SB, Frahm N, Heinrich N, Kontsevaya I, Reimann M, Holtzman D, Imperial M, Cirillo DM, Gillespie SH, Ruhwald M.. Tuberculosis Treatment Monitoring and Outcome Measures: New Interest and New Strategies. Clin Microbiol Rev. 2022;35(3):e0022721. doi: 10.1128/cmr.00227-21. PubMed PMID: 35311552; PMCID: PMC9491169. - DOI - PMC - PubMed

LinkOut - more resources