. 2025 Feb 5;9(3):bvaf012.
doi: 10.1210/jendso/bvaf012. eCollection 2025 Feb 4.

Hypothalamic Estrogen Receptor α Is Essential for Female Marmoset Sexual Behavior Without Protecting From Obesity

Affiliations

Hypothalamic Estrogen Receptor α Is Essential for Female Marmoset Sexual Behavior Without Protecting From Obesity

Marissa Kraynak et al. J Endocr Soc. .

Abstract

Context: Estrogen receptor α (ERα) in the ventromedial (VMN) and arcuate (ARC) nuclei of female rodent mediobasal hypothalami (MBHs) provides a crucial molecular gateway facilitating estradiol (E2) regulation of sexual behavior, reproductive neuroendocrinology, and metabolic function. In female nonhuman primates (NHPs) and women, however, its hypothalamic counterpart remains unknown.

Objective: We hypothesized that knockdown (KD) of ERα expression in the hypothalamic VMN and ARC of female marmosets would diminish sexual receptivity, while simultaneously disrupting gonadotropic and metabolic homeostasis.

Methods: We ovariectomized (OVX) adult female marmosets of comparable age and weight, immediately replaced E2 at midcycle levels, and approximately 1 month later assigned monkeys to diet-induced obesity (DIO) within group (1) control, receiving scrambled short hairpin RNA (shRNA), or (2) ERαKD, receiving selective ERα gene silencing shRNA. Magnetic resonance imaging-guided neural surgery enabled hypothalamic infusion of viral vector shRNA and subsequent brain immunohistochemistry enabled observer-validated, NIS-elements computer software quantification of ERα knockdown.

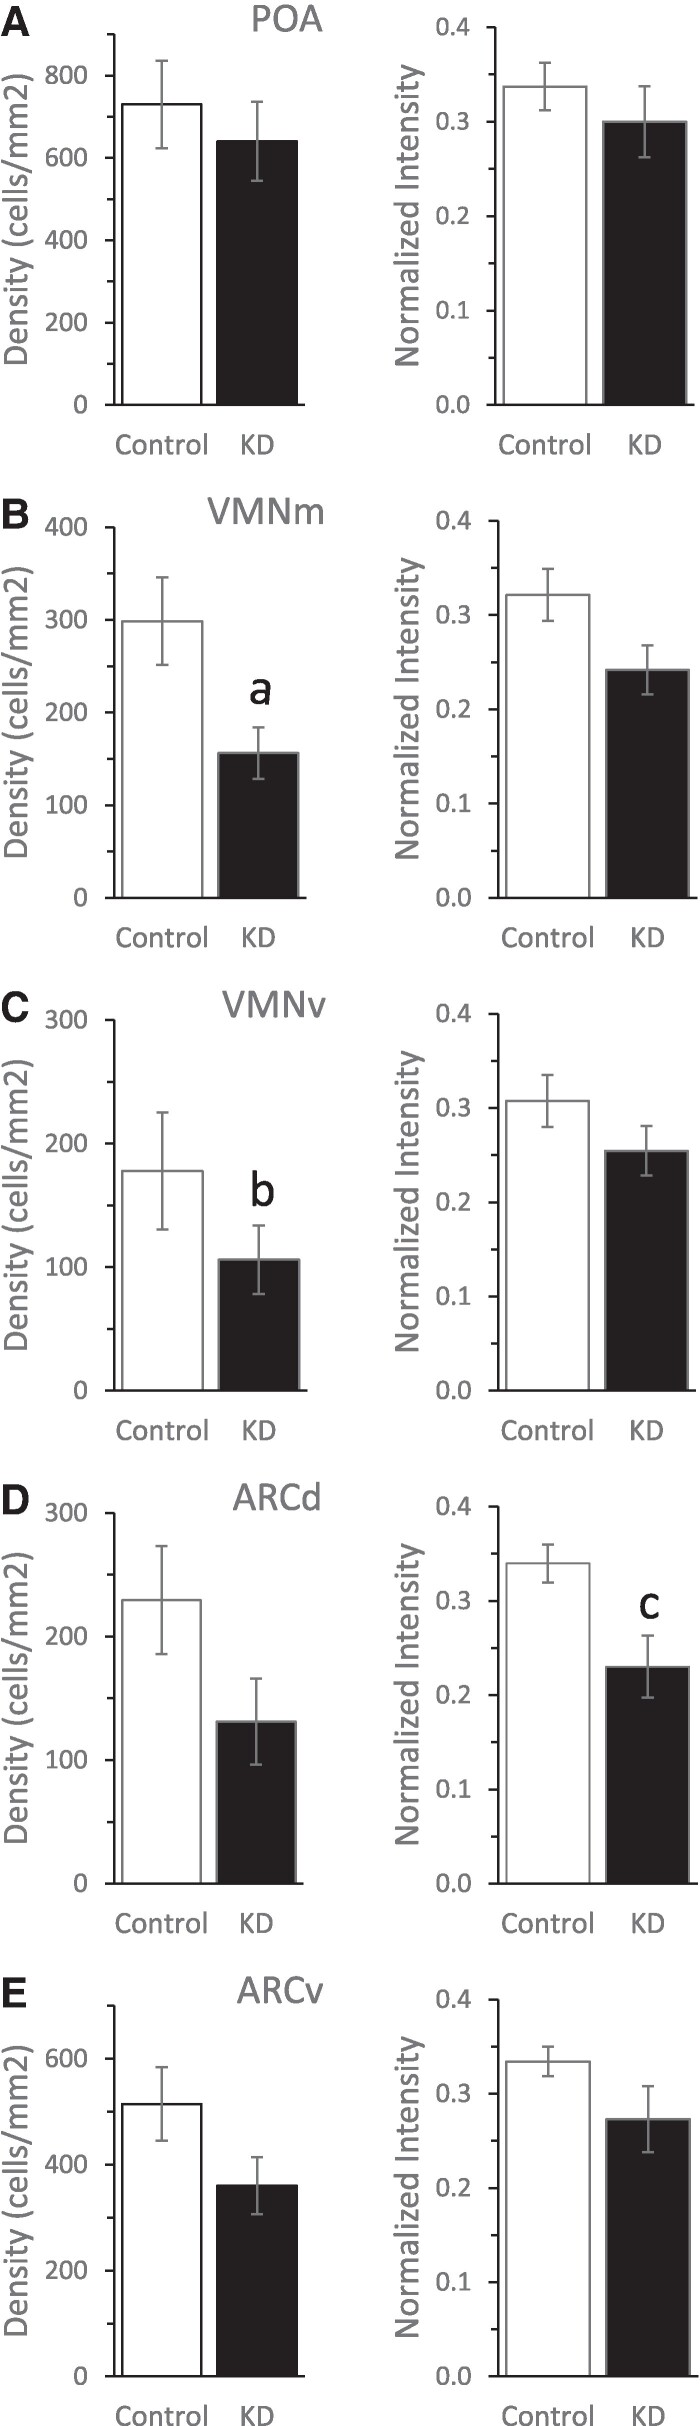
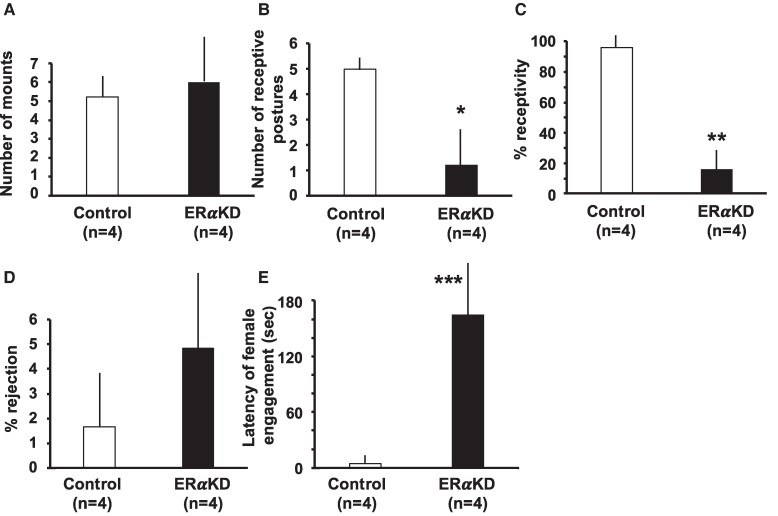
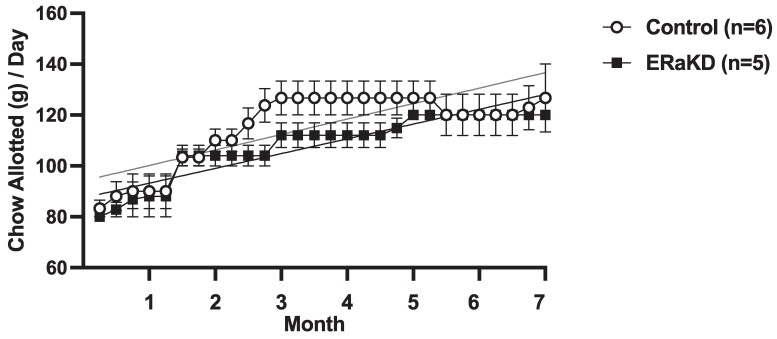
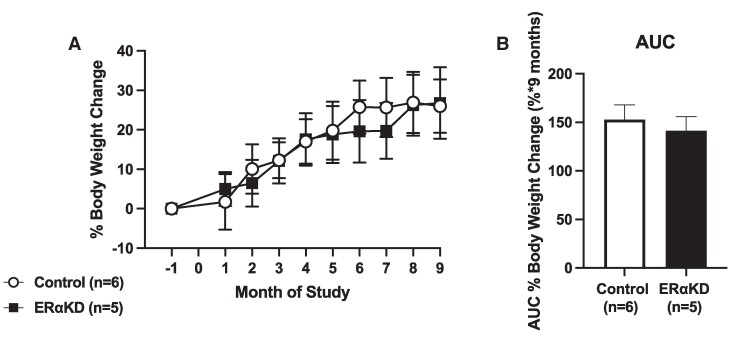
Results: ERα expression was significantly diminished in the VMN and ARC, but not the preoptic area (POA), of ERαKD females coincident with elimination of timely female sexual responses, more than 80% loss of female receptivity, modestly elevated gonadotropin levels, hyperglycemia, and diminished calorie consumption. Density and intensity of ERα-expressing cells in the VMN correlated positively with female sexual receptivity and calorie consumption, negatively with timeliness of female sexual responses, and in the ARC, correlated negatively with calorie consumption.

Conclusion: ERα activation in the female NHP MBH is critically important for female sexual behavior and modestly contributes to gonadotropic and metabolic control.

Keywords: arcuate nucleus; diet-induced obesity; female sexual dysfunction; hyperglycemia; hypergonadotropism; ventromedial nucleus.


Figures

Figure 1.
Figure 1.
Adeno-associated virus 8 (AAV8)-mediated short hairpin RNA (shRNA) reduces ERα protein expression in vitro. Schematic representations of the shRNA sequences packaged within AAV8 vector infused into ERαKD adult female marmoset monkey hypothalami in this study, A, ERα34 shRNA and scramble control shRNA, and B, the alternative ERα56 shRNA packaged within AAV8 and not employed in this study. Highlighted text illustrates corresponding small interfering RNA (siRNA) sequences and bold text indicates loop sequences. C, Western blot analysis illustrating diminished ERα protein expression in MCF7 transfected with the shRNA-expressing vectors pAAV-H1-ERα34-EGFP or pAAV-H1-ERα56-EGFP compared to mock transfected cells treated with Lipofectamine alone. The consistent expression of actin, the protein loading control, across all lanes indicates diminished ERα expression is due to shRNA knockdown. %, concentration of Lipofectamine; Lo, Hi, relative concentrations of shRNA plasmid; Mock, transfected cells treated with Lipofectamine alone.
Figure 2.
Figure 2.
Representative magnetic resonance imaging (MRI) T1 coronal sections of the brain and head of an ERαKD adult female marmoset, ERαKD 2, A, before and B, during MRI-guided bilateral infusion of viral vector comprising short hairpin RNA (shRNA) specific for ESR1 and a gene promoter for GFP (AAV8-H1-ERα34-EGFP) into the mediobasal hypothalamus. Infusions contained MRI contrast agent and thus manifest as light gray-black–appearing mixtures (arrows, contrast agent). Each coronal image is taken at a similar rostral-caudal location at the level of the median eminence-pituitary stalk, and arrows indicate the anatomical locations of the ventromedial nucleus (VMN) and arcuate nucleus (ARC). The tissue-dense posterior pituitary is visualized as light gray immediately below the median eminence and darker anterior pituitary (AP).
Figure 3.
Figure 3.
Green fluorescent protein (GFP) and ERα immunohistochemical labeling following hypothalamic infusion of adeno-associated virus 8 (AAV8) construct. A1, Low-power image of immuno-label for GFP in perihypothalamic and hypothalamic areas that demonstrates extensive bilateral viral vector infection of cells in the vicinity of the third ventricle (3V) hypothalamic ventromedial nucleus (VMN) and arcuate nucleus (ARC), with a modicum of infection in the median eminence (ME), dorsal anterior pituitary (PIT), and medial portions of both optic tracts (ot). B1 to B3, Higher-power images show GFP immunostaining in cell bodies and processes in VMN, ARC and PIT, respectively. C1 to C3, Higher-power images illustrating ERα-labeled nuclei from a scrambled control female marmoset (ERα scr) that demonstrate abundant ERα-labeling in the VMN, ARC, and PIT, respectively. D1 to D3, Higher-power images illustrating ERα-labeled nuclei from an ERα knockdown (ERα KD) female marmoset that demonstrate greatly diminished ERα-labeling in the VMN and ARC, but with abundant ERα-labeling in PIT. Images illustrated in A1, B1 to B3, and D1 to D3 were obtained from female marmoset ERαKD 1, while those in C1 to C3 were obtained from control marmoset 2. Images of ERα-labeling illustrated in C1 to C3 and D1 to D3 were obtained from adjacent coronal sections approximating the rostral-caudal location illustrated in A1. Scale bar in A, 500 μm. Scale bar in B3, 50 μm, also applies to B1 to D3.
Figure 4.
Figure 4.
Black and white illustrations derived from microscopic images (×4 magnification) of rostral-caudal series of coronal brain sections representing ERα-labeled neurons in the preoptic area (POA), mid, and ventral aspects of the ventromedial nucleus (VMNm and VMNv, respectively) and dorsal and ventral aspects of the arcuate nucleus (ARCd and ARCv, respectively) in A1 to A3, an ERα knockdown female marmoset, ERαKD 1, and B1 to B3, a control female marmoset, control 1. Ellipses indicate regions of interest for ERα-labeled cell quantification in A1, POA; B2, VMNm and VMNv; and A3 and B3, ARCd and ARCv. Grayscale dots indicate the location of ERα-labeled neurons. Black dots indicate ERα labeled neurons in the upper 50% of labeling intensity range, while light gray dots indicate neurons in the lighter half of the intensity range. A1 and B1 illustrate coronal brain sections through rostral hypothalamus at the level of the optic chiasm (ox), where the highest density of ERα-labeled neurons is found in the POA. A2 and B2 illustrate coronal brain sections through the central rostral-caudal extent of the hypothalamus that contains the VMN. At slightly more caudal locations, as illustrated in B2, we quantified both VMNm and VMNv subregions of the VMN in which the distribution of ERα-labeled neurons extends ventral to the neighboring optic tract (opt). A3 and B3 illustrate coronal brain sections through the caudal hypothalamus where the highest density of ERα-labeled neurons is found in the ARC. We quantified both an ARCd and an ARCv subregion of ARC in which ERα-labeled neurons extended dorso-laterally. B3 also illustrates the anterior pituitary (PIT) robustly expressing ERα-labeled neurons. Representative ellipses (1000× 500 μm) indicate locations from which ERα-label was quantified for each region of interest. 3V, third ventricle.
Figure 5.
Figure 5.
Mean ± SEM values for 5 control (open bars) and 4 ERαKD (filled bars) adult female marmoset monkeys within 5 mediobasal hypothalamic region of interest values with regard to quantified numbers of ERα immunopositive cells per mm2 and ERα immunopositive intensity within A, POA; B, VMNm; C, VMNv; D, ARCd; and E, ARCv. Statistically significant differences indicating values in ERαKD female marmosets are less than those of controls: a, P = .046; b, P = .040; c, P = .021. ARCd, dorsal arcuate nucleus; ARCv, ventral arcuate nucleus; POA, preoptic area; VMNm, mid-ventromedial nucleus; VMNv, ventral ventromedial nucleus.
Figure 6.
Figure 6.
Mean and SEM of sexual behaviors observed in 8 male-female marmoset monkey pairs, 4 comprising control females (open bars) and 4 comprising ERαKD females (filled bars) for A, distance (cm) female marmosets moved their feet away from their hands following a mount by their male partner, in relation to whether intromission occurred; B, time from test onset until female marmosets behaviorally interacted with their male partners, either receptively or in rejection; C, frequencies of male mounting of their female partners; D, total numbers of receptive postures in response to the male mounting; and E, female sexual rejection of their male partners. *P = .03; **P = .01; ***P = .001 vs controls.
Figure 7.
Figure 7.
Species typical sexual behavior is observed in the behavioral transitions most likely to occur with A, control females. In contrast, B, loss of estradiol action within the ventromedial nucleus (VMN) and arcuate nucleus (ARC) of the hypothalamus of ERαKD female marmosets illustrates the switch in likelihood of behavioral transition from sexual receptivity to absence of female sexual receptivity and rejection. Each black arrow represents a statistically significant (P < .05) transition between connected behaviors. Green circles indicate sexually receptive behavior, blue circles indicate male intromission, and red circles indicate sexual rejection.
Figure 8.
Figure 8.
Mean and SEM, circulating levels of pituitary luteinizing hormone–like chorionic gonadotropin (CG) in 5 control (open symbols) and 5 ERαKD female (filled symbols) marmoset monkeys during months 1 to 12 following study onset: A, circulating levels of CG (ng/mL), and B, changes in circulating CG levels relative to baseline (ng/mL), **P = .002 ERαKD vs controls, all time points combined.
Figure 9.
Figure 9.
Mean and SEM weekly chow allotments provided to 6 male-female pairs from the control female group (open symbols) and 5 male-female pairs from the ERαKD female group (filled symbols) illustrating progressive, parallel increases in chow amounts until month 7 of the study in both female groups. Slopes indicate comparable trajectories of progressive increases in chow allotments to control (gray line: slope = 1.5, r = 0.57) and ERαKD (black line: slope = 1.4, r = 0.76) female groups. After 7 months of study, females were housed separately from their male pairmates during study months 8 to 9 to permit individual calorie consumption evaluation.
Figure 10.
Figure 10.
Mean and SEM calories consumed by A, male-female pairs during study months 1 to 7 comprising 6 female pairmates from the control group (open filled symbols and bars) and 5 from the ERαKD group (filled symbols and bars) as well as area under the curve (AUC) calories consumed by the pairs for the entire 7-month period, and by B, singly housed females comprising 6 from the control female group (open symbols and bars) and 5 from the ERαKD female group (filled symbols and bars) during months 8 to 9 following study onset as well as AUC calories consumed by females alone. *P = .001 vs controls. Y-axes for calories consumed per day in panels A and B commence at 150 and 100, respectively, to better appreciate consistent lower calorie consumption by the ERαKD female group.
Figure 11.
Figure 11.
Comparable mean and SEM A, percentage of female body weight change from baseline, and B, area under the curve percentage female body weight mass during study months −1 to 9 in 6 control (open symbols and bars) and 5 ERαKD (filled symbols and bars) female marmoset monkeys.
Figure 12.
Figure 12.
Comparable mean and SEM of A, hourly frequencies for locomotor activity exhibited by 6 control (open symbols and bars) and 5 ERαKD (filled symbols and bars) female marmoset monkeys during the 24-hour light-dark period across a 21-day period during study month 6, in addition to area under the curve of frequencies of locomotor activity during B, 12 hours daytime (P = .292; between female groups); C, 12 hours nighttime (P = .560; between female groups); and D, the 24-hour time period (P = .798; between female groups).
Figure 13.
Figure 13.
Mean and SEM of A, circulating glucose levels during a 120-minute oral glucose tolerance test (OGTT) administered immediately following 0 minutes, and B, area under the curve (AUC) glucose during the OGTT in 6 control (open symbols and bars) and 5 ERαKD (filled symbols and bars) female marmoset monkeys. AUC glucose was elevated (*P = .001) in ERαKD compared to control females.

Similar articles

References

    1. Kendrick KM, Dixson AF. The effect of the ovarian cycle on the sexual behaviour of the common marmoset (Callithrix jacchus). Physiol Behav. 1983;30(5):735‐742. - PubMed
    1. Michael RP, Richter MC, Cain JA, Zumpe D, Bonsall RW. Artificial menstrual cycles, behaviour and the role of androgens in female rhesus monkeys. Nature. 1978;275(5679):439‐440. - PubMed
    1. Wallen K, Winston LA, Gaventa S, Davis-DaSilva M, Collins DC. Periovulatory changes in female sexual behavior and patterns of ovarian steroid secretion in group-living rhesus monkeys. Horm Behav. 1984;18(4):431‐450. - PubMed
    1. Wallen K. Desire and ability: hormones and the regulation of female sexual behavior. Neurosci Biobehav Rev. 1990;14(2):233‐241. - PubMed
    1. Jones BC, Hahn AC, Fisher CI, Wang H, Kandrik M, DeBruine LM. General sexual desire, but not desire for uncommitted sexual relationships, tracks changes in women's hormonal status. Psychoneuroendocrinology. 2018;88:153‐157. - PubMed

LinkOut - more resources