. 2025 Feb 5;15(5):3749-3755.
doi: 10.1039/d4ra04194a. eCollection 2025 Jan 29.

Proof of concept for brain organoid-on-a-chip to create multiple domains in forebrain organoids

Affiliations

Proof of concept for brain organoid-on-a-chip to create multiple domains in forebrain organoids

Yuan-Chen Tsai et al. RSC Adv. .

Abstract

Brain organoids are three-dimensionally reconstructed brain tissue derived from pluripotent stem cells in vitro. 3D tissue cultures have opened new avenues for exploring development and disease modeling. However, many physiological conditions, including signaling gradients in 3D cultures, have not yet been easily achieved. Here, we introduce brain organoid-on-a-chip platforms that generate signaling gradients that in turn enable the induction of topographic forebrain organoids. This creates a more continuous spectrum of brain regions and provides a more complete mimic of the human brain for evaluating neurodevelopment and disease in unprecedented detail.


Conflict of interest statement

The University of California, Irvine (MW and KK) obtained a US patent (Patent No. US12054698B2) on the brain organoid-on-a-chip devices. The rest of the authors declare no competing interests.

Figures

Fig. 1
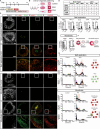
Fig. 1. Brain organoid on a Chip. (A) Conceptual illustration of brain-organoid-on-a-chip (BOoC) to form a forebrain organoid with multiple domains. During forebrain development, signaling molecules (morphogen), such as BMPs and SHH, are secreted from signaling centers, the roof plate (RP) and floor plate (FR) respectively. The signaling gradients are formed to specify diverse brain regions including the dorsal midline telencephalon (DMT), cortex, lateral ganglionic eminence (LGE), and medial ganglionic eminence (MGE). (B and C) BOoC consists with 5 layers, including 3 microfluidic layers made of polydimethylsiloxane (PDMS) and 2 PET porous membranes. (D) An actual brain organoid on a chip introduced with colored food dyes to visualize microfluidic channels. (E) Fluorescent micrographs of agarose gel stained with fluorescent dye (AMCA-X) introduced by one of four inlets to visualize the concentration gradient in a gel. Scale bars represent 1 mm. (F) Quantitative fluorescent profiling of AMCA-X measured at the white arrow in E.
Fig. 2
Fig. 2. Generating topographic organization in the forebrain organoids. (A) The illustration of culture conditions for the cerebral brain organoids from day 0–35. (B) The schematic diagram of the experimental design. The SAG exposure, either with bath application or using microfluidic chips, was carried out from 15–21 days in culture. (C) Immunohistochemical analyses of forebrain organoids from bath control, bath SAG, microfluidic control and microfluidic SAG groups. Organoids from control and experimental groups were sectioned and stained for region- and cell-type-specific markers. Lower panels: zoom-in images of the box regions. Cortex marker: EMX1; GE markers: DLX5 and OLIG2; MGE markers: LHX6, NKX2.1; Inhibitory neuron marker: GAD65. Scale bars: 250 μm (whole), 50 μm (zoom-in). (D) List of cell-type- and region-specific markers used in this study and their expression patterns. (E) Percentage of live cells with region-specific markers in organoids from bath application control (n = 8), bath SAG (n = 8), and microfluidic control (n = 3) and microfluidic SAG (n = 4). Ctrl: control, Unexp: unexposed side, exp: exposed side. Bath application statistics: unpaired t-Test. Microfluidic chip statistics: one-way ANOVA. *p ≤ 0.05, **p ≤ 0.01. (F) Illustrations of topographic quantifications of organoids from bath application groups and microfluidic chips. Fluorescent intensity is measured across the organoids from edge to edge. Height of the box: 250 μm. (G) Topographic quantifications of cell-type- and region-specific markers in organoids from bath application control (n = 5), SAG (n = 5), microfluidic control (n = 3), and microfluidic SAG (n = 4, n = 2 showed NKX2.1 expression). Illustrations (bottom panels) show the regional identities of the organoids. FI: fluorescent intensity, a. u.: arbitrary unit.

Update of

References

    1. Eiraku M. Watanabe K. Matsuo-Takasaki M. Kawada M. Yonemura S. Matsumura M. Wataya T. Nishiyama A. Muguruma K. Sasai Y. Cell Stem Cell. 2008;3:519–532. doi: 10.1016/j.stem.2008.09.002. - DOI - PubMed
    1. Lancaster M. A. Renner M. Martin C. A. Wenzel D. Bicknell L. S. Hurles M. E. Homfray T. Penninger J. M. Jackson A. P. Knoblich J. A. Nature. 2013;501:373–379. - PMC - PubMed
    1. Kadoshima T. Sakaguchi H. Nakano T. Soen M. Ando S. Eiraku M. Sasai Y. Proc. Natl. Acad. Sci. U. S. A. 2013;110:20284–20289. doi: 10.1073/pnas.1315710110. - DOI - PMC - PubMed
    1. Watanabe M. Buth J. E. Vishlaghi N. de la Torre-Ubieta L. Taxidis J. Khakh B. S. Coppola G. Pearson C. A. Yamauchi K. Gong D. Dai X. Damoiseaux R. Aliyari R. Liebscher S. Schenke-Layland K. Caneda C. Huang E. J. Zhang Y. Cheng G. Geschwind D. H. Golshani P. Sun R. Novitch B. G. Cell Rep. 2017;21:517–532. doi: 10.1016/j.celrep.2017.09.047. - DOI - PMC - PubMed
    1. Wurst W. Bally-Cuif L. Bally-Cuif L. Nat. Rev. Neurosci. 2001;2(2):99–108. doi: 10.1038/35053516. - DOI - PubMed