. 2025 Jul;247(1):29-51.
doi: 10.1111/joa.14227. Epub 2025 Feb 6.

Exploration of the covariation signal between cortical bone and dentine volumes across the upper limb bones and anterior teeth in modern humans and relevance to evolutionary anthropology

Affiliations

Exploration of the covariation signal between cortical bone and dentine volumes across the upper limb bones and anterior teeth in modern humans and relevance to evolutionary anthropology

Mathilde Augoyard et al. J Anat. 2025 Jul.

Abstract

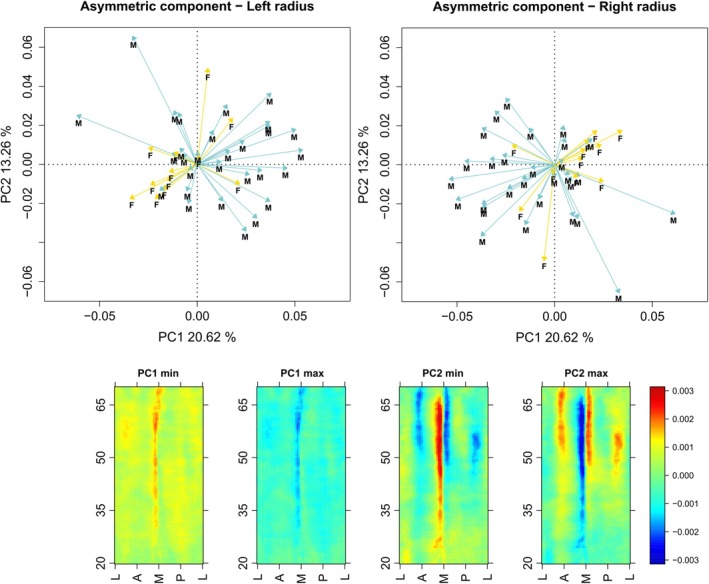
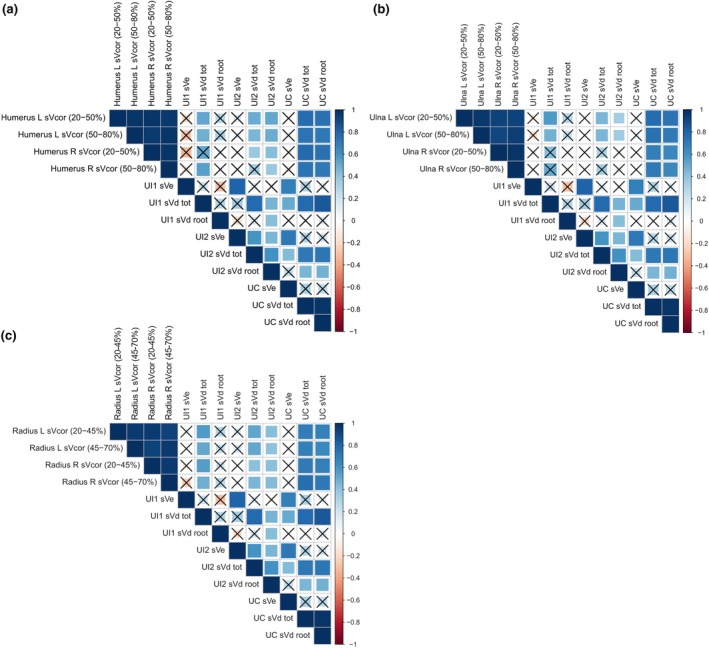
Cortical bone and dentine are two mineralized tissues sharing a common embryological origin, developmental, and genetic background, distinct from those of enamel. Understanding their relationship is crucial to decipher the factors acting on their postnatal development, and shedding light on the evolutionary patterns of tissue proportions. Here, we investigate the coordinated variation between cortical bone and dentine volumes measured from arm and forearm bones (humeri, ulnae, radii) and upper anterior teeth (central incisors, lateral incisors, canines) of modern humans. Given the shared characteristics of cortical bone and dentine, we expect similarities in their postnatal development, which may lead to covariation between their volumes. The degree of bone-dentine covariation may be influenced by the physiological response of upper limb bones to mechanical loading. No such covariation is expected with enamel volumes, due to the greater developmental independence of bone and enamel. Our sample includes 55 adults of African and European ancestries from South African osteological collections. Principal component analysis of cortical thickness variation along the shafts of paired humeri, ulnae, and radii is used to assess asymmetry. Bone regions with bilateral asymmetry in cortical bone thickness are considered sensitive to functional loads, while regions with minimal bilateral variation likely reflect genetic influences during bone postnatal development. Statistical analyses reveal strong positive correlations between cortical bone and dentine volumes across all bones and teeth, and weaker correlations between cortical bone and enamel. We outline a complex pattern of bone-dentine covariation that varies by skeletal location and tooth type. Contrary to our expectations, the presumed functional sensitivity of bone regions does not influence the covariation signal. Additionally, the strength of the covariation appears to align with the developmental sequence of the anterior teeth, with the upper canines showing the strongest correlation with cortical bone volumes, followed by lateral and central incisors. These results provide insights into the functional and biological factors influencing the coordinated variation of cortical bone and dentine volumes during postnatal development. Further research on the cortical bone-dentine covariation across different skeletal parts, including lower limb elements, would enhance our understanding of the effects of both endogenous and exogenous factors on the development of the mineralized tissues.

Keywords: cortical bone; covariation; dentine; development; modern humans.


Conflict of interest statement

The authors declare no conflict of interest.

Figures

FIGURE 1
FIGURE 1
Data processing for the humeri in morphomap. (a) Position of the 120 cross‐sections on outer surface (in yellow) and medullary cavity (in red) meshes of the humerus, for the 20%–80% bone region. At each cross‐section, 60 paired equiangular semilandmarks were set on the external (black spheres) and internal (red spheres) outlines, centered at the center of the cortical area. (b) Cortical bone volume computable from the 3D coordinates of the internal and external semilandmarks. (c) Two‐dimensional morphometric map of scaled cortical thickness variation along the 20%–80% region of the humerus shaft. X axis of the 2D morphometric map: unfolded projection starting and ending at the lateral (L), passing through the anterior (A), medial (M), and posterior (P) aspects of the shaft. Y axis: the percentage of the humerus biomechanical length. The colors indicate the cortical bone thickness and range from dark blue (thinnest) to dark red (thickest).
FIGURE 2
FIGURE 2
Data processing for the anterior teeth in Toothnroll. (a) Position of the 80 cross‐sections on dentine (in yellow) and pulp (in red) meshes of the upper canine, for the 10‐50% root region. At each cross‐section, 50 paired equiangular semilandmarks were set on the external (black spheres) and internal (red spheres) outlines, centered at the center of the dentine area. (b) Radicular dentine volume computable from the 3D coordinates of the internal and external semilandmarks. (c) Two‐dimensional morphometric map of scaled dentine thickness variation along the 10%–50% root region. X axis of the 2D morphometric map: unfolded projection starting and ending at the lingual (Li) border, passing through the mesial (Mes), buccal (Bu), and distal (d) borders of the root. Y axis: the percentage of the total root length. The colors indicate the dentine thickness and range from dark blue (thinnest) to dark red (thickest). These outputs are similar for central and lateral incisors.
FIGURE 3
FIGURE 3
PCA of cortical thickness variation along the shafts of 31 pairs of humeri in male and female individuals, relative to a state of perfect symmetry. The distance of each humerus from the axis origin (indicating zero asymmetry between the right and left sides) reflects the degree of asymmetry in cortical thickness. Female humeri are represented in yellow, while male humeri are shown in blue. 2D morphometric maps illustrating the extreme conditions along PC1 and PC2 are provided. The X‐axis represents the unfolded projection starting and ending at the lateral (L) aspect, passing through the anterior (A), medial (M), and posterior (P) aspects of the shaft. The Y‐axis represents the percentage of the humerus biomechanical length. The colors indicate the cortical bone thickness and range from dark blue (thinnest) to dark red (thickest).
FIGURE 4
FIGURE 4
PCA of cortical thickness variation along the shafts of 38 pairs of ulnae in male and female individuals, relative to a state of perfect symmetry. The distance of each ulna from the axis origin (indicating zero asymmetry between the right and left sides) reflects the degree of asymmetry in cortical thickness. Female ulnae are represented in yellow, while male ulnae are shown in blue. 2D morphometric maps illustrating the extreme conditions along PC1 and PC2 are provided. The X‐axis represents the unfolded projection starting and ending at the lateral (L) aspect, passing through the anterior (A), medial (M), and posterior (P) aspects of the shaft. The Y‐axis represents the percentage of the ulna biomechanical length. The colors indicate the cortical bone thickness and range from dark blue (thinnest) to dark red (thickest).
FIGURE 5
FIGURE 5
PCA of cortical thickness variation along the shafts of 41 pairs of radii in male and female individuals, relative to a state of perfect symmetry. The distance of each radius from the axis origin (indicating zero asymmetry between the right and left sides) reflects the degree of asymmetry in cortical thickness. Female radii are represented in yellow, while male radii are shown in blue. 2D morphometric maps illustrating the extreme conditions along PC1 and PC2 are provided. The X‐axis represents the unfolded projection starting and ending at the lateral (L) aspect, passing through the anterior (A), medial (M), and posterior (P) aspects of the shaft. The Y‐axis represents the percentage of the radius biomechanical length. The colors indicate the cortical bone thickness and range from dark blue (thinnest) to dark red (thickest).
FIGURE 6
FIGURE 6
Significant differences in scaled dentine thickness along the root, depending on the tooth wear degree of anterior teeth. The figure shows maps of R2 and beta coefficients obtained from multiple regression analyses, with the 2D MMs of scaled 10%–50% radicular dentine as dependent variables and tooth wear as independent variable. Top row: maps obtained from 2D MMs of upper central incisor, middle row: maps obtained from 2D MMs of upper lateral incisor, bottom row: maps obtained from 2D MMs of upper canine. R2 highlights root regions showing dentine thickness variation relative to wear degree and range is reported using the viridis palette. Beta coefficient indicates the rate of change in dentine thickness for increasing wear degree and range is reported using a rainbow palette. Warm colors indicate significantly thicker dentine thickness, while cool colors indicate significantly thinner dentine thickness with increasing tooth wear. White cells indicate statistically insignificant relationships. UI1, permanent upper central incisor; UI2, permanent upper lateral incisor; UC, permanent upper canine.
FIGURE 7
FIGURE 7
Boxplots of the scaled cortical bone volumes measured for the different regions of the humerus, ulna, and radius and compared between sexes (first row). Boxplots of the scaled enamel and dentine volumes measured on the anterior teeth and compared between sexes (second row). A single asterisk indicates a moderately significant difference (0.01< p‐values <0.05) and two asterisks indicate highly significant difference (p‐values <0.01), according to the Wilcoxon test. F, female; M, male; inf 40y, individual aged less than 40 years; sup 40y, individual aged over 40 years; R; right; L, left; ns, non‐significant Wilcoxon test p‐value; sVcor, the scaled volume of cortical bone for a specific bone region (mm2); sVe, the scaled volume of enamel (mm2); sVd tot, the scaled total volume of dentine (mm2); sVd root, the scaled volume of radicular dentine for the 10%–50% root region (mm2); UI1, permanent upper central incisor; UI2, permanent upper lateral incisor; UC, permanent upper canine.
FIGURE 8
FIGURE 8
Correlation matrices between scaled cortical bone volumes measured from the humerus (a), ulna (b), and radius (c) regions of interest, and the scaled dental volumes. Variables exhibiting strong positive correlations are highlighted in dark blue. Black crosses indicate non‐significant correlation coefficients according to the Spearman correlation test. Spearman coefficient values and their associated p‐values are provided in Table 1. L, left; R, right; sVcor, the scaled volume of cortical bone for a specific bone region (mm2); sVe, the scaled volume of enamel (mm2); sVd tot, the scaled total volume of dentine (mm2); sVd root, the scaled volume of radicular dentine for the 10%–50% root region (mm2); UI1, permanent upper central incisor; UI2, permanent upper lateral incisor; UC, permanent upper canine.

References

    1. Allen, M.R. & Burr, D.B. (2019) Bone Growth, Modeling, and Remodeling. In: Burr, D.B. & Allen, M.R. (Eds.) Basic and Applied Bone Biology, 2nd edition. Amsterdam, The Netherlands: Academic Press, pp. 85–100.
    1. AlQahtani, S.J. , Hector, M.P. & Liversidge, H.M. (2010) Brief communication: The London atlas of human tooth development and eruption. American Journal of Biological Anthropology, 142(3), 481–490. Available from: 10.1002/ajpa.21258 - DOI - PubMed
    1. Alvesalo, L. (1997) Sex chromosomes and human growth. Human Genetics, 101(1), 1–5. Available from: 10.1007/s004390050575 - DOI - PubMed
    1. Alvesalo, L. , Tammisalo, E. & Therman, E. (1987) 47,XXX females, sex chromosomes, and tooth crown structure. Human Genetics, 77(4), 345–348. Available from: 10.1007/BF00291424 - DOI - PubMed
    1. Antón, S.C. & Middleton, E.R. (2023) Making meaning from fragmentary fossils: Early Homo in the Early to early Middle Pleistocene. Journal of Human Evolution, 179, 103307. Available from: 10.1016/j.jhevol.2022.103307 - DOI - PubMed

LinkOut - more resources