. 2025 Mar 5;69(3):e0151824.
doi: 10.1128/aac.01518-24. Epub 2025 Feb 6.

Prediction of higher ceftazidime-avibactam concentrations in the human renal interstitium compared with unbound plasma using a minimal physiologically based pharmacokinetic model developed in rats and pigs through microdialysis

Affiliations

Prediction of higher ceftazidime-avibactam concentrations in the human renal interstitium compared with unbound plasma using a minimal physiologically based pharmacokinetic model developed in rats and pigs through microdialysis

Maxime Vallée et al. Antimicrob Agents Chemother. .

Abstract

Last resort antibiotics, like ceftazidime-avibactam (CZA), were used to treat urinary tract infections caused by multidrug-resistant bacteria. However, no data on tissue distribution were available. Our aim was to describe the in vivo kidney distribution of CZA in healthy rats and pigs using a physiologically based pharmacokinetic model (PBPK). Microdialysis probes were inserted into the blood, muscle, and kidney of both species. The experiment started with a retrodialysis by drug period. An i.v. single dose of CZA was administered. Samples were collected for 3 h in rats and 7 h in pigs. A PBPK model was developed to describe tissue and blood CZA pharmacokinetics in animals and to predict human concentrations. The PBPK model adequately described CZA rat and pig data in each tissue and blood. In both species, the concentration profiles of CZA in muscle and blood were almost superimposed, with muscle-to-plasma area under the curve (AUC) ratios close to one. However, kidney CZA concentrations were higher than those in blood, as indicated by kidney-to-plasma AUC ratios exceeding one (respectively 2.27 in rats and 2.63 in pigs for ceftazidime [CAZ]; 2.7 in rats and 4.5 in pigs for avibacam [AVI]). Prediction of human concentrations led to same observations. This study demonstrated an excellent penetration of CZA into the renal parenchyma of rats and pigs. Our PBPK model adequately described the data, and AUCs were higher in the renal cortex interstitium compared with unbound plasma. Our data suggested that the joint PK/PD target for CZA in humans could be attained with reduced CZA doses.

Keywords: ceftazidime–avibactam; microdialysis; pharmacokinetics; physiologically based pharmacokinetic model; urinary tract infection.


Conflict of interest statement

The authors declare no conflict of interest.

Figures

Fig 1
Fig 1
CAZ model fits in rats. Points: observed concentrations, solid line: median of model simulations, dashed lines: 5th and 95th percentiles of model simulations. Prediction interval based on 1,000 simulations. Microdialysis concentrations (points) are shown at midpoint of the collection interval to reflect the fact that they represent average concentrations during the collection interval.
Fig 2
Fig 2
CAZ model fit in pigs. Points: observed concentrations, solid line: median of model simulations, dashed lines: 5th and 95th percentiles of model simulations. Prediction interval based on 1,000 simulations. Microdialysis concentrations (points) are shown at midpoint of the collection interval to reflect the fact that they represent average concentrations during the collection interval.
Fig 3
Fig 3
AVI model fit in rats. Points: observed concentrations, solid line: median of model simulations, dashed lines: 5th and 95th percentiles of model simulations. Prediction interval based on 1,000 simulations. Microdialysis concentrations (points) are shown at midpoint of the collection interval to reflect the fact that they represent average concentrations during the collection interval.
Fig 4
Fig 4
AVI model fit in pigs. Points: observed concentrations, solid line: median of model simulations, dashed lines: 5th and 95th percentiles of model simulations. Prediction interval based on 1,000 simulations. Microdialysis concentrations (points) are shown at midpoint of the collection interval to reflect the fact that they represent average concentrations during the collection interval.
Fig 5
Fig 5
Simulated unbound CAZ (a and c) and AVI (b and d) concentrations in human plasma (orange line) and renal cortex interstitium (green line) following the standard CZA dosing regimens of 2 g/0.5 g q8 h (upper panels) and a reduced regimen of 1 g/0.25 g q8 h (lower panels). The orange shaded area represents the 90% CI of 1,000 simulations performed with the Li et al. (9) population PK model.
Fig 6
Fig 6
Proportion of the dosing interval during which the unbound CAZ concentration in the plasma and renal cortex exceeds the target bacteria’s MIC for both current (2 g q8 h) (a) and reduced (1 g q8 h) (b) dosing regimens. Dashed line represents 50% fT > MIC the current EUCAST target for CAZ (10).
Fig 7
Fig 7
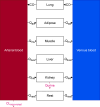
General structure of the PBPK model. CO: cardiac output, Qad: blood flow to adipose tissue, Qmu: blood flow to muscles, Qliver: blood flow to liver, Qkid: blood flow to kidneys, Qrest: blood flow to the rest of body compartment, Qurine: urinary flow, CLnon-renal: non renal clearance.
Fig 8
Fig 8
Detailed structure of the muscle compartment. Qmu: blood flow to muscles.
Fig 9
Fig 9
Detailed structure of the kidney compartment. Qkid: blood flow to kidneys, Qurine: urinary flow, PT: proximal tubule, DLH: descending loop of Henlé, ALH: ascending loop of Henlé, DT: distal tubule, CD: collecting duct. Green: tubular lumen compartments, light blue: interstitium compartments, red: blood vessel compartments.

References

    1. Foxman B. 2010. The epidemiology of urinary tract infection. Nat Rev Urol 7:653–660. doi:10.1038/nrurol.2010.190 - DOI - PubMed
    1. Cassini A, Högberg LD, Plachouras D, Quattrocchi A, Hoxha A, Simonsen GS, Colomb-Cotinat M, Kretzschmar ME, Devleesschauwer B, Cecchini M, Ouakrim DA, Oliveira TC, Struelens MJ, Suetens C, Monnet DL, Burden of AMR Collaborative Group . 2019. Attributable deaths and disability-adjusted life-years caused by infections with antibiotic-resistant bacteria in the EU and the European Economic Area in 2015: a population-level modelling analysis. Lancet Infect Dis 19:56–66. doi:10.1016/S1473-3099(18)30605-4 - DOI - PMC - PubMed
    1. Vallée M, Bruyère F, Roblot F, Brureau L. 2017. Place de la témocilline dans le traitement des infections urinaires. Progrès en Urologie 27:609–617. doi:10.1016/j.purol.2017.07.242 - DOI - PubMed
    1. Klein EY, Van Boeckel TP, Martinez EM, Pant S, Gandra S, Levin SA, Goossens H, Laxminarayan R. 2018. Global increase and geographic convergence in antibiotic consumption between 2000 and 2015. Proc Natl Acad Sci U S A 115:E3463–E3470. doi:10.1073/pnas.1717295115 - DOI - PMC - PubMed
    1. Chapelle C, Gaborit B, Dumont R, Dinh A, Vallée M. 2021. Treatment of UTIs due to Klebsiella pneumoniae carbapenemase-producers: how to use new antibiotic drugs? A narrative review. Antibiotics (Basel) 10:1332. doi:10.3390/antibiotics10111332 - DOI - PMC - PubMed

LinkOut - more resources