. 2025 Jul;398(7):9177-9198.
doi: 10.1007/s00210-025-03837-1. Epub 2025 Feb 6.

Novel mechanistic insights of the potential role of gasotransmitters and autophagy in the protective effect of metformin against hepatic ischemia/reperfusion injury in rats

Affiliations

Novel mechanistic insights of the potential role of gasotransmitters and autophagy in the protective effect of metformin against hepatic ischemia/reperfusion injury in rats

Ahmed O Abdel-Zaher et al. Naunyn Schmiedebergs Arch Pharmacol. 2025 Jul.

Abstract

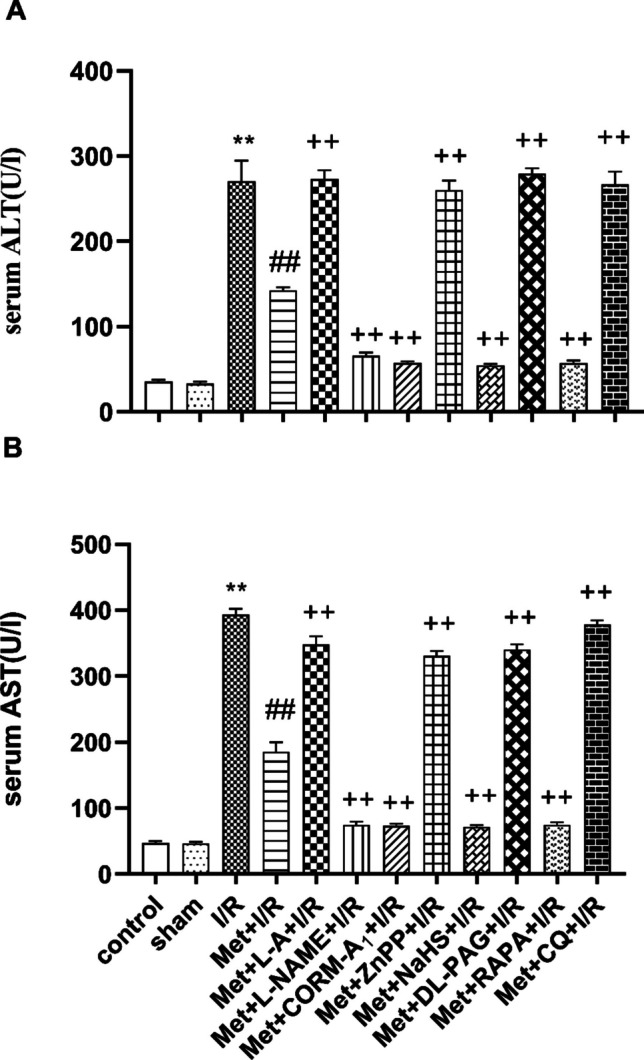
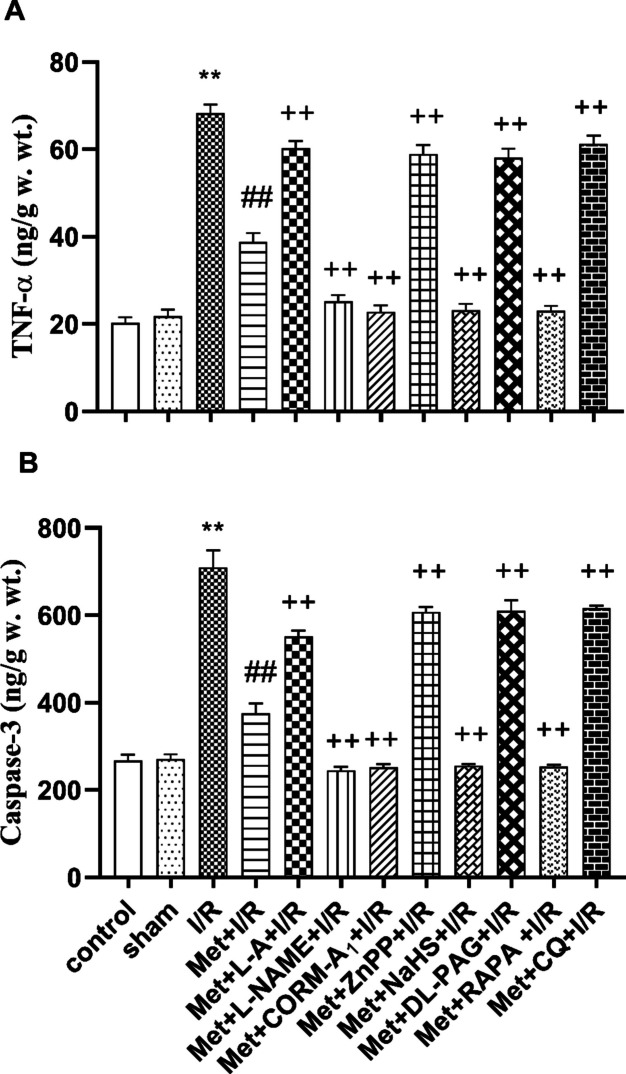
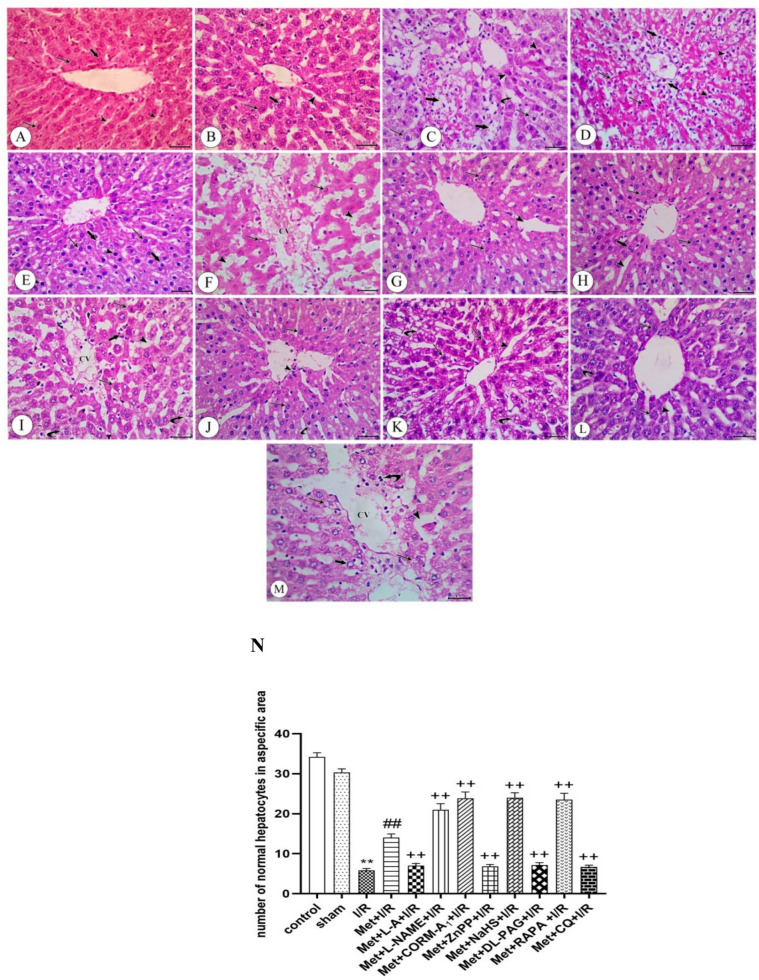
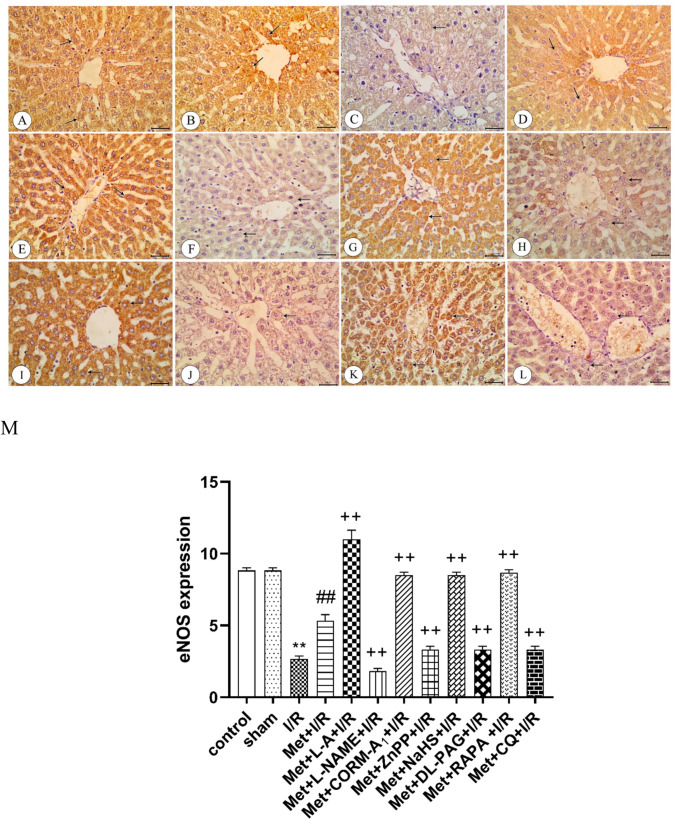
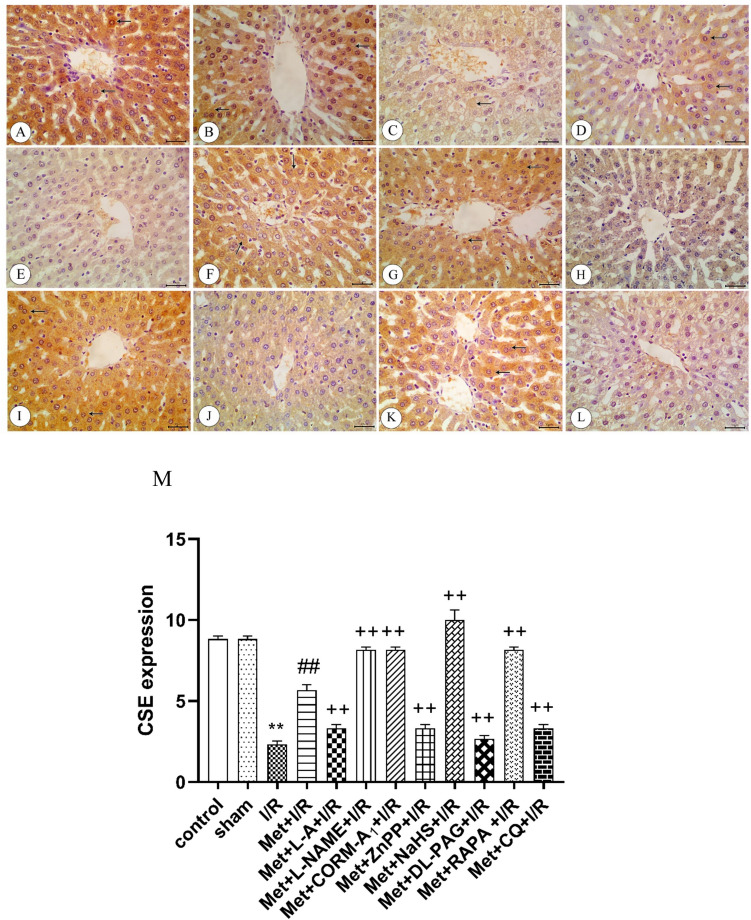
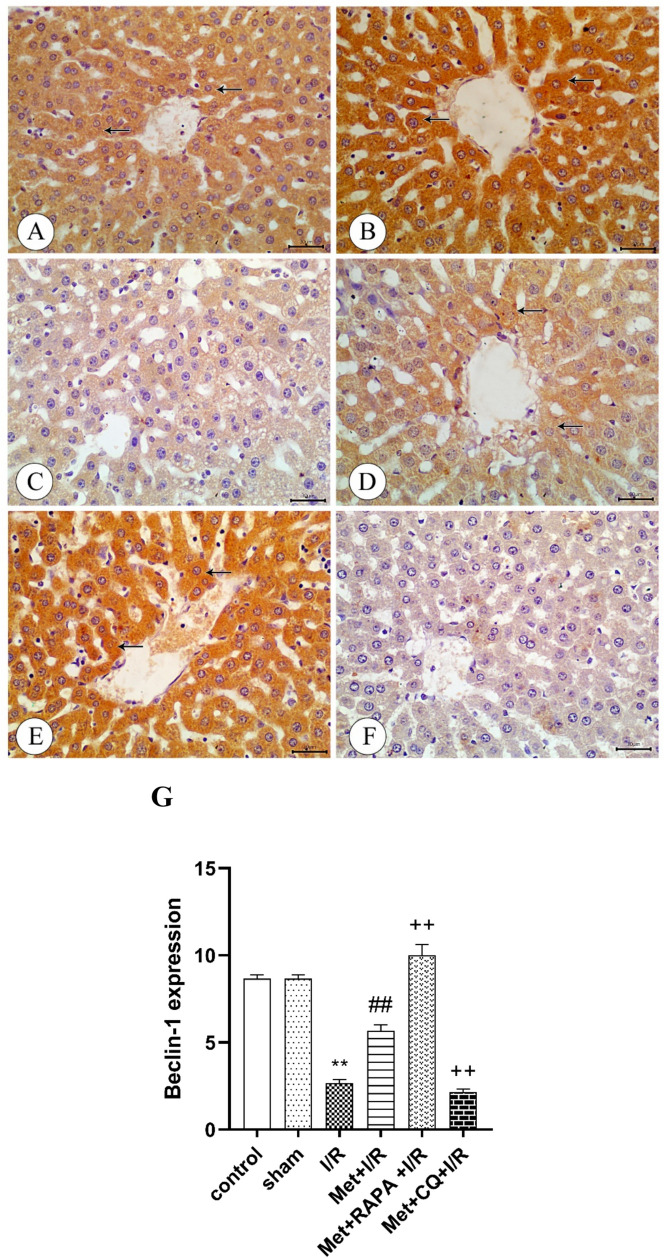
Metformin exerts antidiabetic and pleiotropic effects. This study investigated the function and mechanisms of gasotransmitters and autophagy in the metformin-induced protection against ischemia/reperfusion injury (I/RI). According to measurements of serum hepatic function indicators and histopathological evaluation, metformin protected against hepatic I/RI-induced impairment of liver function and structure. In addition, metformin inhibited hepatic I/RI-induced hepatic oxidative stress, nitrosative stress, inflammation, and apoptosis. Also, it suppressed hepatic I/RI-induced decrease in hepatic heme oxygenase-1 (HO-1) and hydrogen sulfide (H2S) levels and increase in nitric oxide (NO) production. Furthermore, metformin inhibited hepatic I/RI-induced decrease in protein expressions of endothelial NO synthase (eNOS), HO-1, cystathionine γ-lyase (CSE), and Beclin-1 and increase in the protein expression of inducible NO synthase (iNOS) in the liver tissue. Co-administration of the NO biosynthesis inhibitor, L-NAME, carbon monoxide(CO)-releasing molecule-A1 (CORM-A1), the H2S donor, NaHS, or the autophagy stimulator, rapamycin (RAPA), enhanced all effects of metformin. The NO donor, L-arginine, the CO biosynthesis inhibitor, zinc protoporphyrin, the H2S biosynthesis inhibitor, DL-propargylglycine, or the autophagy inhibitor, chloroquine (CQ), antagonized the effects of metformin. These findings reveal, for the first time, that increasing CO, H2S, and autophagy levels with subsequent decreasing NO level play a critical role in metformin's protective action against hepatic I/RI. The ability of L-NAME, CORM-A1, NaHS, and RAPA to boost metformin's protective effect in hepatic I/RI may positively be attributed to their ability to lower hepatic oxidative stress, nitrosative stress, inflammation, and apoptosis.

Keywords: Autophagy; CO; H2S; Hepatic ischemia/reperfusion injury (I/RI); Metformin; NO.


Conflict of interest statement

Declarations. Ethics approval: The experiments reported here were approved by our Institutional Ethics Committee (ethical approval No. 17300541, 2020). Conflict of interest: The authors declare no competing interests.

Figures

Fig. 1
Fig. 1
Effect of concomitant administration of nitric oxide (NO), carbon monoxide (CO), hydrogen sulfide (H2S), or autophagy modulators with 200 mg/kg/day metformin (Met) i.p. to rats for 6 successive days before induction of ischemia and promptly at the onset of reperfusion on the serum A alanine aminotransferase (ALT) and B aspartate aminotransferase (AST) levels. Animals were treated with 100 mg/kg/day L-arginine (L-A), 10 mg/kg/day L-N(G)-nitroarginine methyl ester (L-NAME), 0.1 mg/kg/day carbon monoxide releasing molecule-A1 (CORM-A1), 0.25 mg/kg/day zinc protoporphyrin (ZnPP), 3 mg/kg/day sodium hydrosulfide (NaHS), 5 mg/kg/day DL-propargylglycine (DL-PAG), 1 mg/kg/day rapamycin (RAPA), or 10 mg/kg/day chloroquine (CQ) i.p. concomitantly with Met. To induce hepatic I/R, the rats were subjected to 1 h of ischemia followed by 2 h of reperfusion. Blood samples were collected for biochemical measurements at the end of experimental duration. Each value represents the mean ± S.E.M. of 6 observations. **p< 0.01 vs. control and sham values; ##p<0.01 vs. I/R values; ++p<0.01 vs. Met+I/R values
Fig. 2
Fig. 2
Effect of concomitant administration of nitric oxide (NO), carbon monoxide (CO), hydrogen sulfide (H2S), or autophagy modulators with 200 mg/kg/day metformin (Met) i.p. to rats for 6 successive days before induction of ischemia and promptly at the onset of reperfusion on the A malondialdehyde (MDA) and B intracellular reduced glutathione (GSH) levels. Animals were treated with 100 mg/kg/day L-arginine (L-A), 10 mg/kg/day L-N(G)-nitroarginine methyl ester (L-NAME), 0.1 mg/kg/day carbon monoxide releasing molecule-A1 (CORM-A1), 0.25 mg/kg/day zinc protoporphyrin (ZnPP), 3 mg/kg/day sodium hydrosulfide (NaHS), 5 mg/kg/day DL-propargylglycine (DL-PAG), 1 mg/kg/day rapamycin (RAPA), or 10 mg/kg/day chloroquine (CQ) i.p. concomitantly with Met. To induce hepatic I/R, the rats were subjected to 1 h of ischemia followed by 2 h of reperfusion. Liver tissue was collected for biochemical measurements at the end of experimental duration. Each value represents the mean ± S.E.M. of 6 observations. **p< 0.01 vs. control and sham values; ##p<0.01 vs. I/R values; +p<0.05 vs. Met+ IR values; ++p<0.01 vs. Met+I/R values
Fig. 3
Fig. 3
Effect of concomitant administration of nitric oxide (NO), carbon monoxide (CO), hydrogen sulfide (H2S) or autophagy modulators with 200 mg/kg/day metformin (Met) i.p. to rats for 6 successive days before induction of ischemia and promptly at the onset of reperfusion on the A tumor necrosis factor-alpha (TNF-α) and B caspase-3 levels. Animals were treated with 100 mg/kg/day L-arginine (L-A), 10 mg/kg/day L-N(G)-nitroarginine methyl ester (L-NAME), 0.1 mg/kg/day carbon monoxide releasing molecule-A1 (CORM-A1), 0.25 mg/kg/day zinc protoporphyrin (ZnPP), 3 mg/kg/day sodium hydrosulfide (NaHS), 5 mg/kg/day DL-propargylglycine (DL-PAG), 1 mg/kg/day rapamycin (RAPA), or 10 mg/kg/day chloroquine (CQ) i.p. concomitantly with Met. To induce hepatic I/R, the rats were subjected to 1 h of ischemia followed by 2 h of reperfusion. Liver tissue was collected for biochemical measurements at the end of experimental duration. Each value represents the mean ± S.E.M. of 6 observations. **p< 0.01 vs. control and sham values; ##p<0.01 vs. I/R values; ++p<0.01 vs. Met+I/R values
Fig. 4
Fig. 4
Effect of concomitant administration of nitric oxide (NO), carbon monoxide (CO), hydrogen sulfide (H2S), or autophagy modulators with 200 mg/kg/day metformin (Met) i.p. to rats for 6 successive days before induction of ischemia and promptly at the onset of reperfusion on the A nitrite, B heme oxygenase-1 (HO-1), and C hydrogen sulfide (H2S) levels. Animals were treated with 100 mg/kg/day L-arginine (L-A), 10 mg/kg/day L-N(G)-nitroarginine methyl ester (L-NAME), 0.1 mg/kg/day carbon monoxide releasing molecule-A1 (CORM-A1), 0.25 mg/kg/day zinc protoporphyrin (ZnPP), 3 mg/kg/day sodium hydrosulfide (NaHS), 5 mg/kg/day DL-propargylglycine (DL-PAG), 1 mg/kg/day rapamycin (RAPA), or 10 mg/kg/day chloroquine (CQ) i.p. concomitantly with Met. To induce hepatic I/R, the rats were subjected to 1 h of ischemia followed by 2 h of reperfusion. Liver tissue was collected for biochemical measurements at the end of experimental duration. Each value represents the mean ± S.E.M. of 6 observations. **p< 0.01 vs. control and sham values; ##p<0.01 vs. I/R values; +p<0.05 vs. Met+IR values; ++p<0.01 vs. Met+I/R values
Fig. 5
Fig. 5
photomicrographs of representative liver sections from A control and B sham rats: showing normal hepatic architecture with hepatocytes arranged in branching and anastomosing cords separated by blood sinusoids (arrow heads). Hepatocytes have central rounded vesicular nuclei and acidophilic cytoplasm (arrows). Few cells appear binucleated (thick arrow). C I/R rats showing loss of normal architecture of hepatocytes. Most of hepatocytes appear degenerated with cytoplasmic vacuolations (arrows); other appear with deeply stained cytoplasm and deeply stained irregular nuclei (arrow head). Some hepatocytes are ballooned with remnants of cytoplasm and the nuclei either deeply stained or absent and the fused cells with no cell boundaries (thick arrows). Dilated blood sinusoids in between hepatic cords are also detected (curved arrow). D I/R rats showing disrupted liver architecture with inflammatory cell infiltration (arrow head). Most of hepatocytes appear with deeply stained acidophilic cytoplasm and lost their boundaries with deeply stained nuclei (arrows). Other appear vacuolated especially around central vein (thick arrow). E I/R rats were treated with Met showing improvement of the general architecture of liver, most of hepatocytes appear with acidophilic cytoplasm and central vesicular nuclei (arrows), but others appear with deeply stained nuclei (arrow heads). Some hepatocytes show cytoplasmic vacuolations (thick arrows). F I/R rats treated with Met+L-A showing marked disruption in the normal architecture of the liver with distorted congested central vein (CV). Most of hepatocytes appear with deeply stained cytoplasm and irregular shaped nuclei (arrows). Dilated, disturbed and congested blood sinusoid are also detected in between hepatocytes (arrow head) G I/R rats treated with Met+L-NAME showing marked improvement in histopathological changes of hepatocytes with dilated blood sinusoids in between (arrow head). Most of hepatocytes appear with rounded vesicular nuclei and acidophilic cytoplasm with minimal vacuolation (arrows) H I/R rats treated with Met+CORM-A1 showing an apparent normal architecture of liver tissue. Hepatocytes arranged in cords separating by blood sinusoids (arrow head). Most of hepatocytes appear with rounded vesicular nuclei and acidophilic cytoplasm (arrows). Some cells appear binucleated (thick arrow) I I/R rats treated with Met+ZnPP showing loss of architecture with irregular dilated blood sinusoids (arrow head). The central vein appears irregularly (CV) distorted with inflammatory cell infiltration (thick arrow). Some of hepatocytes appear with deeply stained cytoplasm and irregular shaped nuclei(arrows), others appear with vacuolated cytoplasm (curved arrows) J I/R rats treated with Met+NaHS showing moderate improvement in histological appearance, some of hepatocytes appear with acidophilic cytoplasm and central vesicular nuclei (arrows). Other hepatocytes show minimal vacuolated cytoplasm (curved arrows). Minimal inflammatory cell infiltration is also noticed especially near the central vein (arrow head). K I/R rats treated with Met+DL-PAG showing disturbed irregular pattern of hepatic cords separated by dilated blood sinusoids (arrow head). Most of hepatocytes appear with marked intracellular vacuolations (curved arrows). Other hepatocytes appear with deeply stained cytoplasm and irregular nuclei (arrows). L I/R rats treated with Met+RAPA showing marked amelioration in hepatic changes with mild hepatic blood sinusoidal dilatation (arrow head). Most of hepatocytes appear with vesicular nuclei (arrows); few appear with deeply stained cytoplasm and irregular nuclei (curved arrow). M I/R rats treated with Met+CQ showing severe dilatation and disruption of the central vein (CV) with cellular inflammatory infiltration (curved arrow). Hepatocytes appear with vacuolar degeneration (arrows); dilated irregular blood sinusoids are also detected (arrow head). Some nuclei appear with marginated chromatin (thick arrow) (H&E (x400)). N A histogram showing the number of normal hepatocytes in a specific area
Fig. 6
Fig. 6
photomicrographs of representative liver sections from A control and B sham rats: showing minimal amount of collagen fibers around the portal area (arrow). C I/R rats showing apparent increase in the collagen fibers around the portal area (arrow). D I/R rats treated with Met showing apparent decrease in the collagen fibers around the portal area (arrow). E I/R rats treated with Met+L-A showing apparent increase in the collagen fibers around the portal area (arrow). F I/R rats treated with Met+L-NAME showing apparent decrease in the collagen fibers around the portal area (arrow). G I/R rats treated with Met +CORM-A1 showing apparent decrease in the collagen fibers around the portal area (arrow). H I/R rats treated with Met+ZnPP showing apparent increase in the collagen fibers around the portal area (arrows). I I/R rats treated with Met+NaHS showing apparent decrease in the collagen fibers around the portal area (arrow). J I/R rats treated with Met+DL-PAG showing apparent increase in the collagen fibers around the portal area (arrow). K I/R rats treated with Met+RAPA showing apparent decrease in the collagen fibers around the portal area (arrow). L I/R rats treated with Met+CQ showing apparent increase in the collagen fibers around the portal area (arrows). M A histogram showing estimation of mean of liver collagen percent
Fig. 7
Fig. 7
Immunohistochemistry of endothelial nitric oxide synthase (eNOS) in liver sections from A control rats showing strong expression of eNOS (arrows), B sham rats showing strong expression of eNOS (arrows), C I/R rats showing weak expression of eNOS (arrow), D I/R rats treated with Met showing moderate expression of eNOS (arrows), I/R rats treated with Met+L-A showing strong expression of eNOS (arrows), F I/R rats treated with Met+L-NAME showing weak expression of eNOS (arrows), G I/R rats treated with Met+CORM-A1 showing strong expression of eNOS(arrows), H I/R rats treated with Met+ZnPP showing weak expression of eNOS, I I/R rats treated with Met+NaHS showing strong expression of eNOS, J I/R rats treated with Met+DL-PAG showing weak expression of eNOS, K I/R rats treated with Met+RAPA showing strong expression of eNOS, and L I/R rats treated with Met+CQ showing weak expression of eNOS. M Protein expression of eNOS in liver tissues of rats subjected to 1 h of ischemia followed by 2 h of reperfusion treated with Met, Met +L-A, Met+L-NAME, Met+CORM-A1, Met+ZnPP, Met+NaHS, Met+DL-PAG, Met+RAPA, and Met+CQ and. Each value represents the mean ± S.E.M. of 6 observations. **Significant difference at p<0.01 vs. control and sham values. ##Significant difference at p<0.01 vs. I/R values. ++Significant difference at p<0.01 vs. Met +I/R values
Fig. 8
Fig. 8
Immunohistochemistry of inducible nitric oxide synthase (iNOS) in liver tissues from A Control rats showing weak expression of iNOS (arrow), B sham rats showing weak expression of iNOS (arrow), C I/R rats showing strong expression of iNOS, D I/R rats treated with Met showing moderate expression of iNOS (arrows), E I/R rats treated with Met+L-A showing strong expression of iNOS (arrows), F I/R rats treated with Met+L-NAME showing weak expression of iNOS (arrows), G I/R rats treated with Met+CORM-A1 showing weak expression of iNOS (arrow), H I/R rats treated with Met+ZnPP showing strong expression of iNOS (arrows), I I/R rats treated with Met+NaHS showing weak expression of iNOS (arrows), J I/R rats treated with Met+DL-PAG showing strong expression of iNOS (arrows), K I/R rats treated with Met+RAPA showing weak expression of iNOS (arrows), and L I/R rats treated with Met+CQ showing strong expression of iNOS (arrows). M Protein expression of iNOS in liver tissues of rats subjected to 1 h of ischemia followed by 2 h of reperfusion treated with Met, Met+L-A, Met+L-NAME, Met+CORM-A1, Met+ZnPP, Met+NaHS, Met+DL-PAG, Met+RAPA, and Met+CQ. Each value represents the mean ± S.E.M. of 6 observations. **Significant difference at p<0.01 vs. control and sham values. ##Significant difference at p<0.01 vs. I/R values. ++Significant difference at p<0.01 vs. Met+I/R values
Fig. 9
Fig. 9
Immunohistochemistry of heme oxygenase-1 (HO-1) in liver tissues from A control rats showing strong expression of HO-1(arrows), B sham rats showing strong expression of HO-1(arrows), C I/R rats showing weak expression of HO-1(arrow), D I/R rats treated with Met showing moderate expression of HO-1(arrows), E I/R rats treated with Met+L-A showing weak expression of HO-1(arrow), F I/R rats treated with Met+L-NAME showing strong expression of HO-1(arrows), G I/R rats treated with Met+CORM-A1 showing strong expression of HO-1(arrows), H I/R rats treated with Met+ZnPP showing weak expression of HO-1, I I/R rats treated with Met+NaHS showing strong expression of HO-1(arrow), J I/R rats treated with Met+DL-PAG showing weak expression of HO-1, K I/R rats treated with Met+RAPA showing strong expression of HO-1(arrows), and L I/R rats treated with Met+CQ showing weak expression of HO-1. M Protein expression of HO-1 in liver tissues of rats subjected to 1 h of ischemia followed by 2 h of reperfusion treated with Met, Met+L-A, Met+L-NAME, Met+CORM-A1, Met+ZnPP, Met+NaHS, Met+DL-PAG, Met+RAPA, and Met+CQ. Each value represents the mean ± S.E.M. of 6 observations. **Significant difference at p<0.01 vs. control and sham values. ##Significant difference at p<0.01 vs. I/R values. +Significant difference at p<0.05 vs. Met+I/R values. ++Significant difference at p<0.01 vs. Met +I/R values
Fig. 10
Fig. 10
Immunohistochemistry of cystathionine-γ-lyase (CSE) in liver tissues from A control rats showing strong expression of CSE (arrows), B sham rats showing strong expression of CSE (arrows), C I/R rats showing weak expression of CSE (arrow), D I/R rats treated with Met showing moderate expression of CSE (arrows), E I/R rats treated with Met+L-A showing weak expression of CSE, F I/R rats treated with Met+L-NAME showing strong expression of CSE (arrows), G I/R rats treated with Met+CORM-A1 showing strong expression of CSE (arrows), H I/R rats treated with Met+ZnPP showing weak expression of CSE, I I/R rats treated with Met+NaHS showing strong expression of CSE (arrows), J I/R rats treated with Met+DL-PAG showing weak expression of CSE, K I/R rats treated with Met+RAPA showing strong expression of CSE (arrows), and L I/R rats treated with Met+CQ showing weak expression of CSE. M Protein expression of CSE in liver tissues of rats subjected to 1 h of ischemia followed by 2 h of reperfusion treated with Met, Met +L-A, Met +L-NAME, Met +CORM-A1, Met +ZnPP, Met +NaHS, Met +DL-PAG, Met+RAPA, and Met+CQ. Each value represents the mean ± S.E.M. of 6 observations. **Significant difference at p<0.01 vs. control and sham values. ##Significant difference at p<0.01 vs. I/R values. ++Significant difference at p<0.01 vs. Met+I/R values
Fig. 11
Fig. 11
Immunohistochemistry of Beclin-1 in liver tissues from A control rats showing strong expression of Beclin-1, B sham rats showing strong expression of Beclin-1, C I/R rats showing weak expression of Beclin-1, D I/R rats treated with Met showing moderate expression of Beclin-1, E I/R rats treated with Met+RAPA showing strong expression of Beclin-1, and F I/R rats treated with Met+CQ showing weak expression of Beclin-1. G Protein expression of Beclin-1 in liver tissues of rats subjected to 1 h of ischemia followed by 2 h of reperfusion treated with Met, Met+RAPA, and Met+CQ. Each value represents the mean ± S.E.M. of 6 observations. **Significant difference at p< 0.01 vs. control and sham values. ##Significant difference at p<0.01 vs. I/R values. ++Significant difference at p<0.01 vs. Met. +I/R values

Similar articles

References

    1. Abdelsameea AA, Abbas NA, Abdel Raouf SM (2017) Liraglutide attenuates partial warm ischemia-reperfusion injury in rat livers. Naunyn Schmiedebergs Arch Pharmacol 390:311–19 - PubMed
    1. Abdel-Zaher AO, Abd-Ellatief RB, Aboulhagag NA, Farghaly HSM, Al-Wasei FMM (2021) The potential relationship between gasotransmitters and oxidative stress, inflammation and apoptosis in lead-induced hepatotoxicity in rats. Tissue Cell 71:101511 - PubMed
    1. Abe T, Yazawa K, Fujino M, Imamura R, Hatayama N, Kakuta Y, Tsutahara K, Okumi M, Ichimaru N, Kaimori JY, Isaka Y, Seki K, Takahara S, Li XK, Nonomura N (2017) High-pressure carbon monoxide preserves rat kidney grafts from apoptosis and inflammation. Lab Invest 97:468–77 - PubMed
    1. Adach W, Olas B (2019) Carbon monoxide and its donors - their implications for medicine. Future Med Chem 11:61–73 - PubMed
    1. Afshari H, Noori S, Zarghi A (2023) A novel combination of metformin and resveratrol alleviates hepatic steatosis by activating autophagy through the cAMP/AMPK/SIRT1 signaling pathway. Naunyn Schmiedebergs Arch Pharmacol 396:3135–48 - PubMed

MeSH terms

LinkOut - more resources