. 2025 Apr 7;222(4):e20241571.
doi: 10.1084/jem.20241571. Epub 2025 Feb 6.

Intravenous BCG-mediated protection against tuberculosis requires CD4+ T cells and CD8α+ lymphocytes

Affiliations

Intravenous BCG-mediated protection against tuberculosis requires CD4+ T cells and CD8α+ lymphocytes

Andrew W Simonson et al. J Exp Med. .

Abstract

Tuberculosis (TB) is a major health burden worldwide despite widespread intradermal (ID) BCG vaccination in newborns. We previously demonstrated that changing the BCG route and dose from 5 × 10⁵ CFUs ID to 5 × 10⁷ CFUs i.v. resulted in prevention of Mycobacterium tuberculosis (Mtb) infection and TB disease in highly susceptible nonhuman primates. Identifying immune mechanisms protection following i.v. BCG will facilitate development of more effective vaccines against TB. Here, we depleted lymphocyte subsets prior to and during Mtb challenge in i.v. BCG-vaccinated macaques to identify those necessary for protection. Depletion of adaptive CD4 T cells, but not adaptive CD8αβ T cells, resulted in loss of protection with increased Mtb burdens and dissemination, indicating that CD4 T cells are critical to i.v. BCG-mediated protection. Depletion of unconventional CD8α-expressing lymphocytes (NK cells, innate T cells, and CD4+CD8α+ double-positive T cells) abrogated protection in most i.v. BCG-immunized macaques, supporting further investigation into which of these cell subsets contribute to protection after vaccination.


Conflict of interest statement

Disclosures: S.M. Fortune reported “I serve as a Non-executive Director of Oxford Nanopore Technologies for which I receive financial compensation. ONT sequencing was not used in this study.” P.A. Darrah reported a patent number 11,865,168 issued. No other disclosures were reported.

Figures
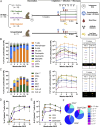
Figure 1.
Figure 1.
A robust immune response is induced by i.v. BCG vaccination. (A) Schematic outlining general timeline of the study. Made with BioRender. (B) Relative abundance of cell types in BAL of i.v. BCG–vaccinated macaques (n = 15–65) shown as the mean proportion of live leukocytes with standard deviation (left), the number of cells as mean with standard deviation (center), and table showing significant differences in number of cells in BAL using Tukey’s multiple comparison test to week 0 (right). Cell types shown are T cells (orange), macrophages (aqua), B cells (black), NK cells (maroon), eosinophils (purple), neutrophils (green), basophils (teal), mDCs (yellow), pDCs (pink), and other cells that were unclassified by flow cytometry (gray). (C) Relative abundance of T cell subsets in BAL of i.v. BCG–vaccinated macaques (n = 15–65), reported as the mean frequency of live leukocytes with standard deviation (left), number of cells as mean with standard deviation (center), and table showing significant differences in number of cells in BAL using Tukey’s multiple comparison test to week 0 (right). T cell types shown are CD4+ T cells (green), CD8+ T cells (orange), CD4CD8 DN T cells (teal), CD4+CD8+ DP T cells (purple), MR1 5-OP-RU+ MAITs (aqua), TCRVα24+ iNKTs (maroon), Vγ9+ γδ T cells (yellow), and Vγ9 γδ T cells (gray). (D and E) Frequency (D) and number (E) of antigen-specific T cells in the BAL of i.v. BCG–vaccinated macaques (n = 15–65) producing IFN-γ, TNFα, IL-2, or IL-17 in response to Mtb WCL. Data in D and E are shown as background-subtracted medians with 95% confidence intervals. (E) Week 0 after BCG shown below the axis. (F) Week 4 stratification (n = 34) of background subtracted IFN-γ (γ), TNF (T), IL-2 (2), and IL-17 cytokine responses from BAL CD4+, CD8+, and CD4+CD8+ DP T cells with a red arc denoting IL-17+ T cells. ns = not significant, P ≥ 0.05; * = 0.01 ≤ P < 0.05; ** = 0.001 ≤ P < 0.01; and **** = P < 0.0001.
Figure S1.
Figure S1.
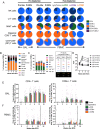
Changes in the composition of lymphocyte cell types in blood of i.v. BCG–vaccinated macaques following cell type depletion. (A) Frequency of common lymphocyte cell types’ CD4 and CD8α/β distributions measured by flow cytometry in BAL and PBMCs. CD4+ (green), CD8αα (light blue), CD8αβ (orange), CD4CD8α (dark blue), and CD4+CD8α+ (purple) phenotypes are shown for each cell type. NK cells (top row), γδ T cells (second row), MAIT cells (third row), classical CD8+ T cells (fourth row), and CD4+CD8α+ T cells (bottom row) are shown. Columns show baseline (one BAL and three PBMCs), following vaccination prior to depletion at approximately week 13 (two BAL and four PBMCs), and the effects of each antibody-mediated depletion in PBMCs at week 20 after vaccination and week 4 after depletion (5–8). Pie charts reflect n = 4 BAL samples before and after vaccination, n = 72 pre-vax PBMCs, n = 65 i.v. BCG post-vax pre-depletion PBMCs, and post-depletion PBMCs from n = 18 IgG, n = 16 anti-CD4, n = 17 anti-CD8α, and n = 14 anti-CD8β-depleted NHPs. (B and C) Relative frequency of leukocyte (B) and T cell (C) subsets in PBMCs following i.v. BCG vaccination (n = 47–65), shown as mean with standard deviation (center-left). Statistics in table show the significant differences in percentage of T cell subsets in PBMCs using Tukey’s multiple comparison test to week 0 (center-right). (D) Antibody titers to mycobacterial antigens in concentrated BAL fluid shown as mean with standard deviation (n = 65). (E and F) Median frequency of cytokine (IFN-γ, TNFα, IL-2, and/or IL-17) producing CD4+ (left) and CD8α+ (right) T cells in BAL (E) and PBMCs (F) in response to WCL stimulation. Dotted line in F reflects when PBMC samples collected following depletion antibody administration. BAL samples: Unvax (n = 2–6), i.v. BCG (n = 3–18), α-CD4 (n = 2–16), α-CD8α (n = 2–17), and α-CD8β (n = 8–14). PBMC samples: Unvax (n = 4–7), i.v. BCG (n = 9–18), α-CD4 (n = 9–16), α-CD8α (n = 9–17), and α-CD8β (n = 8–14). ns = not significant, P ≥ 0.05; * = 0.01 ≤ P < 0.05; ** = 0.001 ≤ P < 0.01; *** = 0.0001 ≤ P < 0.001; and **** = P < 0.0001.
Figure 2.
Figure 2.
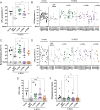
Target cell populations are depleted by antibody infusions in vivo. (A) Flow cytometry to assess T cell depletion in blood (PBMCs, left), airway (by BAL, middle), and peripheral LNs (by biopsy, right). For each depletion group, conventional CD4+ T cells (CD3+CD20γδTCRCD8α) are shown on the top and CD8α+ T cells (CD3+CD20γδTCRCD4) are shown on the bottom; vaccination status is at the top of the plot and antibody infusion designates depletion group. Each symbol represents an animal, and lines connect each animal across time points. Unvax: n = 7; IgG/saline: n = 18; α-CD4: n = 16; α-CD8α: n = 17; and α-CD8β: n = 14. (B) Population composition in BAL, shown as a relative frequency of lymphocytes. Pre-depletion is shown of the left, post-depletion is shown on the right. Each bar represents an animal. Unvax: n = 4; IgG/saline: n = 6; α-CD4: n = 4; α-CD8α: n = 4; and α-CD8β: n = 14. Only animals in the second cohort are included, as anti-CD20 and anti-CD8β antibodies were not included in the flow cytometry panels for the first cohort. (C) Conventional CD8αβ T cells (left), unconventional CD8αα T cells (middle), and CD4+CD8+ DP T cells (right) are selectively depleted in the airway (by BAL) following CD8α and CD8β depletion. Populations are reported as a frequency of CD3+ T cells. Unvax: n = 4–7; IgG/saline: n = 6–18; α-CD4: n = 4–16; α-CD8α: n = 4–17; and α-CD8β: n = 14. Only animals in the second cohort are included in CD8αα and CD8αβ cell type analysis, as an anti-CD8β antibody was not included in the flow cytometry panels for the first cohort, limiting statistical comparisons in CD4 and CD8α depletion groups. P value ranges indicated for Wilcoxon matched-pairs signed-rank test comparison of t = 0 and earliest postdepletion time point (i.e., t = 4 for PBMCs, t = 3 for BAL and LN). ns = not significant, P ≥ 0.05; * = 0.01 ≤ P < 0.05; *** = 0.0001 ≤ P < 0.001; and **** = P < 0.0001.
Figure S2.
Figure S2.
Targeted lymphocyte subsets were successfully depleted in BAL. (A) Numbers of all lymphocyte subsets before and after depletion in BAL were characterized by flow cytometry. Only animals in the second cohort are included, as anti-CD20 and anti-CD8β antibodies were not included in the flow cytometry panels for the first cohort. Percentages shown in each plot represent population size relative to pre-depletion samples, calculated by group median. (B) CD3+CD8+ T cell subsets are selectively depleted following CD8α and CD8β depletion. Left panels: conventional CD8αβ T cells (CD20CD3+γδTCRCD4CD8α+CD8β+); middle panels: unconventional CD8αα T cells (CD20CD3+γδTCRCD4CD8α+CD8β); and right panels: CD4+CD8+ DP T cells (CD20CD3+γδTCRCD4+CD8α+). Top panels: PBMCs; bottom panels: peripheral LNs. Populations are reported as a frequency of CD3+ T cells. Only animals in the second cohort are included for CD8αα and CD8αβ T cell analysis, as an anti-CD8β antibody was not included in the flow cytometry panels for the first cohort. Unvax: n = 4–7; IgG/saline: n = 6–18; α-CD4: n = 4–16; α-CD8α: n = 4–17; and α-CD8β: n = 14.
Figure 3.
Figure 3.
CD8α depletion shifts phenotypic and functional profile of NK cells in the airway. (A) Relative frequency of NK (CD3 negative) subtypes in BAL before (top) and after depletion (bottom). Unvax: n = 4; IgG/saline: n = 6; α-CD4: n = 4; α-CD8α: n = 4; and α-CD8β: n = 14. (B) Cytokine (IFN-γ, IL-2, IL-17, and TNF) production by NK subtype using CD8α, NKG2A, and CD16 markers in BAL of animals before depletion, represented as the frequency of cytokine-positive NK cells by flow cytometry (n = 65). Each symbol represents an animal, and lines represent group median. If subtype was below event count threshold by flow cytometry that animal will not appear as a symbol for that specific cell type. Subtypes are same colors in A and B. (C) Frequency of cytokine-positive NKG2A SP NK cells (CD8αCD16) before and after CD8α depletion. (D) Number of NK cells expressing IFN-γ, IL-2, IL-17, or TNF before and after CD8α depletion. Each symbol in C and D represents an animal (n = 4).
Figure 4.
Figure 4.
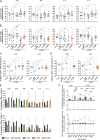
CD4 and CD8α depletion lead to increased disease and bacterial burden. (A) Total lung FDG activity at 4 and 8 wk after Mtb challenge. Animals with missing PET scans were not included. Unvax: n = 7 (4 wk), 6 (8 wk); IgG/saline: n = 16 (4 and 8 wk); α-CD4: n = 15 (4 wk), 11 (8 wk); α-CD8α: n = 16 (4 and 8 wk); and α-CD8β: n = 14 (4 and 8 wk). (B) Total lung FDG activity at necropsy. Animals with missing PET scans were not included. Unvax: n = 6; IgG/saline: n = 16; α-CD4: n = 11; α-CD8α: n = 16; and α-CD8β: n = 14. (C) Number of granulomas seen by PET CT scans at 4 and 8 wk after infection. TB pneumonia or consolidations are denoted as too numerous to count (TNTC). For A and C, each symbol represents an animal, and lines connect animals across time points. P value ranges indicated for Wilcoxon matched-pairs signed-rank test comparison of 4 versus 8 wk after Mtb challenge. (D) The number of granulomas found at necropsy. TB pneumonia and consolidations are represented as TNTC. (E) Gross pathology score, as described by Maiello et al. (2018). (F) Bacterial burden (CFUs) of all thoracic tissues (left), lung (middle), and thoracic LNs (right). Symbols represent an animal. For B and D–F: Unvax: n = 7; IgG/saline: n = 18; α-CD4: n = 16; α-CD8α: n = 17; and α-CD8β: n = 14. Circles represent cohort 1 and squares represent cohort 2. In all panels except E, symbols in gray regions are of equal value (0 or sterile) and were spread for better visualization. Groups were compared using the Kruskal–Wallis test, with Dunn’s multiple comparison adjusted P value ranges indicated, comparing IgG/saline group against each depletion group. ns = not significant P ≥ 0.05; * = 0.01 ≤ P < 0.05; ** = 0.001 ≤ P < 0.01; *** = 0.0001 ≤ P < 0.001; and **** = P < 0.0001.
Figure 5.
Figure 5.
Granulomas and dissemination events are less controlled following CD4 and CD8α depletion. (A) The bacterial burden per granuloma. Symbols represent a mean of all granulomas within an animal, and animals with no granulomas are not included. (B) CFUs per granuloma separated by animal. (C) Bacterial burden in lung lobes without gross pathology (i.e., non-granuloma tissue). (D) CFUs of non-sterile thoracic LN separated by animal. In B and D, each symbol represents a granuloma or LN, and each column represents an animal. (E) The number of CFU+ thoracic LNs per animal. (F) The EP score, as described by Maiello et al. (2018). For all panels, each symbol represents an animal, line represents group median; circles represent cohort 1 and squares represent cohort 2. In C–F, symbols in gray regions are of equal value (0 or sterile) and were spread for better visualization. All symbols in gray region are of equal value (0 or sterile) and were spread for better visualization. Unvax: n = 7; IgG/saline: n = 18; α-CD4: n = 16; α-CD8α: n = 17; and α-CD8β: n = 14. Groups were compared using the Kruskal–Wallis test, with Dunn’s multiple comparison adjusted P value ranges indicated, comparing IgG/saline group against each depletion group. ns = not significant, P ≥ 0.05; * = 0.01 ≤ P < 0.05; and *** = 0.0001 ≤ P < 0.001.
Figure 6.
Figure 6.
Mtb-specific systemic responses and immune profile in lungs are altered after depletion. (A) ELISpot IGRA results following stimulation with ESAT6 and CFP10 peptide pools. SFUs were normalized to unstimulated background and averaged across two replicates. A response of 10 SFUs per 200,000 PBMCs is considered positive for an Mtb-specific response (Darrah et al., 2020). Pre-infusion: post-vaccination, pre-depletion (Unvax: n = 6; IgG/saline: n = 16; α-CD4: n = 13; α-CD8α: n = 14; and α-CD8β: n = 14). Pre-infection: post-depletion, pre-Mtb challenge (Unvax: n = 7; IgG/saline: n = 16; α-CD4: n = 14; α-CD8α: n = 16; and α-CD8β: n = 14). Necropsy: at necropsy (Unvax: n = 6; IgG/saline: n = 17; α-CD4: n = 13; α-CD8α: n = 13; and α-CD8β: n = 14). Lines represent group median. Symbols with a cross represent sterile animals. (B) Number of each lymphocyte subset per gram of lung tissue, characterized by flow cytometry. Each symbol represents an animal; circles represent cohort 1 and squares represent cohort 2. Unvax: n = 7; IgG/saline: n = 18; α-CD4: n = 16; α-CD8α: n = 17; and α-CD8β: n = 14. Percentages shown in each plot represent population size relative to IgG/saline group, calculated by group median (line). Only cohort 2 was included for CD8αα, CD8αβ, and NK cell quantification, as anti-CD20 and anti-CD8β antibodies were not included in the flow cytometry panels in cohort 1 (Unvax: n = 4; IgG/saline: n = 6; α-CD4: n = 16; α-CD8α: n = 17; and α-CD8β: n = 14). Each symbol represents a mean per animal of two to four lung lobes sampled, bar represents group median. Groups were compared using the Kruskal–Wallis test, with Dunn’s multiple comparison adjusted P value ranges indicated (ns = not significant, P ≥ 0.05; * = 0.01 ≤ P < 0.05; ** = 0.001 ≤ P < 0.01; *** = 0.0001 ≤ P < 0.001; and **** = P < 0.0001), comparing IgG/saline group against each depletion group.
Figure S3.
Figure S3.
Granuloma lymphocyte composition. (A) Total number of cells per granuloma. Each symbol represents the mean of all granulomas in an animal, line represents the group median. All groups (excluding the unvaccinated animals) were compared using the Kruskal–Wallis test with Dunn’s multiple comparison adjusted P value ranges indicated, comparing IgG/saline group against each depletion group. Circles represent cohort 1 and squares represent cohort 2. (B) The relative frequencies of lymphocyte populations in granulomas. Each bar represents a granuloma, divided by depletion group. B/NK/ILC/other are CD3 populations. (C) Cytokine production by CD4+CD8 SP and CD4+CD8+ DP T cells incubated without stimulation (Media, left) or with WLC (right). P value ranges indicated for Wilcoxon matched-pairs signed-rank test comparison of CD4 SP and CD4+CD8α+ DP T cells under each stimulation condition. (D) Relative abundance of CD4+ and/or CD8α+ γδ T cells found in granulomas. Animals with no granulomas were not included in A, B, and D. Unvax: n = 7; IgG/saline: n = 8; α-CD4: n = 12; α-CD8α: n = 14; and α-CD8β: n = 4. (E and F) Production of IFN-γ, TNF, IL-2, and/or IL-17 by each gd T cell subset as a frequency of cells in that subset (E) and number (F). Groups in F were compared as in A. For C, E, and F: Unvax: n = 7; IgG/saline: n = 18; α-CD4: n = 16; α-CD8α: n = 17; and α-CD8β: n = 14. ns = not significant, P ≥ 0.05; * = 0.01 ≤ P < 0.05; *** = 0.0001 ≤ P < 0.001; and **** = P < 0.0001.
Figure 7.
Figure 7.
Functional lymphocytes are depleted in lung tissue. (A and B) Number of CD4 (A) and CD8α+ (B) T cells per gram of lung tissue producing IFN-γ, TNF, IL-2, or IL-17. (C and D) Number of CD4 (C) and CD8α+ (D) T cells per gram of lung tissue producing granzyme B or granzyme K. Groups were compared using the Kruskal–Wallis test, with Dunn’s multiple comparison adjusted P value ranges indicated, comparing IgG/saline group against each depletion group. (E) CD8α+ T cell responses categorized by CD8αα (top) and CD8αβ (bottom) T cells as subsets of the CD8α T cells in B. (F) Number of CD4 (top) and CD8αβ+ (bottom) T cells producing cytokines (IFN-γ/TNF/IL-2/IL-17) when stimulated with WCL (W) or ESAT-6 and CFP10 peptide pools (E6C10) compared with baseline production without stimulation. P value ranges indicated for one-sample t test. For E and F, each symbol represents a mean per animal of two to four lung lobes sampled, bar represents group median. Granzymes were only analyzed in cohort 2. Lines connect animals. Unvax: n = 7; IgG/saline: n = 18; α-CD4: n = 16; α-CD8α: n = 17; and α-CD8β: n = 14. Symbols represent an animal, circles represent cohort 1, and squares represent cohort 2. ns = not significant, P ≥ 0.05; * = 0.01 ≤ P < 0.05; ** = 0.001 ≤ P < 0.01; *** = 0.0001 ≤ P < 0.001; and **** = P < 0.0001.
Figure 8.
Figure 8.
CD4 and CD8α depletion results in increased dissemination within lung and to LNs. (A) The total number of unique barcodes identified in each animal. Sterile animals are shown as a value of 0. Samples failing sequencing quality control were excluded from analysis. Unvax: n = 7; IgG/saline: n = 17; α-CD4: n = 14; α-CD8α: n = 17; and α-CD8β: n = 12. (B) The frequency of all established barcodes found in three or more sites, regardless of tissue. Unvax: n = 7; IgG/saline: n = 11; α-CD4: n = 14; α-CD8α: n = 15; and α-CD8β: n = 6. (C) The frequency of all barcodes found in lung tissue or granulomas that were also identified in thoracic LNs. Unvax: n = 7; IgG/saline: n = 11; α-CD4: n = 14; α-CD8α: n = 13; and α-CD8β: n = 5. (D) The number of barcodes found in any thoracic LN. Unvax: n = 7; IgG/saline: n = 11; α-CD4: n = 14; α-CD8α: n = 15; and α-CD8β: n = 6. Sterile animals are not included in B–D. (E) The total FDG activity in thoracic LNs as a sum of all measured LNs. (F) The single thoracic LN with maximum FDG avidity per animal. In E and F, if no LNs were distinguishable on the scan, a 0 is reported; animals missing PET scans were not included. Unvax: n = 6; IgG/saline: n = 16; α-CD4: n = 11; α-CD8α: n = 16; and α-CD8β: n = 14. (G) CFUs per non-sterile thoracic LN showing the mean of all CFU+ LNs in an animal. Animals with no CFU detected in LN tissues were not included. Unvax: n = 7; IgG/saline: n = 5; α-CD4: n = 14; α-CD8α: n = 14; and α-CD8β: n = 8. (H) The frequency of barcodes found in lung tissues that were also found in extra pulmonary tissues. Unvax: n = 7; IgG/saline: n = 11; α-CD4: n = 14; α-CD8α: n = 12; and α-CD8β: n = 6. All groups (excluding unvaccinated animals) were compared using the Kruskal–Wallis test with Dunn’s multiple comparison adjusted P value ranges indicated, comparing between IgG/saline group and each depletion group. Symbols represent an animal, line represents median of group. Circles represent cohort 1, and squares represent cohort 2. ns = not significant, P ≥ 0.05; * = 0.01 ≤ P < 0.05; ** = 0.001 ≤ P < 0.01; and *** = 0.0001 ≤ P < 0.001. SUVR: standardized uptake value ratio.
Figure S4.
Figure S4.
Gating strategy for flow cytometry samples. (A) CD8β staining by flow cytometry is not inhibited by anti-CD8β depletion antibody. PBMCs stained with or without the addition of the depletion a-CD8β antibody show similar levels of staining by the antibody used for flow cytometry, indicating negligible competitive blocking. (B and C) Representative phenotype (B) and memory and effector function (C) gating on lung tissue from a vaccinated, undepleted animal.
Figure S5.
Figure S5.
Gating strategy for BAL and PBMC phenotyping flow cytometry samples. Representative BAL and PBMC samples from an i.v. BCG–vaccinated animal at a peak time point.

References

    1. Andersen, P., and Doherty T.M.. 2005. The success and failure of BCG - implications for a novel tuberculosis vaccine. Nat. Rev. Microbiol. 3:656–662. 10.1038/nrmicro1211 - DOI - PubMed
    1. Arora, P., Foster E.L., and Porcelli S.A.. 2013. CD1d and natural killer T cells in immunity to Mycobacterium tuberculosis. InAdvances in Experimental Medicine and Biology. Vol. 783. Divangahi M., editor. Springer New York, New York, NY, USA. 199–223. 10.1007/978-1-4614-6111-1_11 - DOI - PubMed
    1. Bromley, J.D., Ganchua S.K.C., Nyquist S.K., Maiello P., Chao M., Borish H.J., Rodgers M., Tomko J., Kracinovsky K., Mugahid D., et al. . 2024. CD4+ T cells re-wire granuloma cellularity and regulatory networks to promote immunomodulation following Mtb reinfection. Immunity. 57:2380–2398.e6. 10.1016/j.immuni.2024.08.002 - DOI - PMC - PubMed
    1. Capuano, S.V.III, Croix D.A., Pawar S., Zinovik A., Myers A., Lin P.L., Bissel S., Fuhrman C., Klein E., and Flynn J.L.. 2003. Experimental Mycobacterium tuberculosis infection of cynomolgus macaques closely resembles the various manifestations of human M. tuberculosis infection. Infect. Immun. 71:5831–5844. 10.1128/IAI.71.10.5831-5844.2003 - DOI - PMC - PubMed
    1. Chen, C.Y., Huang D., Wang R.C., Shen L., Zeng G., Yao S., Shen Y., Halliday L., Fortman J., McAllister M., et al. . 2009. A critical role for CD8 T cells in a nonhuman primate model of tuberculosis. PLoS Pathog. 5:e1000392. 10.1371/journal.ppat.1000392 - DOI - PMC - PubMed

MeSH terms