. 2025 Feb 11;122(6):e2413126122.
doi: 10.1073/pnas.2413126122. Epub 2025 Feb 6.

Extrinsic induction of apoptosis and tumor suppression via the p53-Reprimo-Hippo-YAP/TAZ-p73 pathway

Affiliations

Extrinsic induction of apoptosis and tumor suppression via the p53-Reprimo-Hippo-YAP/TAZ-p73 pathway

Masahiro Takikawa et al. Proc Natl Acad Sci U S A. .

Abstract

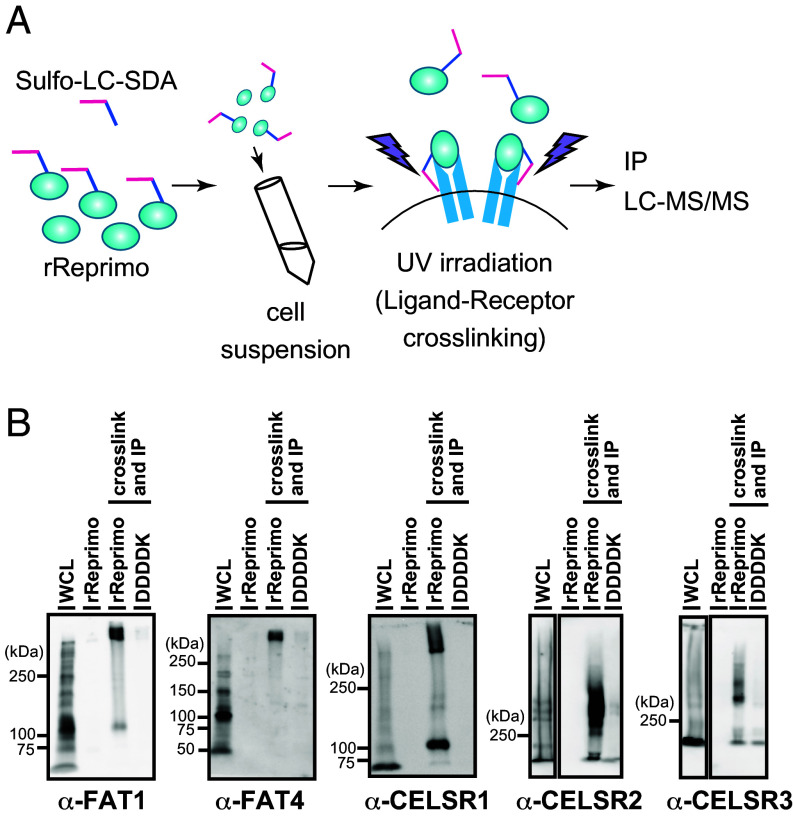
Tumor progression is suppressed by inherent cellular mechanisms such as apoptosis. The p53 tumor suppressor gene is the most commonly mutated gene in human cancer and plays a pivotal role in tumor suppression. RPRM is a target gene of p53 known to be involved in tumor suppression, but its molecular function has remained elusive. Here, we report that Reprimo (the protein product of RPRM) is secreted and extrinsically induces apoptosis in recipient cells. We identified FAT1, FAT4, CELSR1, CELSR2, and CELSR3, members of the protocadherin family, as receptors for Reprimo. Subsequent analyses revealed that Reprimo acts upstream of the Hippo-YAP/TAZ-p73 axis and induces apoptosis by transactivating various proapoptotic genes. In vivo analyses further support the tumor-suppressive effects of secreted Reprimo. These findings identify the p53-Reprimo-Hippo-YAP/TAZ-p73 axis as an extrinsic apoptosis pathway that plays a crucial role in tumor suppression. Our finding of the innate tumor eliminator Reprimo and the downstream pathway offers a promising avenue for the pharmacological treatment of cancer.

Keywords: Hippo pathway; apoptosis; cancer; p53; p73.


Conflict of interest statement

Competing interests statement:The authors declare no competing interest.

Figures

Fig. 1.
Fig. 1.
Secreted Reprimo induces apoptosis extrinsically. (A) HEK293T cells were transfected with empty or Reprimo-FLAG expression vectors. Cells and media (MED) were separated by centrifugation. Cell pellets were lysed to generate whole cell lysates (WCL). The samples were analyzed by western blotting with antibodies against DDDDK-tag or β-actin. The loading control signals were from a gel run in parallel. (B) Recombinant Reprimo protein (rReprimo) was produced by HeLa cells infected with a Reprimo-FLAG expressing adenovirus and analyzed by western blotting using DDDDK-tag antibody. (C) Cells were incubated with/without rReprimo at 1 µg/mL for 72 h. Phase contrast images were taken with an IncuCyte imager. The white scale bars represent 100 µm. Time-lapse images can be seen in the Movies S1 and S2. (D) Four cell lines were incubated with DMEM media containing rReprimo at 0 to 3 µg/mL for 24 h, respectively. Cells were lysed and analyzed with the CellTiter-Glo Luminescent Cell Viability Assay. Cell viability was normalized against cells incubated without rReprimo. (E) HeLa cells were incubated with/without rReprimo at 1 µg/mL for 24 h. Apoptotic cells were stained with the In Situ Cell Death Detection Kit, and the pictures were taken with a fluorescence microscope. The white scale bars represent 100 µm. (F) HeLa cells were incubated with rReprimo at 1 µg/mL or STS (Staurosporine) at 0.5 µM for 0 to 24 h. WCL were analyzed by western blotting with antibodies against PARP1, cleaved-caspase 3, or β-actin. STS was used as a positive control. The loading control signals were from a gel run in parallel.
Fig. 2.
Fig. 2.
Expression changes in response to rReprimo treatment. (AD) Cells were incubated with/without rReprimo at 0.5 µg/mL for 32 h and extracted RNA samples were analyzed by RNA-seq. (A) MA plot for the results of HeLa cells was shown. (B) GO analysis analyzed by DAVID GOTERM_BP_FAT with the upregulated genes in HeLa cells. (C) Changes in the expression levels of the indicated genes. Fold change was calculated based on the FPKM values. (D) GSEA plot of PHONG_TNF_TARGETS_UP analyzed in HeLa cells. Normalized enrichment score and false discovery rate q-value are shown.
Fig. 3.
Fig. 3.
Reprimo binds to the protocadherin family members on the surface of the recipient cell. (A) Schematic images showing crosslinking IP-MS. First, rReprimo was incubated with Sulfo-LC-SDA in the dark to conjugate via the NHS-ester moiety (blue arm). Second, the crosslinked rReprimo was incubated with cell suspensions in the dark. Third, the mixture was irradiated with UV to crosslink the diazirine moiety (magenta arm) with receptor candidates. Finally, cells were lysed, purified with FLAG, separated by SDS-PAGE, and analyzed with liquid chromatography–tandem mass spectrometry (LC-MS/MS). (B) WCL of HeLa cells, rReprimo, and the same sample prepared as shown in SI Appendix, Fig. S3D were analyzed by western blotting with the indicated antibodies.
Fig. 4.
Fig. 4.
Reprimo activates YAP/TAZ and induces apoptosis. (A) HEK293 cells were incubated with/without rReprimo at 1 µg/mL for the indicated hours. WCL were analyzed by western blotting with the indicated antibodies. The loading control signals were from gels run in parallel. (B and C) HEK293 cells were incubated with/without rReprimo at 1 µg/mL for 24 h. Hoechst staining and immunofluorescence images with YAP1 were captured by a fluorescence microscope (B). The white scale bars represent 50 µm. The number of YAP1 signals per cell nucleus was calculated (C). The graph shows mean values with SEM of three independent experiments. **P value was 0.0017 calculated with Welch’s t test. (D and E) HeLa, ACHN, and HEK293 cells were incubated with rReprimo at 1 µg/mL for the indicated times (hours). mRNA levels of CYR61 (D) and CTGF (E) were determined by RT-qPCR. GAPDH was used for normalization. The graph shows mean values with SEM of three or four independent experiments. *P value < 0.05 and **P value < 0.01 were calculated by Welch’s t test. (F and G) YAP1 and/or TAZ expression were suppressed by siRNA transfection in HeLa (F) or ACHN (G) cells. Cells treated with YAP1, TAZ, YAP1/TAZ (YAP1 and TAZ), or scrambled control siRNA were incubated with rReprimo at 0 to 2 µg/mL for 24 h, lysed, and subjected to the CellTiter-Glo Luminescent Cell Viability Assay. (H) Cells treated with FAT1, FAT4, CELSR1, CELSR2, CELSR3, or scrambled control siRNA were incubated with rReprimo at 0 to 2 µg/mL for 24 h, then lysed and subjected to the CellTiter-Glo Luminescent Cell Viability Assay. (I and J) Expression of CELSR2 or CELSR3 was suppressed by siRNA transfection in ACHN. Cells treated with CELSR2, CELSR3, or scrambled control siRNA were incubated with/without rReprimo at 1 µg/mL for 24 h, then mRNA levels of CYR61 (I) or CTGF (J) were determined by RT-qPCR. 18S ribosomal RNA was used for normalization. The graph shows mean values with SD of three independent experiments. **P values were 0.0077 and 0.0017 calculated by Welch’s t test, respectively.
Fig. 5.
Fig. 5.
Hippo-YAP/TAZ–p73 is essential for extrinsic apoptosis by Reprimo. (AC) Expression levels of ATF3, PLK2, PUMA, and GADD45A were determined by RT-qPCR. 18S ribosomal RNA was used for normalization. Graphs show mean values with SD of three independent experiments. *P value < 0.05 and **P value < 0.01 were calculated by Welch’s t test (A and C), or ****P value < 0.0001 was calculated by Sidak’s multiple comparison test (B). (A) HeLa, ACHN, HEK293, or H1299 cells were incubated with rReprimo at 1 µg/mL for the indicated hours. (B) ACHN cells treated with YAP1/TAZ, p73, or control scrambled siRNA were incubated with rReprimo at 1 µg/mL for the indicated hours. (C) ACHN cells were treated with CELSR2, CELSR3, or control scramble siRNA. (D and E) Endogenous Reprimo induces YAP1/TAZ–TEAD and YAP1/TAZ–p73-related genes. Rprm −/− MEFs were cultured with conditioned medium prepared from Rprm +/+ and −/− MEFs and supplemented every 12 h. At 48 h posttreatment, cells were harvested, and expression of Cyr61 and Ctgf (D) and Gadd45a, Atf3, and Plk2 (E) was analyzed by RT-qPCR. P values were calculated by two-tailed Student’s t test. (F) Cells treated with p73 or control scrambled siRNA were incubated withrReprimo at 0 to 2 mg/mL for 24 h, then lysed and analyzed withCellTiter-Glo Luminescent Cell Viability Assay.
Fig. 6.
Fig. 6.
Reprimo suppresses cancer. (A and B) Secreted Reprimo represses cancer cell growth. HeLa cells mixed with human normal fibroblasts expressing RPRM or control LacZ were injected subcutaneously into both ventral sides of nude mice. (A) At 75 d postinjection, tumors were excised and their volumes calculated (B). Error bars, SEM. P value was calculated by two-tailed Student’s t test. (C and D) Endogenously secreted Reprimo represses cancer cell growth. HeLa cells mixed with Rprm +/+ or −/− MEF cells were injected subcutaneously into both ventral sides of nude mice. At 55 d postinjection, tumors were excised and their volumes calculated (D). Error bars, SEM. P values were calculated by two-tailed Student’s t test (*P < 0.05, **P < 0.01). (E) RPRM mRNA expression in various cancers. RPRM mRNA expression in the indicated cancers and their corresponding normal tissues were obtained from the TCGA database. P values were calculated in comparison with normal and tumor cases. P values were calculated by two-tailed Student’s t test. P values are <0.05 in all cancer types shown in the plot. (F) RPRM expression is correlated to p53 status in some cancers. Shown are RPRM expression in p53 wild-type (cases with no mutation) and p53 mutant cancers (cases with highly impacted mutations in the p53 gene, such as frameshift, nonsense, SIFT-predicted deleterious missense mutations and deep deletions). Error bars, SEM. P values were calculated by two-tailed Student’s t test.

References

    1. Levine A. J., p53: 800 million years of evolution and 40 years of discovery. Nat. Rev. Cancer 20, 471–480 (2020). - PubMed
    1. Sabapathy K., Lane D. P., Therapeutic targeting of p53: All mutants are equal, but some mutants are more equal than others. Nat. Rev. Clin. Oncol. 15, 13–30 (2018). - PubMed
    1. Vousden K. H., Prives C., Blinded by the light: the growing complexity of p53. Cell 137, 413–431 (2009). - PubMed
    1. Oda E., et al. , Noxa, a BH3-only member of the Bcl-2 family and candidate mediator of p53-induced apoptosis. Science 288, 1053–1058 (2000). - PubMed
    1. Kawase T., et al. , PH domain-only protein PHLDA3 is a p53-regulated repressor of Akt. Cell 136, 535–550 (2009). - PubMed

MeSH terms

LinkOut - more resources