. 2025 Oct 3;148(10):3607-3622.
doi: 10.1093/brain/awaf051.

Parkinson's disease mutant Miro1 causes mitochondrial dysfunction and dopaminergic neuron loss

Affiliations

Parkinson's disease mutant Miro1 causes mitochondrial dysfunction and dopaminergic neuron loss

Axel Chemla et al. Brain. .

Abstract

The complex and heterogeneous nature of Parkinson's disease (PD) is still not fully understood. However, increasing evidence supports mitochondrial impairment as a major driver of neurodegeneration. Miro1, a mitochondrial GTPase encoded by the RHOT1 gene, is involved in mitochondrial transport, mitophagy and mitochondrial calcium buffering, and is therefore essential for maintaining mitochondrial homeostasis. Recently, Miro1 has been linked genetically and pathophysiologically to PD, further supported by the identification of heterozygous variants of Miro1 in patients. Herein, we used patient-derived cellular models alongside knock-in mice to investigate Miro1-dependent pathophysiological processes and molecular mechanisms underlying neurodegeneration in PD. Experimental work performed in induced pluripotent stem cell (iPSC)-derived models, including midbrain organoids and dopaminergic neuronal cell cultures from a PD patient carrying the p.R272Q Miro1 mutation as well as healthy and isogenic controls, indicated that the p.R272Q Miro1 mutation leads to increased oxidative stress, disrupted mitochondrial bioenergetics and altered cellular metabolism. These changes were accompanied by increased α-synuclein levels and a significant reduction of dopaminergic neurons. Moreover, the p.R272Q Miro1 mutation-located in the calcium-binding domain of the GTPase-disrupted calcium homeostasis, resulting in calcium-dependent activation of calpain proteases and the subsequent cleavage of α-synuclein. Knock-in mice expressing p.R285Q Miro1 (the murine orthologue of the human p.R272Q mutation) displayed accumulation of phosphorylated α-synuclein in the striatum and a significant loss of dopaminergic neurons in the substantia nigra pars compacta, accompanied by behavioural alterations. These findings demonstrate that mutant Miro1 is sufficient to comprehensively model PD-relevant phenotypes in vitro and in vivo, reinforcing its pivotal role in PD pathogenesis.

Keywords: calcium homeostasis; knock-in mice; neurodegeneration; p.R272Q Miro1; patient-specific iPSC-derived models; α-synuclein.


Conflict of interest statement

J.C.S. is co-inventor on a patent (WO2017060884A1) describing the midbrain organoid technology used and co-founder of OrganoTherapeutics. The other authors report no competing interests.

Figures

Figure 1
Figure 1
Parkinson's disease-related pathways were deregulated in p.R272Q Miro1 mutant midbrain organoids and dopaminergic neurons. (A) Schematic representation of the in vitro models and culture conditions used. (B) UMAP visualization of healthy control (Ctrl 2), p.R272Q Miro1 mutant (PD-R272Q) and isogenic control (iCtrl) organoids single-cell RNA sequencing (scRNAseq) data showed seven unique cell clusters. Dots are colour-coded by cell cluster and represent individual cells. (C) Heat map displaying the top 500 differentially expressed genes (DEG) showed a separation between PD-R272Q organoids and controls. (D) Graphics depict the most PD-relevant deregulated network processes (i) and pathways (ii) between PD-R272Q and Ctrl or iCtrl organoids from the top 25 most deregulated ones (Supplementary Fig. 2). (E) Principal component analysis (PCA) plot shows separation at PC1 in PD-R272Q dopaminergic neurons compared with Ctrl and iCtrl, based on the top 500 DEG identified from bulk RNAseq analysis. (F) Graphic displaying the deregulated gene ontology terms of PD-R272Q dopaminergic neurons versus healthy or isogenic controls. (BF) Significance was considered when P-adjusted value <0.05. FDR = false discovery rate; PD = Parkinson’s disease; UMAP = Uniform Manifold Approximation and Projection.
Figure 2
Figure 2
p.R272Q Miro1 mutation increased ROS and impaired mitochondrial membrane potential in vitro. (A) Flow cytometry representation (left) and quantification (right) of the percentage of MitoSox Red-positive events. n = 8–24 from six independent derivations. (B) Evaluation of mitochondrial membrane potential (MMP or mΔΨ) using the specific marker TMRM by flow cytometry in organoids. [B(i)] Percentage of double-positive events for TMRM and MitoTracker Green. [B(ii)] Mean fluorescent intensity (MFI) ratio between TMRM and MitoTracker Green within the double-positive events. n = 5–21 from five independent derivations. (C) Evaluation of cellular ROS in dopaminergic neurons using live imaging. Left: Representative images of dopaminergic neurons containing CellRox Deep Red (ROS marker; red or white), CellTracker Green (cellular marker; green) and Hoechst (blue, nuclei) in Ctrl, PD-R272Q and iCtrl. Scale bar: 20 µm. Right: Graphs depicting the intracellular CellRox MFI values normalized to iCtrl. n = 6–7 independent derivations. (D) MMP evaluation in dopaminergic neurons, in the absence (DMSO) or presence of FCCP, by live imaging quantification of mitochondrial TMRE MFI signal. n = 3–4 independent derivations. All data are presented as median with maximum/minimum or mean ± standard error of the mean. *P < 0.05, **P < 0.01, ***P < 0.001 using non-parametric multiple comparison Kruskal–Wallis test (A and B), one-way ANOVA with a post hoc Tukey’s Honest Significant Difference test (C) or two-way ANOVA (D). Ctrl = control; iCtrl = isogenic control; PD = Parkinson’s disease; ROS = reactive oxygen species.
Figure 3
Figure 3
p.R272Q Miro1 mutation caused mitochondrial bioenergetic deficits in vitro. (A) Assessment of mitochondrial function in p.R272Q Miro1 mutant (PD-R272Q), healthy (Ctrl) and isogenic (iCtrl) midbrain organoids using Seahorse Mito Stress Test from Agilent. Left: Representative graphic depicts oxygen consumption rate (OCR) over time (minutes) under a specific set of drugs: oligomycin, FCCP, and antimycin A and rotenone. Right: Bar graph shows quantification of the different parameters calculated from the assay. Ctrl n = 27, PD n = 9, iCtrl n = 5 from 5–9 independent derivations. (B) Relative abundance of (i) ATP, (ii) NAD, (iii) FAD and (iv) pyruvate intracellular metabolites in midbrain organoids upon targeted liquid chromatography-mass spectrometry. n = 5–15 from two independent derivations. (C) OCR by time (left) and feature quantification (right) from Seahorse Mito Stress Test in dopaminergic neuronal cultures. n = 4 independent derivations. (D) Intracellular ATP levels in dopaminergic neurons. n = 6 independent derivations. All data are represented as mean ± standard error of the mean or median with maximum/minimum. *P < 0.05, **P < 0.01, ***P < 0.001, ****P < 0.0001 using non-parametric multiple comparison Kruskal–Wallis test. PD = Parkinson’s disease.
Figure 4
Figure 4
p.R272Q Miro1 mutation promoted increased levels of α-synuclein toxic-prone forms via calcium-dependent activation of calpain. (A) Left: Representative images of dopaminergic neurons containing Fluo-4 direct (green) and Hoechst (blue, nuclei) before (0 s) and after (120 s) ionomycin injection. Scale bar: 50 µm. Middle: Mean fluorescence intensity (MFI) of Fluo-4 direct signal (F1) divided by its basal signal (F0) at 120 s (T120). Right: Graphical representation of F1/F0 MFI through time assessed by live imaging. n = 7 independent derivations. (B) Representative image of monomeric α-synuclein (Syn, 15 kDa) and housekeeping protein β-actin (42 kDa) western blotting in dopaminergic neurons at non-saturated exposure (top bands), and a representative image of lower molecular weight α-synuclein band (<15 kDa) after high exposure time (bottom band). (C) Graphic showing quantification of monomeric α-synuclein (15 kDa). n = 4 independent derivations. (D) Quantification of α-synuclein cleaved species (<15 kDa). n = 4 independent derivations. (E) Calpain activity in PD-R272Q and iCtrl neurons measured using the N-succinyl-Leu-Leu-Val-Tyr-7-amido-4-methylcoumarin (Suc-LLVY-AMC) fluorescence probe in the presence or absence of the reversible calpain inhibitor MDL-28170 (MDL). Data represented as relative fluorescent units per µg of protein, normalized to iCtrl. n = 3 independent derivations. (F) Left: Representative image of high molecular weight form of α-synuclein, possible tetramer form [60 kDa, (t)α-syn], and housekeeping protein vinculin (130 kDa) western blotting in dopaminergic neurons. A qualitative control based on lysates of patient-specific induced pluripotent stem cell (iPSC)-derived dopaminergic neurons carrying a triplication in the SNCA gene (3xSNCA) is shown in the first lane. Right: Quantification of 60 kDa (t)α-syn. n = 3–6 independent derivations. Data presented as median with maximum/minimum. *P < 0.05, **P < 0.01, using one-way ANOVA with a post hoc Tukey’s Honest Significant Difference test (AD and F) or two-way ANOVA (E). Full membranes are displayed in the Supplementary material, ‘Western blotting data’ section. Ctrl = control; iCtrl = isogenic control; PD = Parkinson’s disease.
Figure 5
Figure 5
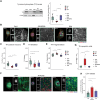
p.R272Q Miro1 mutant midbrain organoids showed signs of dopaminergic neuron loss. (A) Tyrosine hydroxylase (TH) representative image (right) and quantification (left) evaluated in midbrain organoids by western blotting (TH: 60 kDa; β-actin: 42 kDa). Ctrl n = 30, PD-R272Q n = 10, iCtrl n = 6 from 6 (iCtrl) or 10 (Ctrl, PD) independent derivations. Full membranes in the Supplementary material, ‘Western blotting data’ section. (B) Immunofluorescent analysis of TH-positive (TH+) signal, total neural marker TUJ1 and nuclei (Hoechst) in midbrain organoids. Scale bar: 200 µm. (C) Graphic displays the quantification of the total volume occupied by the TH and TUJ1 double-positive signal within the total TUJ1. (D and E) Immunofluorescent TH-based morphometric features (D) 3D skeleton and (E) fragmentation index. (C and D) n = 12–36 from five independent derivations. (F) Immunofluorescent identified TH+ neurons (green) undergoing apoptosis (TUNEL assay, red). Nuclei are shown in blue. Scale bar: 200 µm. (G) Box plot depicts the volume of TH neurons undergoing apoptosis (TH+, TUNEL+) normalized by the total TH. n = 7–16 organoids from three independent derivations. (H) Quantification of the relative abundance of lactate dehydrogenase (LDH) released into midbrain organoids media. n = 8–28 from three independent derivations. All data are presented as median with maximum/minimum or mean ± standard error of the mean. *P < 0.05, **P < 0.01, ***P < 0.001, ****P < 0.0001 using non-parametric multiple comparison Kruskal–Wallis test (A, E, G and H) or one-way ANOVA with a post hoc Tukey’s Honest Significant Difference test (C and D). Ctrl = control; iCtrl = isogenic control; PD = Parkinson’s disease; TUNEL = terminal deoxynucleotidyl transferase dUTP nick-end labelling.
Figure 6
Figure 6
p.R285Q Miro1 mutant aged mice presented dopaminergic neuron loss and behaviour alterations. (A) Agarose gel (left) and DNA sequencing (right) confirming the successful integration of the Miro1 point mutation. (B) Scheme illustrating the timeline of the experiments and the different mouse genotypes: wild-type mice (wt/wt), heterozygous (wt/R285Q) and homozygous (R285Q/R285Q). (C) Graphic depicts the percentage of striatal tyrosine hydroxylase-positive (TH+) area. (D) Left: Representative image of substantia nigra par compacta (SNpc) TH immunoreactivity. Scale bar: 50 µm. Quantification of the area occupied by TH in SNpc in 15-month-old mice (middle) or female only (right). (C and D) wt/wt: n = 2 males + 5 females; wt/R285Q: n = 3 males + 5 females; R285/R285Q: n = 4 males + 6 females. (E and F) Western blotting quantification (bottom) and representative image (top) of monomeric α-synuclein (E) and phosphorylated (p)S129 α-synuclein (F) in the striatum of female mice. wt/wt n = 9, R285Q/R285Q n = 10. Full membranes in the Supplementary material, ‘Western blotting data’ section. (G) Representative confocal images of pS129 α-synuclein (red) and TH-positive (green) signal in the SNpc of female wild-type (top) and homozygous (bottom) mice. Arrows depict pS129 α-synuclein intracellular inclusions. Scale bar: 20 µm. (H and I) Bar graph displays female mice latency to fall in seconds upon the first (H) and second (I) trials of the Rotarod behaviour test at 20 and 21 months, respectively. wt/wt: n = 4; wt/R285Q: n = 5; R285/R285Q: n = 6. Graphs are represented as mean ± standard error of the mean; each point represents one mouse. *P < 0.05, **P < 0.01 using non-parametric multiple comparison Kruskal–Wallis test (C, G and H) or unpaired t-test (D and E).

References

    1. Ou Z, Pan J, Tang S, et al. Global trends in the incidence, prevalence, and years lived with disability of Parkinson’s disease in 204 countries/territories from 1990 to 2019. Front Public Heal. 2021;9:776847. - PMC - PubMed
    1. Antony PMA, Diederich NJ, Krüger R, Balling R. The hallmarks of Parkinson’s disease. FEBS J. 2013;280:5981–5993. - PubMed
    1. Klosowiak JL, Park S, Smith KP, et al. Structural insights into Parkin substrate lysine targeting from minimal Miro substrates. Sci Rep. 2016;6:33019. - PMC - PubMed
    1. Grossmann D, Berenguer-Escuder C, Chemla A, Arena G, Krüger R. The emerging role of RHOT1/miro1 in the pathogenesis of Parkinson’s disease. Front Neurol. 2020;11:587. - PMC - PubMed
    1. Hsieh C-H, Li L, Vanhauwaert R, et al. Miro1 marks Parkinson’s disease subset and miro1 reducer rescues neuron loss in Parkinson’s models. Cell Metab. 2019;30:1131–1140.e7. - PMC - PubMed

MeSH terms