. 2025 Feb 7;387(6734):eadq7347.
doi: 10.1126/science.adq7347. Epub 2025 Feb 7.

Supersaturation mutagenesis reveals adaptive rewiring of essential genes among malaria parasites

Affiliations

Supersaturation mutagenesis reveals adaptive rewiring of essential genes among malaria parasites

Jenna Oberstaller et al. Science. .

Abstract

Malaria parasites are highly divergent from model eukaryotes. Large-scale genome engineering methods effective in model organisms are frequently inapplicable, and systematic studies of gene function are few. We generated more than 175,000 transposon insertions in the Plasmodium knowlesi genome, averaging an insertion every 138 base pairs, and used this "supersaturation" mutagenesis to score essentiality for 98% of genes. The density of mutations allowed mapping of putative essential domains within genes, providing a completely new level of genome annotation for any Plasmodium species. Although gene essentiality was largely conserved across P. knowlesi, Plasmodium falciparum, and rodent malaria model Plasmodium berghei, a large number of shared genes are differentially essential, revealing species-specific adaptations. Our results indicated that Plasmodium essential gene evolution was conditionally linked to adaptive rewiring of metabolic networks for different hosts.


Conflict of interest statement

Competing interests: U.S. patent 7932088 (26 April 2011), “High efficiency transformation of Plasmodium falciparum by the Lepidopteran transposon, piggyBac,” is held by inventors J.H.A., M. J. Fraser Jr., B. Balu, and D. A. Shoue. The invention relates to use of piggyBac as a tool for genetic manipulation of the Plasmodium genome.

Figures

Fig. 1.
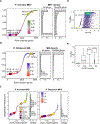
Fig. 1.. P. knowlesi A1-H.1 supersaturation mutagenesis.
(A) 176,823 pB insertions (blue) and genes (orange) mapped across chromosomes. Gene-height is scaled to P. knowlesi MIS, with lowest MIS/shortest genes having highest probability of being essential. TTAA density is indicated as a green line graph. (B) A close-up of a ~60kb region of P. knowlesi chromosome 12 syntenic with P. falciparum includes a conserved essential gene cluster (red arrows) and the artemisinin resistance-linked kelch13 (purple). (C) piggyBac insertion-site density distribution revealed ~75% fewer insertions recovered in coding regions (blue) than intergenic 5ʹ (yellow) and 3ʹ (green) regions, depicted as relative distance upstream and downstream of a gene, respectively. Arrow indicates increased frequency of disruption in last 1% of exon. (D) This study determined that under ideal in vitro culture conditions for asexual blood-stage growth in human RBCs, 61% of genes in the P. knowlesi genome have mutable CDSs, whereas 37% of genes have nonmutable (essential) CDSs, including 1% with tentative classification.
Fig. 2.
Fig. 2.. Genome-wide comparative mutability between P. knowlesi and P. falciparum.
(A) Chromosomes 9 and 14 are shown as examples (see fig. S7 for full maps). Orthologous genes with a single representative in both P. knowlesi (Pk) and P. falciparum (Pf) are shown in orange mapped to Pk chromosomes with height scaled by Pk MIS, Pk piggyBac insertions in navy blue and TTAA density as a green line graph as in Fig. 1. The bottom 4 tracks represent orthologous genes colored by comparative mutability category: purple, nonmutable in both species; orange, mutable in both species; pink, nonmutable in Pk but mutable in Pf; green, mutable in Pk but nonmutable in Pf. (B) Genome-wide totals by comparative mutability category. (C) A close-up of a syntenic region between Pk (top) and Pf (bottom) centered on an example of a gene nonmutable in Pk but highly mutable in Pf, GP2 (Golgi protein 2)(1). Pf MIS and insertion data from (2). Neighboring orthologs are also colored by comparative mutability category as in A. (D) A close-up of a syntenic region between Pk and Pf centered on a gene highly mutable in Pk but nonmutable in Pf, ICM1 (3). Neighboring orthologs are also colored by comparative mutability category (only Pf genes with Pk single-copy orthologs are plotted). (E) Comparative mutability between all three Plasmodium genome-scale essentiality screens. P. falciparum and P. knowlesi have approximately the same level of agreement overall with P. berghei targeted knockout data (4), suggesting no systemic biases in either piggyBac dataset. P. falciparum agreement was higher for nonmutable genes, while P. knowlesi agreement was higher for mutable genes.
Fig. 3.
Fig. 3.. Mutability comparisons between Plasmodium piggyBac datasets suggest essential genes tolerant to terminal truncation in P. knowlesi.
(A) All scored 1:1 orthologs broken into category by mutability in P. knowlesi and P. falciparum. The P. knowlesi-mutable-only category is inflated by terminal truncation mutants (mutants with insertions in last 5% of CDS) compared to genes mutable in both species, suggesting some genes mutable in P. knowlesi only are not truly dispensable. We used the clear patterns in the CDS insertion distribution for P. knowlesi-mutable-only genes as indicated to define common truncation types observed in mutable essential genes across the full dataset (genes with disruptions only in first 0–5% of CDS = genes tolerant of N-terminal truncation; genes with disruptions only in last 95–99% of the CDS = genes tolerant to C-terminal disruption). Genes having disruptions only in the last 1% of the CDS were not considered mutable for maximum compatibility with the Pf dataset. (B-C) Insertion maps are shown for three example genes from each category (C-terminal truncation, n = 139 genes; N-terminal truncation, n = 70 genes). Transcript CDS are presented in orange with direction of transcription indicated with an arrow. Flanking regions are included with each transcript CDS (2 kb on each side). Detected protein domains are colored by mutability (light green = mutable, pink = nonmutable, grey = no TTAA sites). Available TTAA-sites are indicated as dark green bars on each ideogram. Bottom tracks: recovered insertions are colored by insertion-type (5′ flanking sequence = bright green; CDS = dark blue; intron = teal; 3′ flanking sequence = yellow) and scaled by the log of normalized reads recovered across all transfections. The number of unique transfections containing each insertion is indicated as red scatterplot in bottom track. Bottom-track axes are scaled to min and max for each gene.
Fig. 4.
Fig. 4.. Supersaturation enables high-resolution gene essentiality scoring in P. knowlesi.
(A) The P. knowlesi MIS+ scores probability of being dispensable for 98% of P. knowlesi genes based on number of recovered CDS insertions relative to potential that could have been recovered, with 1 indicating highest probability of being dispensable. Example genes previously confirmed as essential (Kelch13, DHFR-TS, PKG, CDPK5) or dispensable (AP2-G, FC) during the P. falciparum asexual blood stage are highlighted. Distribution of genes at each score is indicated by the histograms. (B) P. falciparum MIS for the same orthologous genes. While relative scoring is similar for highlighted orthologous genes, the P. knowlesi curve has a probability range ~10% lower than the P. falciparum curve, indicating highest confidence scoring of essential genes. P. knowlesi mutable genes have scores distributed across the curve whereas P. falciparum mutable genes have a much narrower distribution limited to the top range of scores, indicating higher-resolution differentiation of relative essentiality across mutable genes. (C) The MFS estimates the relative growth fitness cost for mutating a gene based on its normalized QIseq sequencing reads distribution. P. knowlesi again has a wider differentiable range for relative fitness costs of mutable genes than P. falciparum. (D) P. knowlesi MFS and MIS+ are highly correlated (Pearson’s R = 0.81). (E) The first MFS quartile was composed of nonmutable genes, the fourth quartile was composed mostly of mutable genes, and the second and third quartiles had a mix of both.
Fig. 5.
Fig. 5.. Void regions indicate more disruption-tolerant essential genes.
(A) Exonic sliding window analysis to systematically identify regions within genes void of insertion. As saturation was well above gene-level but not quite individual TTAA-site-level, all P. knowlesi exons were divided into 500bp sliding windows (step size = 1bp) to evaluate essentiality at sub-gene level. Windows with high TTAA density (≥12/kb) were evaluated for regions significantly void of insertion. 1487 mutable genes had windows meeting criteria for scoring; 420 of those had void regions. 99 of those overlapped with genes already classified as N- or C-terminally truncated, leaving 321 genes with disruptions in the core 90% of CDS that may still be essential. (B) Analogous methods to assigning MFS to full genes were used to assign wMFS to sliding windows (see Methods). Sliding windows were then ranked by wMFS and plotted. Lowest numbers indicate most significant voids. (C) Example mutable genes identified as having significant void regions by sliding window analysis. Transcript map legends are as in figure 3. Horizon plots show regions scored via sliding window analysis colored by wMFS with shades of purple indicating negative values (voids) and shades of green indicating positive values (mutable) normalized for each gene. (D) Disruption-tolerant essential genes have lower propensity for disruption (MIS+) and (E) mutants are less ‘fit’ (MFS) than mutants with insertions in truly dispensable genes. ‘Core-mutable’ category includes all genes without void regions having insertions in the core 90% of the CDS (n = 2717). ****Wilcoxon p <= 0.0001. (F) Disruption-tolerant essential genes have lower expression than essential genes but higher expression than truly dispensable genes across the IDC. Pf RNAseq expression data from (5). Ring, troph and schizont stages correspond to Pf timepoints 8, 24 and 40 hours post-infection, respectively. ‘Tolerant’ category includes all C/N-terminal truncations and genes with nonmutable windows (n = 546). **Wilcoxon p <= 0.01. ****Wilcoxon p <= 0.0001. (G) Though the P. knowlesi NOT1 ortholog is highly mutable, the region containing the DUF3819 and the CAF1-interacting domain are void of insertion. Legend as in Fig. 4C. (H) The P. falciparum NOT1 ortholog is also highly mutable. Density of insertion is not high enough to identify voids within P. falciparum genes, though the insertion pattern is like that observed in P. knowlesi, further suggesting insertion distribution is non-random and that essential functions are conserved.
Fig. 6.
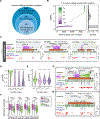
Fig. 6.. Essential gene evolution in malaria parasites was conditionally linked to adaptive metabolic network-rewiring for survival in different host environments.
(A) Flow diagram showing P. knowlesi, P. falciparum and P. berghei essentiality classifications for all single-copy orthogroups for which essentiality was determined in at least two species (n = 4370; see table S5). Essentiality is indicated in the first three column nodes by species. Magenta flow indicates genes essential across species, while orange indicates genes dispensable across species. Dark grey flows indicate genes that switch essentiality across species. The final column shows final three-species essentiality category with percents calculated out of genes scored in all three species (n = 2346). Flows corresponding to comparisons highlighted in (B-C) are shown with red species-label indicating essential and black indicating dispensable in each 3-way comparison. NS = not scored. (B) Functional enrichment of genes dispensable in all three Plasmodium species (n = 607; left, orange bubbles) vs. genes essential in all three species (right, purple bubbles; n = 884). Position on the y-axis and circle-size indicates the significance of each GO term; only significant terms are plotted (weight01 adjusted p-value <=0.05). The x-axis indicates relative essentiality in P. knowlesi of each term based on average MIS+ of all genes mapped to that term in the analysis (essentiality increases left to right). Positions are approximate to avoid point and label overlap. (C) GO enrichment results for genes differentially essential in P. falciparum vs. P. knowlesi and P. berghei as indicated in (B). Axes and legend are as in (B). Circle-color is based on essentiality in P. knowlesi (green = dispensable; pink = essential).
Fig. 7.
Fig. 7.. Key genes at the host-parasite interface, DNA metabolism are differentially essential in Plasmodium: targeted validation.
(A) Clonal P. knowlesi knockout parasite-lines were generated for seven genes in processes of interest, shown overlaid on the essentiality flows from Fig. 7A colored by relevant pairwise- or three-species comparative essentiality category. Shared-essential and Shared-dispensable genes across all three species are colored as in Fig. 7A (magenta, orange). (B) Targeted knockout clone validation. Clones were grown for ~10 cycles to check stability by genotyping. Each gene knockout line was validated via PCR using (1) a CDS-specific forward primer (‘CDS’ lane) and (2) an mNeonGreen forward primer (‘NEON’ lane), both paired with the flanking gene-specific 3’UTR reverse primer (table S8). Successful knockout lines are positive only for NEON, while wildtype is positive only for CDS. (C) Targeted knockout clone growth assays. Parasitemia was measured from 100,000 red blood cells for each line using flow cytometry. Remaining culture was adjusted to 1% parasitemia each day. The process was repeated for three invasion cycles with growth recorded each day. Strains were grown in triplicate wells, and parasitemia at each time point was calculated as a mean across the three wells. (D) Growth rate of pure clonal knockout lines vs. wildtype was measured as fold-change parasitemia over 3 cycles (72 hours). See methods. ****p < 0.0001, one-way ANOVA with Dunnett’s multiple comparison.

Comment in

  • Not just monkey business.
    Moon RW, Bushell ESC. Moon RW, et al. Science. 2025 Feb 7;387(6734):582-583. doi: 10.1126/science.adv2328. Epub 2025 Feb 6. Science. 2025. PMID: 39913602

References

    1. World malaria report 2021 (9789240040496 (electronic version) 9789240040502 (print version), 2021. https://iris.who.int/handle/10665/350147).
    1. World malaria report 2022 (9789240064898 (electronic version) 9789240064904 (print version), 2022. https://iris.who.int/handle/10665/365169).
    1. Escalante AA, Cepeda AS, Pacheco MA, Why Plasmodium vivax and Plasmodium falciparum are so different? A tale of two clades and their species diversities. Malaria Journal 21, 139 (2022). - PMC - PubMed
    1. Bushell E et al., Functional Profiling of a Plasmodium Genome Reveals an Abundance of Essential Genes. Cell 170, 260–272.e268 (2017). - PMC - PubMed
    1. Zhang M et al., Uncovering the essential genes of the human malaria parasite Plasmodium falciparum by saturation mutagenesis. Science 360, eaap7847 (2018). - PMC - PubMed

Substances