. 2025 Feb 6;20(2):e0303486.
doi: 10.1371/journal.pone.0303486. eCollection 2025.

The impact of apolipoprotein E, type ∊4 allele on Alzheimer's disease pathological biomarkers: a comprehensive post-mortem pilot-analysis

Affiliations

The impact of apolipoprotein E, type ∊4 allele on Alzheimer's disease pathological biomarkers: a comprehensive post-mortem pilot-analysis

Ziyu Wan et al. PLoS One. .

Abstract

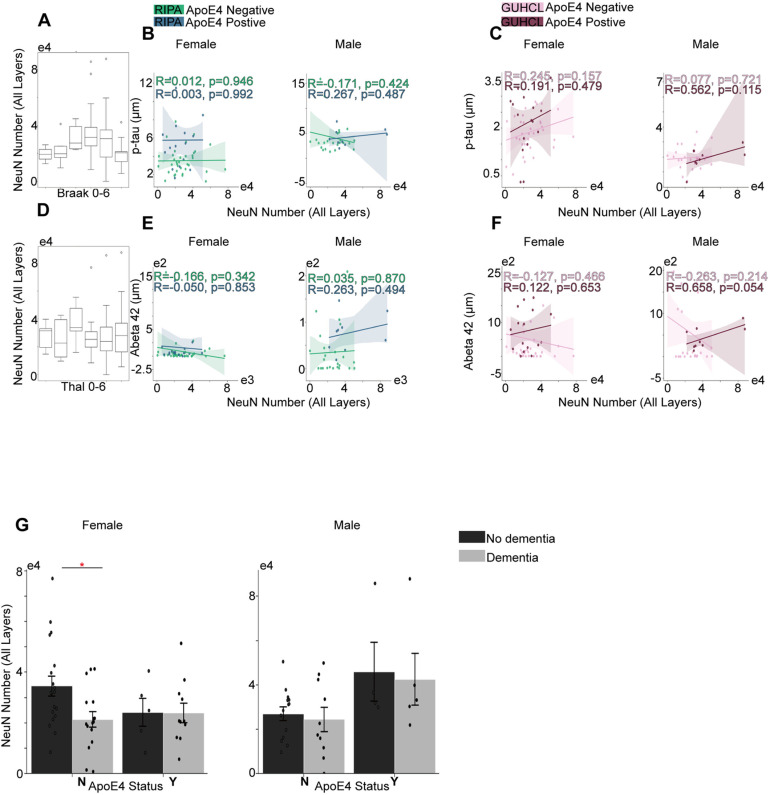
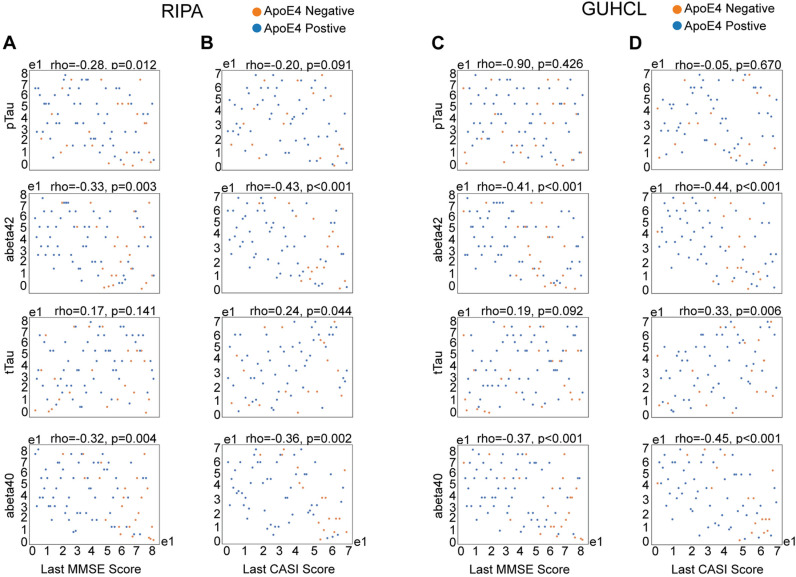
The apolipoprotein E type ∊4 allele (ApoE4) is known as the strongest genetic risk factor for Alzheimer's Disease (AD). Meanwhile, many aspects of its impact on AD pathology remain underexplored. This study conducts a systematic data analysisof donor data from the Seattle Alzheimer's Disease Brain Cell Atlas. Our investigation delves into the intricate interplay between identified biomarkers and their correlation with ApoE4 across all severities of AD. Employing Pearson R correlation, and one-way and two-way ANOVA tests, we elucidate the pathological changes in biomarkers and the altering effects of ApoE4. Remarkably, the phosphorylation of tau observed in neurofibrillary tangles (NFTs) marked by the AT8 antibody, emerges as the most correlated factor with other pathological biomarkers. This correlation is mediated by both tau and amyloid pathology, suggesting a higher hierarchical role in determining AD pathological effects than other biomarkers. However, non-ApoE4 carriers exhibit a more significant correlation with disease progression severity compared to ApoE4 carriers, though ApoE4 carriers demonstrate significance in exacerbating the effect of accumulating phosphorylated tau and amyloid plaques assessed by AT8 and 6E10 antibodies. Furthermore, our analysis does not observe dramatic neuronal changes in grey matter across the span of AD pathology. Glia activation, measured by Iba1 and GFAP, demonstrates an amyloid-specific correlation. This research marks the first human post-mortem analysis providing a comprehensive examination of prevailing AD biomarkers and their interconnectedness with pathology and ApoE4 genetic factor. Limitations in the study are acknowledged, underscoring the need for further exploration and refinement in future research endeavors.


Conflict of interest statement

The authors have declared that no competing interests exist.

Figures

Fig 1
Fig 1. Grey matter AT8 positive cells over the progression of Tau phosphorylation and Aβ aggregation, and their associations with ApoE4 and cognitive status.
(A) Total number of AT8’s progression in correlation with Braak stages. (B) The association between Ripa immunoassay of p-Tau level and the total number of AT8 under different sex groups. (C) The association between Guhcl protein precipitation of p-Tau level and the total number of AT8 in different sex groups. (D) Total number of AT8’s progression in correlation with Thal stages. (E) The association between Ripa immunoassay of Aβ42 level and the total number of AT8 in different sex groups. (F) The association between Guhcl protein precipitation of Aβ42 level and the total number of AT8 in different sex groups. (G) ApoE4 and cognitive status influence on AT8 cells aggregation under different sex groups. (H) ApoE4and cognitive status influences on p-Tau levels (Ripa and Guhcl) under different sex groups. Pearson’s R correlation was conducted B-C, and E-F. Two-way ANOVA and Tukey’s HSD post-hoc analysis was used for G and H. Data represent mean ±  SEM. * p <  0.05; **p <  0.01; ***p <  0.001; ****p <  0.0001.
Fig 2
Fig 2. Grey matter 6e10 positive cells over the progression of Tau phosphorylation and Aβ aggregation, and their associations with ApoE4 and cognitive status.
(A) Total number of 6e10’s progression in correlation with Braak stages. (B) The association between Ripa immunoassay of p-Tau level and the total number of 6e10 under different sex groups. (C) The association between Guhcl protein precipitation of p-Tau level and the total number of 6e10 different sex groups. (D) Total number of 6e10’s progression in correlation with Thal stages. (E) The association between Ripa immunoassay of Aβ42 level and the total number of 6e10 in different sex groups. (F) The association between Guhcl protein precipitation of Aβ 42 level and the total number of 6e10 in different sex groups. (G) ApoE4 and Cognitive status influences on 6e10 cells aggregation under different sex groups. (H) ApoE4 and Cognitive status influences on Aβ42 levels (Ripa and Guhcl) under different sex groups. Pearson’s R correlation was conducted B-C, and E-F. Two-way ANOVA and Tukey’s HSD post-hoc analysis was used for G and H. Data represent mean ±  SEM. * p <  0.05; **p <  0.01; ***p <  0.001; ****p <  0.0001.
Fig 3
Fig 3. Grey matter Iba1 activation over the progression of Tau phosphorylation and Aβ aggregation, and their associations with ApoE4 and cognitive status.
(A) Total number of Iba1’s progression in correlation with Braak stages. (B) The association between Ripa immunoassay of p-tau level and the total number of Iba1 under different sex groups. (C) The association between Guhcl protein precipitation of p-Tau level and the total number of Iba1 different sex groups. (D) Total number of Iba1’s progression in correlation with Thal stages. (E) The association between Ripa immunoassay of Aβ42 level and the total number of Iba1 in different sex groups. (F) The association between Guhcl protein precipitation of Aβ42 level and the total number of Iba1 in different sex groups. (G) ApoE4 and Cognitive status influences on Iba1 cells aggregation under different sex groups. Pearson’s R correlation was conducted B-C, and E-F. Two-way ANOVA and Tukey’s HSD post-hoc analysis was used for G. Data represent mean ±  SEM. * p <  0.05; **p <  0.01; ***p <  0.001; ****p <  0.0001.
Fig 4
Fig 4. Grey matter GFAP activation over progression of Tau phosphorylation and A
β aggregation, and their associations with ApoE4 and cognitive status. (A) Total number of GFAP’s progression in correlation with Braak stages. (B) The association between Ripa immunoassay of p-tau level μm and the total number of GFAP under different sex groups. (C) The association between Guhcl protein precipitation of p-Tau level and the total number of GFAP different sex groups. (D) Total number of GFAP’s progression in correlation with Thal stages. (E) The association between Ripa immunoassay of Aβ42 level μm and the total number of GFAP in different sex groups. (F) The association between Guhcl protein precipitation of Aβ42 level and the total number of GFAP in different sex groups. (G) ApoE4 and Cognitive status influences on GFAP cell aggregation under different sex groups. Pearson’s R correlation was conducted B-C, and E-F. Two-way ANOVA and Tukey’s HSD post-hoc analysis was used for G. Data represent mean ±  SEM. * p <  0.05; **p <  0.01; ***p <  0.001; ****p <  0.0001.
Fig 5
Fig 5. Grey matter NeuN number over the progression of Tau phosphorylation and Aβ aggregation, and their associations with ApoE4 and cognitive status.
(A) Total number of NeuN’s progression in correlation with Braak stages. (B) The association between Ripa immunoassay of p-tau level and the total number of NeuN under different sex groups. (C) The association between Guhcl protein precipitation of p-Tau level and the total number of NeuN different sex groups. (D) The total number of NeuN’s progression is in correlation with the Thal stages. (E) The association between Ripa immunoassay of Aβ42 level and the total number of NeuN in different sex groups. (F) The association between Guhcl protein precipitation of Aβ42 level and the total number of NeuN in different sex groups. (G) ApoE4 and Cognitive status influences on NeuN cell aggregation under different sex groups. Pearson’s R correlation was conducted B-C, and E-F. Two-way ANOVA and Tukey’s HSD post-hoc analysis was used for G. Data represent mean ±  SEM. * p <  0.05; **p <  0.01; ***p <  0.001; ****p <  0.0001.
Fig 6
Fig 6. Receiver Operating Characteristics (ROC) curves for different diagnostic ratios in predicting AD dementia.
The curves represent the performance of the pTau/Aβ42 ratio (blue), tTau/Aβ42 ratio (green), pTau/tTau ratio (red), and Aβ42/40 ratio (orange). The area under the curve (AUC) for each ratio is indicated in the legend. The grey dashed line represents the no-discrimination line, where the classifier has no predictive ability. (A) ROC curves for the pTau/Aβ42, tTau/Aβ42, pTau/tTau, and Aβ42/40 ratios, measured using the Ripa immunoassay, to predict AD dementia. (B) ROC curves for the pTau/Aβ42, tTau/Aβ42, pTau/tTau, and Aβ42/40 ratios, measured using the Guhcl protein precipitation, to predict AD dementia. (C) Spearman correlation between ranked MMSE scores and pTau/Aβ42, tTau/Aβ42, pTau/tTau, and Aβ42/40 ratios under Ripa immunoassay. (D) Spearman correlation between ranked CASI scores and pTau/Aβ42, tTau/Aβ42, pTau/tTau, and Aβ42/40 ratios under Ripa immunoassay. (E) Spearman correlation between ranked MMSE scores and pTau/Aβ42, tTau/Aβ42, pTau/tTau, and Aβ42/40 ratios under Ripa immunoassay. (F) Spearman correlation between ranked CASI scores and pTau/Aβ42, tTau/Aβ42, pTau/tTau, and Aβ42/40 ratios under Guhcl protein precipitation.
Fig 7
Fig 7. Spearman’s correlation of individual biomarkers and cognitive MMSE and CASI scores under the influence of ApoE4 status.
A) Spearman correlation between ranked MMSE scores and pTau, Aβ42, tTau, and Aβ40 under Ripa immunoassay. (B) Spearman correlation between ranked CASI scores and pTau, Aβ42, tTau, and Aβ40 under Ripa immunoassay. (C) Spearman correlation between ranked MMSE scores and pTau, Aβ42, tTau, and Aβ40 under Guhcl protein precipitation. (D) Spearman correlation between ranked CASI scores and pTau, Aβ42, tTau, and Aβ40 under Guhcl protein precipitation.
Fig 8
Fig 8. Clustered heatmaps of all pathological biomarkers intercorrelations.
Pearson correlation was conducted and labeled with each of the biomarkers represented on the Heatmap. Correlation scale from -1 to 1, that -1 means the least correlated and 1 means the most correlated, indicating by color from blue to red. (A) heatmap of biomarker and antibodies in grey matter with correlation in white font and p value in green labeled in each box. (B) Clustered heatmap of biomarker and antibodies in grey matter with correlation in black font labeled in each box.

Similar articles

Cited by

References

    1. Saunders AM, Strittmatter WJ, Schmechel D, George-Hyslop PH, Pericak-Vance MA, Joo SH, et al.. Association of apolipoprotein E allele epsilon 4 with late-onset familial and sporadic Alzheimer’s disease. Neurology. 1993. Aug;43(8):1467–72. doi: 10.1212/wnl.43.8.1467 - DOI - PubMed
    1. Belloy ME, Napolioni V, Greicius MD. A quarter century of APOE and Alzheimer’s disease: progress to date and the path forward. Neuron. 2019. Mar;101(5):820–38. doi: 10.1016/j.neuron.2019.01.056 - DOI - PMC - PubMed
    1. Farrer L, Cupples L, Haines J, Hyman B, Kukull W, Mayeux R, et al.. Effects of age, sex, and ethnicity on the association between apolipoprotein E genotype and Alzheimer disease: a meta-analysis. JAMA. 1997. Oct 22;278(16):1349–56. - PubMed
    1. Corder EH, Saunders AM, Strittmatter WJ, Schmechel DE, Gaskell PC, Small GW, et al.. Gene dose of apolipoprotein E type 4 allele and the risk of Alzheimer’s disease in late onset families. Science. 1993. Aug 13;261(5123):921–3. doi: 10.1126/science.8346443 - DOI - PubMed
    1. Kockx M, Traini M, Kritharides L. Cell-specific production, secretion, and function of apolipoprotein E. J Mol Med. 2018. May 1;96(5):361–71. - PubMed

MeSH terms