. 2025 Mar:113:105569.
doi: 10.1016/j.ebiom.2025.105569. Epub 2025 Feb 5.

Using multiomic integration to improve blood biomarkers of major depressive disorder: a case-control study

Affiliations

Using multiomic integration to improve blood biomarkers of major depressive disorder: a case-control study

Amazigh Mokhtari et al. EBioMedicine. 2025 Mar.

Abstract

Background: Major depressive disorder (MDD) is a leading cause of disability, with a twofold increase in prevalence in women compared to men. Over the last few years, identifying molecular biomarkers of MDD has proven challenging, reflecting interactions among multiple environmental and genetic factors. Recently, epigenetic processes have been proposed as mediators of such interactions, with the potential for biomarker development.

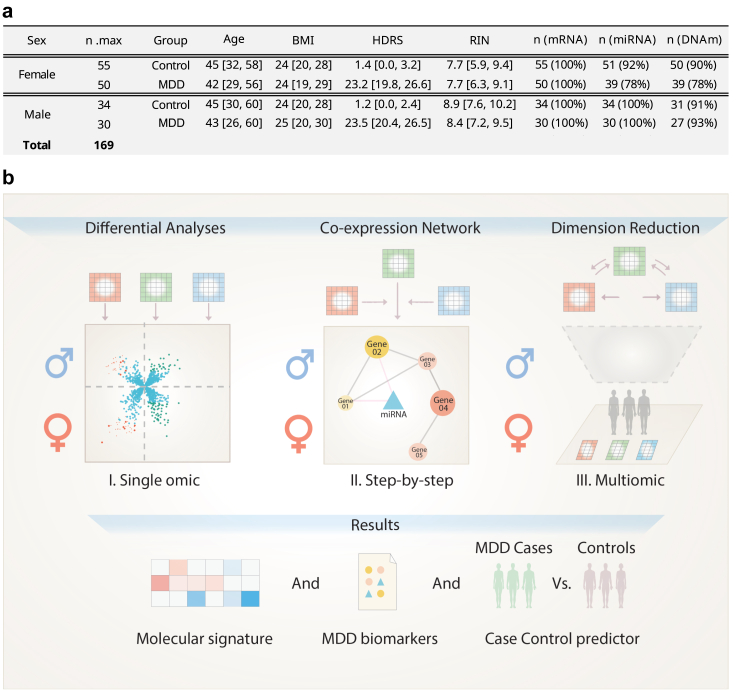
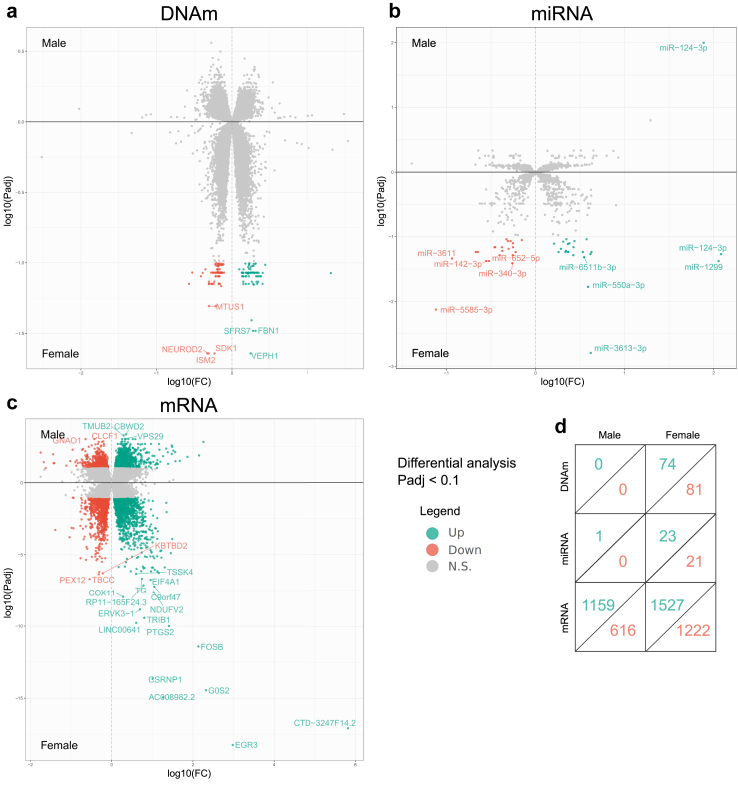
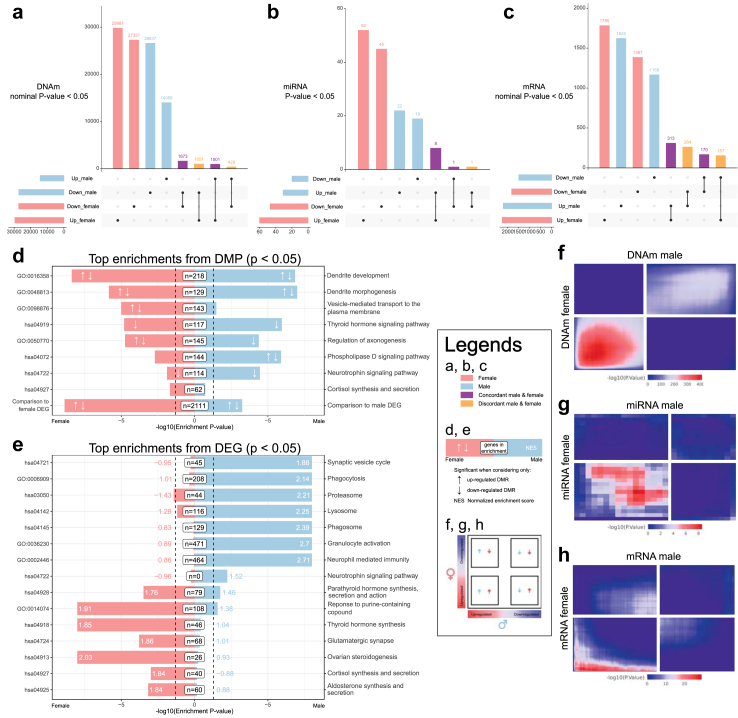
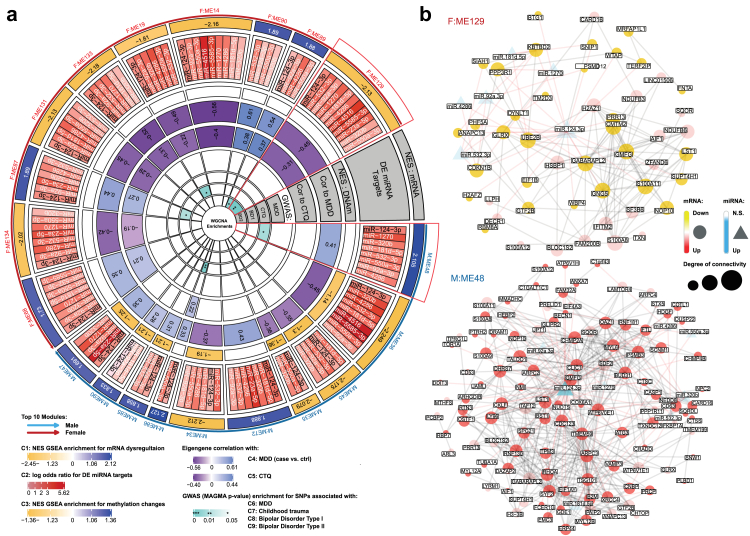
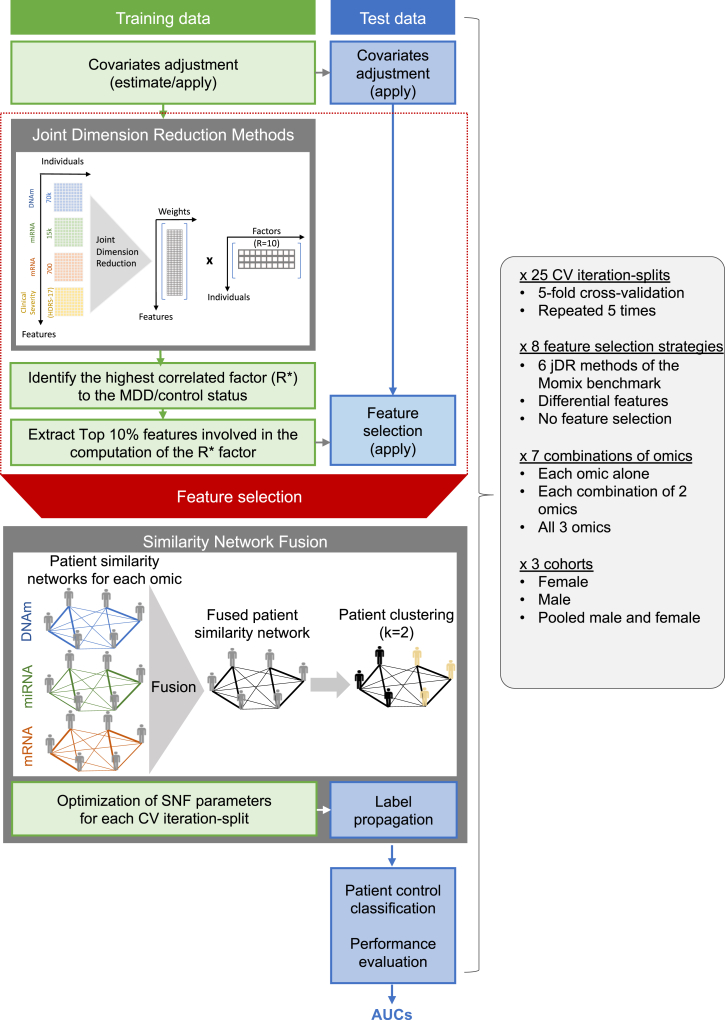
Methods: We characterised gene expression and two mechanisms of epigenomic regulation, DNA methylation (DNAm) and microRNAs (miRNAs), in blood samples from a cohort of individuals with MDD and healthy controls (n = 169). Case-control comparisons were conducted for each omic layer. We also defined gene coexpression networks, followed by step-by-step annotations across omic layers. Third, we implemented an advanced multiomic integration strategy, with covariate correction and feature selection embedded in a cross-validation procedure. Performance of MDD prediction was systematically compared across 6 methods for dimensionality reduction, and for every combination of 1, 2 or 3 types of molecular data. Feature stability was further assessed by bootstrapping.

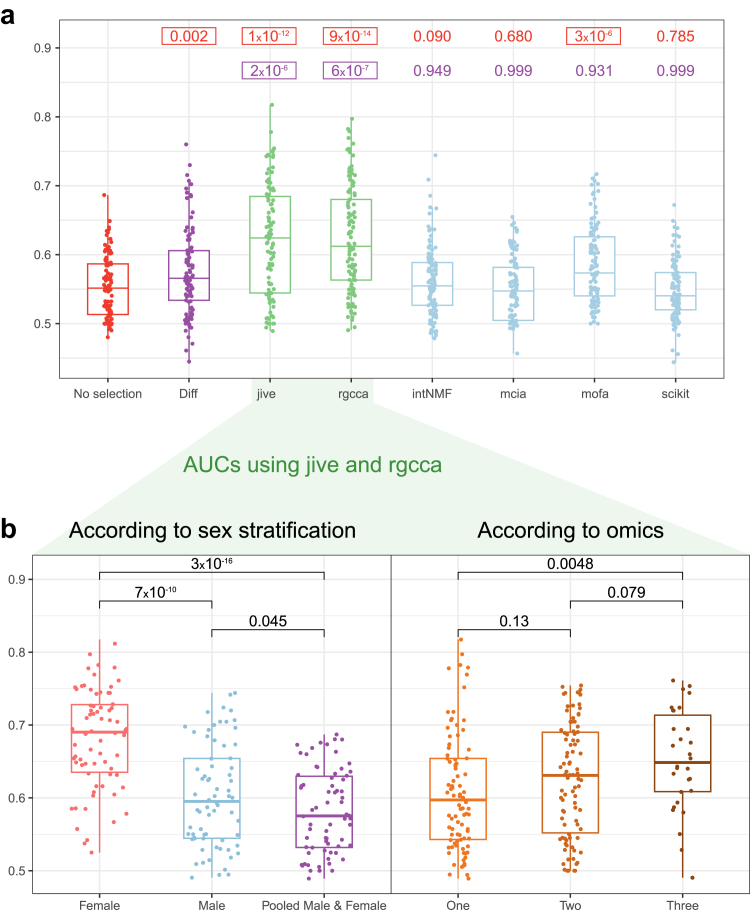
Findings: Results showed that molecular and coexpression changes associated with MDD were highly sex-specific and that the performance of MDD prediction was greater when the female and male cohorts were analysed separately, rather than combined. Importantly, they also demonstrated that performance progressively increased with the number of molecular datasets considered.

Interpretation: Informational gain from multiomic integration had already been documented in other medical fields. Our results pave the way toward similar advances in molecular psychiatry, and have practical implications for developing clinically useful MDD biomarkers.

Funding: This work was supported by the Centre National de la Recherche Scientifique (contract UPR3212), the University of Strasbourg, the Université Sorbonne Paris Nord, the Université Paris Cité, the Fondation de France (FdF N° Engt:00081244 and 00148126; ECI, IY, RB, PEL), the French National Research Agency (ANR-18-CE37-0002, BE, CMC, ADD, PEL, ECI; ANR-18-CE17-0009, ADD; ANR-19-CE37-0010, PEL; ANR-21-RHUS-009, ADD, BE, CMC, CCB; ANR-22-PESN-0013, ADD), the Fondation pour la Recherche sur le Cerveau (FRC 2019, PEL), Fondation de France (2018, BE, CMC, ADD) and American Foundation for Suicide Prevention (AFSP YIG-1-102-19; PEL).

Keywords: DNA methylation; Depression; Multiomic integration; Sex differences; Transcriptomic; microRNA.


Conflict of interest statement

Declaration of interests BE received grants from ‘Agence Nationale de la Recherche (ANR)’ and consulting fees from Sanofi Winthrop. All other authors declare no competing interests.

Figures

Fig. 1
Fig. 1
Cohort characteristics and overview of data analysis strategies. a. Cohort description: summary table detailing the cohort statistics according to sex, including the number of controls and patients with MDD and the proportion of participants for which DNAm, mRNA and miRNA data were available. b. Omics data integration: summary of the analytical strategies employed in the study: (1) single-omic differential analyses; (2) gene co-expression analysis followed by step-by-step integration; (3) advanced multiomic integration. Expected outcomes of these analyses included the description of a molecular signature of MDD, the identification of potential MDD biomarkers, and the development of a predictive model for distinguishing patients with MDD from controls. BMI: body mass index; HDRS: Hamilton depression rating scale; RIN: RNA integrity number.
Fig. 2
Fig. 2
Differential analysis results for single-omic comparisons of patients with MDD and controls. Representation of results obtained for sex-specific analyses in male and female cohorts, with double volcano plots for differentially methylated CG sites (DNAm, panel a), differentially expressed miRNAs (b) or mRNAs (c), as well as counts of features with an adjusted p-value ≤0.1 (d; see main text for details).
Fig. 3
Fig. 3
Comparisons across females and males of molecular changes associated with MDD. a. Overlap of DMPs (nominal p-value ≤0.05, WT). b. Overlap of DEmiRNAs (nominal p-value ≤0.05, WT). c. Overlap of DEGs (nominal p-value ≤0.05, WT). d. Top functional enrichments of differentially methylated DNAm probes (DMP, passing nominal p-value ≤0.05), identified using missMethyl. Enrichments were computed by hypergeometric testing against Gene Ontology terms (see Methods), or against the present's study list of DEG identified in male or female patients with MDD (last line, n = 2111). The figure depicts the number of genes in each enrichment, while arrows indicate whether enrichments originated from up- or down-regulated DMP, or both (no arrow). e. Top functional enrichments of mRNA dysregulations (adjusted p-value ≤0.05, hypergeometric test) associated with MDD, identified using GSEA. Numbers at the end of each bar indicate the normalised enrichment score (NES), whose sign indicates whether enrichments originated from up- or down-regulated mRNAs. f–h. Heatmaps representing two-sided rank–rank hypergeometric overlap analyses (using the RRHO2 algorithm), and displaying threshold-free overlaps among molecular changes associated with MDD in male and female cohorts.
Fig. 4
Fig. 4
Sex-specific WGCNA modules prioritised for their association with MDD. a. Circos plot of the top 10 MDD related modules in females and males: each triangular section represents a module. Male modules are highlighted in blue, female ones in red. Concentric circles represent results from step-by-step enrichment or correlation tests conducted for prioritisation. From the outside to the inside, Circle 1 (C1): enrichment test for MDD-related mRNA dysregulation (normalised enrichment score, NES, GSEA); C2: DEmiRNAs targets enrichment test (log odds-ratio); C3: enrichment tests for MDD-related DNAm methylation dysregulation (NES, GSEA); C4-5: correlation test between module eigengenes and MDD status (C4), or CTQ score (Childhood Trauma Questionnaire, C5); C6-9: enrichment tests for SNPs associated with MDD (C6), childhood trauma (C7), bipolar disorder type I (C8) or II (C9) in genome-wide association studies (computed using the MAGMA approach, see main text; p-value). A colour gradient was applied for each module's enrichment that met statistical significance (p-value < 0.05). b. Graphical network representation of the 2 modules most strongly associated with MDD (M:ME48 and F:ME129). These 2 modules, as well as others, were enriched for genes identified in RRHO2 as showing opposite MDD-related mRNA changes in females as opposed to males (Fig. 3h). The circle-shaped vertices represent genes, the triangle ones miRNAs. Grey-coloured edges correspond to weighted co-expression between genes, those in red to pairs of miRNAs and their know targets in the mirBase database. The size of the vertices is proportional to their degree of connectivity.
Fig. 5
Fig. 5
Summary of the multiomic integration and classification framework. For each of the 25 splits of a 5-fold cross validation (with 5 repetitions), every combination of 1, 2 or 3 types of omic data, as well as clinical severity of depression (scores from the 17-item Hamilton rating scale for depression) were given as inputs to 6 different joint dimension reduction methods (jDR). For each train dataset, the resulting factor matrices were then correlated with the MDD/control status, and the top 10% of omic features contributing to the best factor (i.e., showing highest correlation with MDD) were extracted to construct new matrices with only those selected features. A multiomic similarity matrix was then generated for each train set, using SNF, in order to infer 2 clusters of individuals. Finally, covariate correction and feature selection from each train set were applied to each corresponding test set, and the SNF label propagation procedure applied to predict the group of new individuals in each test set.
Fig. 6
Fig. 6
Comparisons of MDD/control classification performance across different combinations of omic data, and stratification by sex. a. Boxplot of AUCs (Area Under the Curve) obtained for each of 7 feature selection methods: differential analyses, Diff; jive; rgcca; intNMF; mcia; mofa; scikit; or no selection. Mean AUCs for each method were first compared to those obtained using differential analyses (p-values in purple) or without any selection (p-values in red, t-tests). AUCs were computed on the test data for each of the 25 splits of the cross-validation (5-fold, with 5 repetitions) for every combination of 1, 2 or 3 types of omic data, for males, females, or pooled cohorts. b. Detailed representation of the performance achieved by the 2 best joint dimension reduction methods (JIVE and RGCCA) according to sex stratification and the number of omic data considered (p-values correspond to pair-wise comparisons).

References

    1. Hasin D.S., Sarvet A.L., Meyers J.L., et al. Epidemiology of adult DSM-5 major depressive disorder and its specifiers in the United States. JAMA Psychiatr. 2018;75:336–346. - PMC - PubMed
    1. Tam J., Mezuk B., Zivin K., Meza R.U.S. Simulation of lifetime major depressive episode prevalence and recall error. Am J Prev Med. 2020;59(2):e39–e47. - PMC - PubMed
    1. Gutiérrez-Rojas L., Porras-Segovia A., Dunne H., Andrade-González N., Cervilla J.A. Prevalence and correlates of major depressive disorder: a systematic review. Rev Bras Psiquiatr Sao Paulo Braz 1999. 2020;42:657–672. - PMC - PubMed
    1. Albert P.R. Why is depression more prevalent in women? J Psychiatry Neurosci. 2015;40:219–221. - PMC - PubMed
    1. Marx W., Penninx B.W.J.H., Solmi M., et al. Major depressive disorder. Nat Rev Dis Primer. 2023;9:44. - PubMed

LinkOut - more resources